.NET Tools
Essential productivity kit for .NET and game developers
Profiling QuestPDF: In Pursuit of Performance

QuestPDF is an open-source (OSS) .NET library for generating PDF documents. As part of our OSS Power-Ups, we highlight projects like QuestPDF to help raise awareness of noteworthy open-source projects in the .NET community. We also support projects through sponsorship and the expertise of our developer advocates to help with code, documentation, performance, and more.
After our live stream with QuestPDF maintainer Marcin Ziąbek, we started looking into the performance of this popular .NET library. Since QuestPDF is used by many applications to generate all kinds of PDF documents, such as reports and invoices, any performance gains we could contribute to the library would also benefit their user base.
In this blog post, we’ll explore how we went about profiling QuestPDF. We’ll dive into how we used our profiling tools, dotTrace and dotMemory, to analyze hot paths in QuestPDF code. You’ll also see how some small code changes can have a big impact on performance and memory usage.
Exploring QuestPDF and building a baseline
When profiling, it’s good to have a starting point, such as a scenario you want to explore and optimize. QuestPDF is quite versatile, and each user of the library has their own unique requirements for building PDF documents. As such, finding a scenario that would cover all use cases was not easy.
Luckily for us, Marcin pointed us to this test that generates a PDF with a table of 10 columns and 100,000 rows. Many developers using QuestPDF generate tables in their documents. Though few would probably build a table this large, it’s best to test the extreme cases so the signals become clearer. This scenario also uses a lot of text formatting, which is common for QuestPDF users.
This is a good approach for any project. You can implement a feature, and when you see it’s commonly used, you can use a profiler to reduce its time or space complexity. Once you identify hot paths in the application, you can put them under some more load to get clear signals about possible improvements.
Once you have a scenario to profile, the first profiler snapshot you create will serve as the performance baseline that you will be able to compare with and improve on.
We started with timeline profiling in dotTrace, right from within JetBrains Rider. Note that there are other ways to profile your application, for example as part of unit tests or your CI/CD process.
Timeline profiling is good to start with because it provides accurate information about how long each method takes to execute, and it correlates method call timings, basic allocation data, exceptions, SQL logs, HTTP logs, file I/O, and more.
On Windows, you can open the resulting snapshot in the dotTrace Timeline viewer, where you can see all of this data combined with the timeline of the program execution. Here’s the initial snapshot we captured:
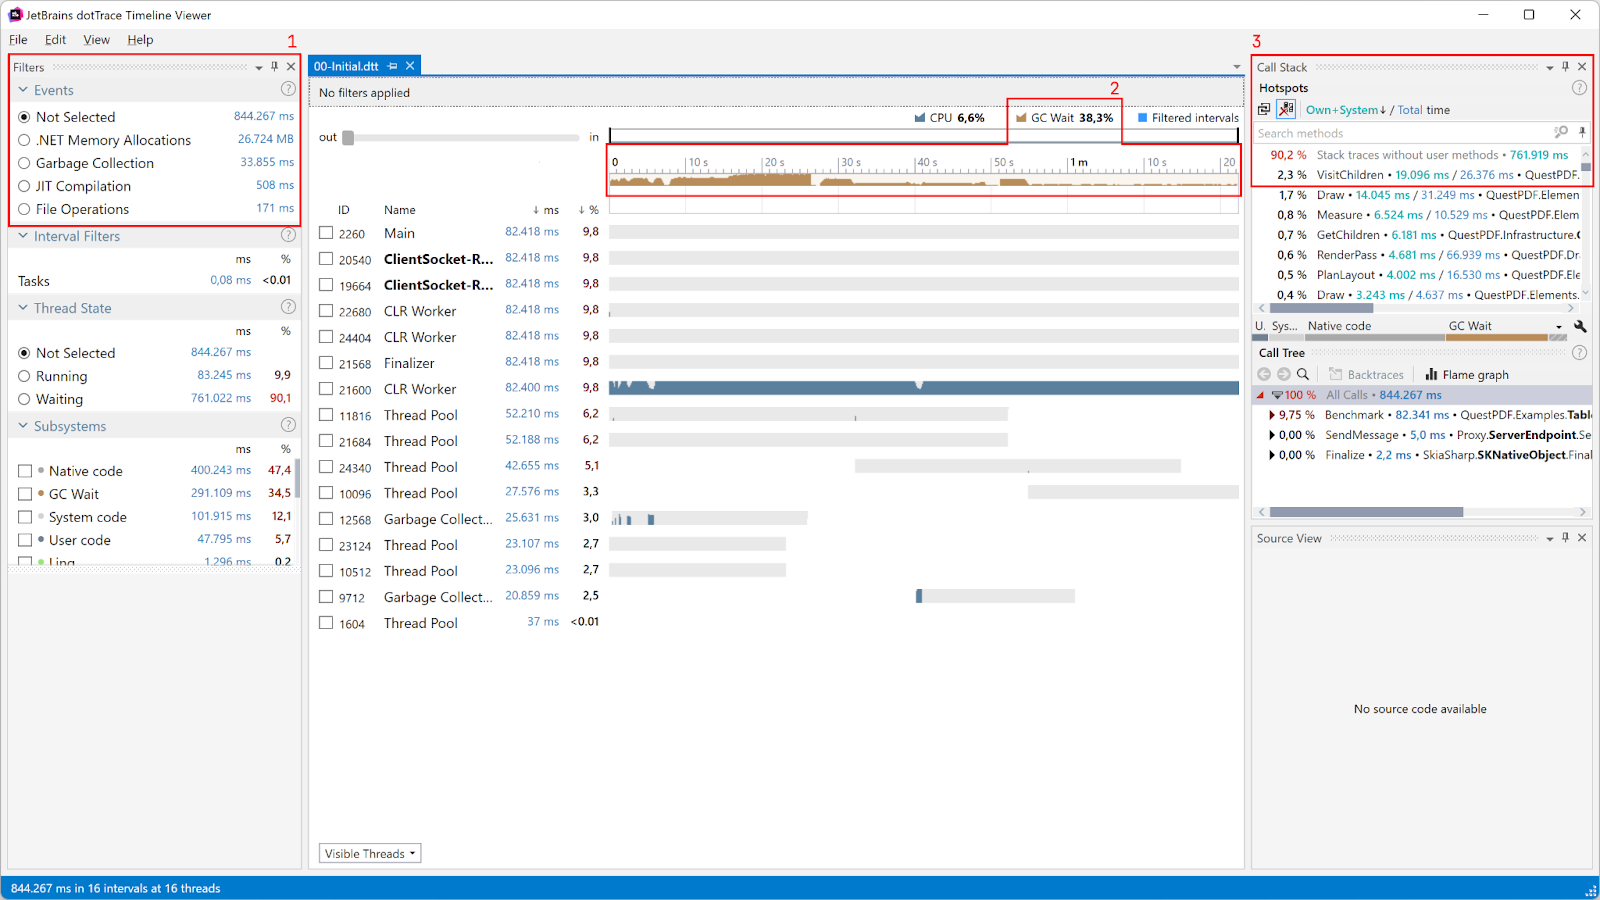
Here are the statistics that stand out in this snapshot and are worth looking into:
- In the top left-hand corner (1), we can see the total execution time is 844,267 ms. This may be good to try and get down.
- Also in (1), .NET Memory Allocations equal 26,724 MB. Note that this is not the total memory usage of QuestPDF! It’s the total amount of memory allocated for the duration of profiling, and includes memory cleaned up by the Garbage Collector (GC).
27 GB of memory is quite a lot, though. The GC has to do a lot of work reclaiming this memory all the time, potentially leading to extra CPU usage and even resulting in blocking garbage collection, which pauses the execution of your program.
- Also on the left (1), 33,855 ms is spent in Garbage Collection. This may be okay, but the middle diagram (2) tells us GC Wait is approximately 38%. In other words, our application is on pause for 12,966 ms, roughly 13 seconds, because the GC has work to do. This is definitely something we should try to improve. If this were a desktop application, it would become unresponsive for close to 13 seconds, making your users think it has frozen.
- In the top right-hand corner (Call Stack, (3)), the
VisitChildrenmethod has an own time of 19,096 ms. In other words, this one method spends 19 seconds running its own code, not including calls to other methods.
The next question is: Which of these red flags do we investigate first, and where do we start optimizing? In this case, any of them are good starting points. We decided to first focus on the last one, the VisitChildren method.
Anonymous lambdas on the hot path
The source code of the VisitChildren method seems fairly straightforward:
internal static void VisitChildren(this Element? element, Action<Element?> handler)
{
    foreach (var child in element.GetChildren().Where(x => x != null))
        VisitChildren(child, handler);

    handler(element);
}
Yet, in our snapshot, it spends almost 19 seconds on just this foreach (and that’s not including the call time of GetChildren()). There’s not a lot to optimize here, except for the .Where(x => x != null).
QuestPDF has a very readable code base, because its own fluent API and the use of various LINQ constructs make it very expressive. However, in this method, expressiveness and readability come with some overhead.
The test we’re investigating generates 100,000 rows with 10 columns, so let’s assume this method is called at least 1 million times, and the x => x != null delegate is, too.
Note: From reading the code, we know this method is called for every element in the generated PDF. But if we weren’t sure, we could get an accurate call count by using dotTrace, in particular, its Tracing profiling mode.
In .NET, there can be a performance cost when invoking delegates and anonymous functions. In this particular case, a new Func<Element, bool> will be instantiated at least one million times. That’s a lot of overhead! We can easily rewrite this method using a simple foreach and if, and get rid of that overhead:
internal static void VisitChildren(this Element? element, Action<Element?> handler)
{
   if (element != null)
   {
       foreach (var child in element.GetChildren())
       {
           if (child != null) VisitChildren(child, handler);
       }
   }

   handler(element);
}
As part of a profiling workflow, you should always validate that your changes have actually led to an improvement. Profile before the change, profile after the change, and see if the application performs better.
Here’s our follow-up dotTrace Timeline snapshot after making the code change above:
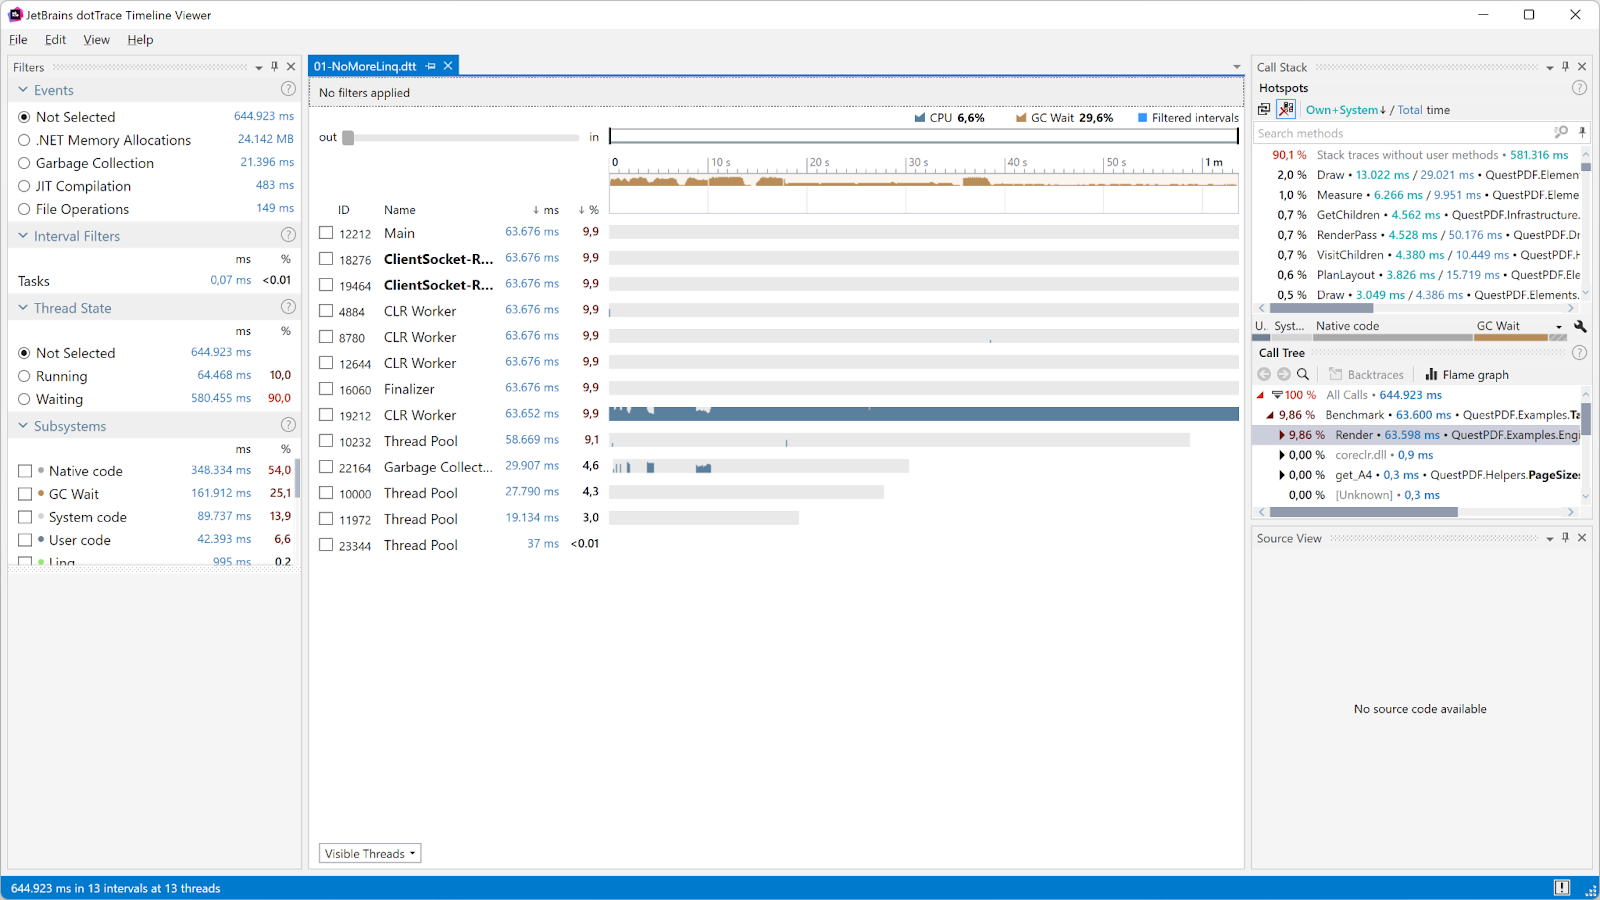
It look like our change did actually improve things quite a bit:
- Total execution time went from 844,267 ms down to 644,923 ms.
- Allocations went from 26,724 MB to 24,142 MB. It never hurts to get rid of almost 2 GB of allocations, which also needed to be garbage-collected before!
- Garbage collection time was cut from 33,855 ms to 21,396 ms, and blocking GC was reduced from ~38% to ~29%.
Less is always better, but don’t fear the GC. It’s OK to spend time on garbage collection, as long as it doesn’t block the execution of your own code (a low GC Wait time is good).
Great! A very small change has made the QuestPDF library much faster already. The benefits are not limited to better user experience, either. For example, if we used the library in an application that ran on a serverless platform where CPU time and memory usage are billed, this change would effectively reduce the cost to run that application.
Note: The takeaway of this section is not that we should never use LINQ and anonymous lambdas. In this particular case, it made sense to make this optimization because of the many calls to this method. Always measure, and see if the change makes sense using a profiler! Don’t optimize code prematurely, especially if a change offers low performance gains but would significantly reduce readability.
Creating a Queue vs re-using a Queue
In the previous profiling snapshot, the GC Wait visualization on the timeline is interesting. This is visualized with a brownish color on the chart.
The graph shows two periods with lots of blocking GC: a long period that starts at the beginning of the profiling session and then subsides, and then a second, shorter spike.
We assumed the first section could be ignored for the moment. The test is generating sample data for 1 million table cells, and that is bound to require allocations and garbage collections. We decided to focus on this second spike in blocking GC.

Note: Everything in the dotTrace Timeline viewer works like a filter. When you select an interval on the timeline, the call stack and hotspots will also be filtered to just that interval.
The ResetState() method takes 614 ms, all of it “own time”. Own time is the time spent in a method without measuring calls to other user code. A high own time means that the method itself takes a long time to execute, without taking calls to other non-system methods into account.
In this case, the ResetState() method lists only own time, which means it doesn’t call into other non-system methods. At the same time, the GC blocks execution for 60% of this time interval. That’s a lot!
The method itself is quite simple. It creates a new Queue and is then populated with the current list of items:
public void ResetState()
{
   RenderingQueue = new Queue<ITextBlockItem>(Items);
   CurrentElementIndex = 0;
}
It looks like the blocking GC may be caused by creating a new Queue here. Using the Navigate To action (Ctrl+`), you can inspect the source code of the Queue constructor. Alternatively, find it here on GitHub. Every time a new Queue is instantiated, a new array is allocated with a copy of all references in Items. All of these arrays have to be garbage-collected as well.
The Queue class has a Clear() method as well, which does not allocate a new array but instead clears the current one by setting all values to null. Let’s update the QuestPDF code to only create a new Queue when the current rendering queue is null, and use the Clear() method to reuse (and repopulate) it in the other case:
// Create a queue when we don't have one yet, otherwise clear the existing one so it re-uses the internal array under the hood.
if (RenderingQueue == null)
{
   RenderingQueue = new Queue<ITextBlockItem>(Items);
}
else
{
   RenderingQueue.Clear();

   foreach (var item in Items)
       RenderingQueue.Enqueue(item);
}
We captured a new profiler snapshot after making this change and noticed the GC spike we had earlier was gone!

Let’s look at the numbers:
- Total execution time went from 644,923 ms to 609,303 ms. In terms of execution time, we did not make a lot of improvements with this change, but it is slightly better,
- Allocations went from 24,142 MB to 23,936 MB. Also slightly better, but not spectacular.
- Garbage collection time went from 21,396 ms to 15,742 ms, and blocking GC from 29% to about 23.5%. This is a good improvement in terms of throughput!
Reducing the number of TextStyle objects
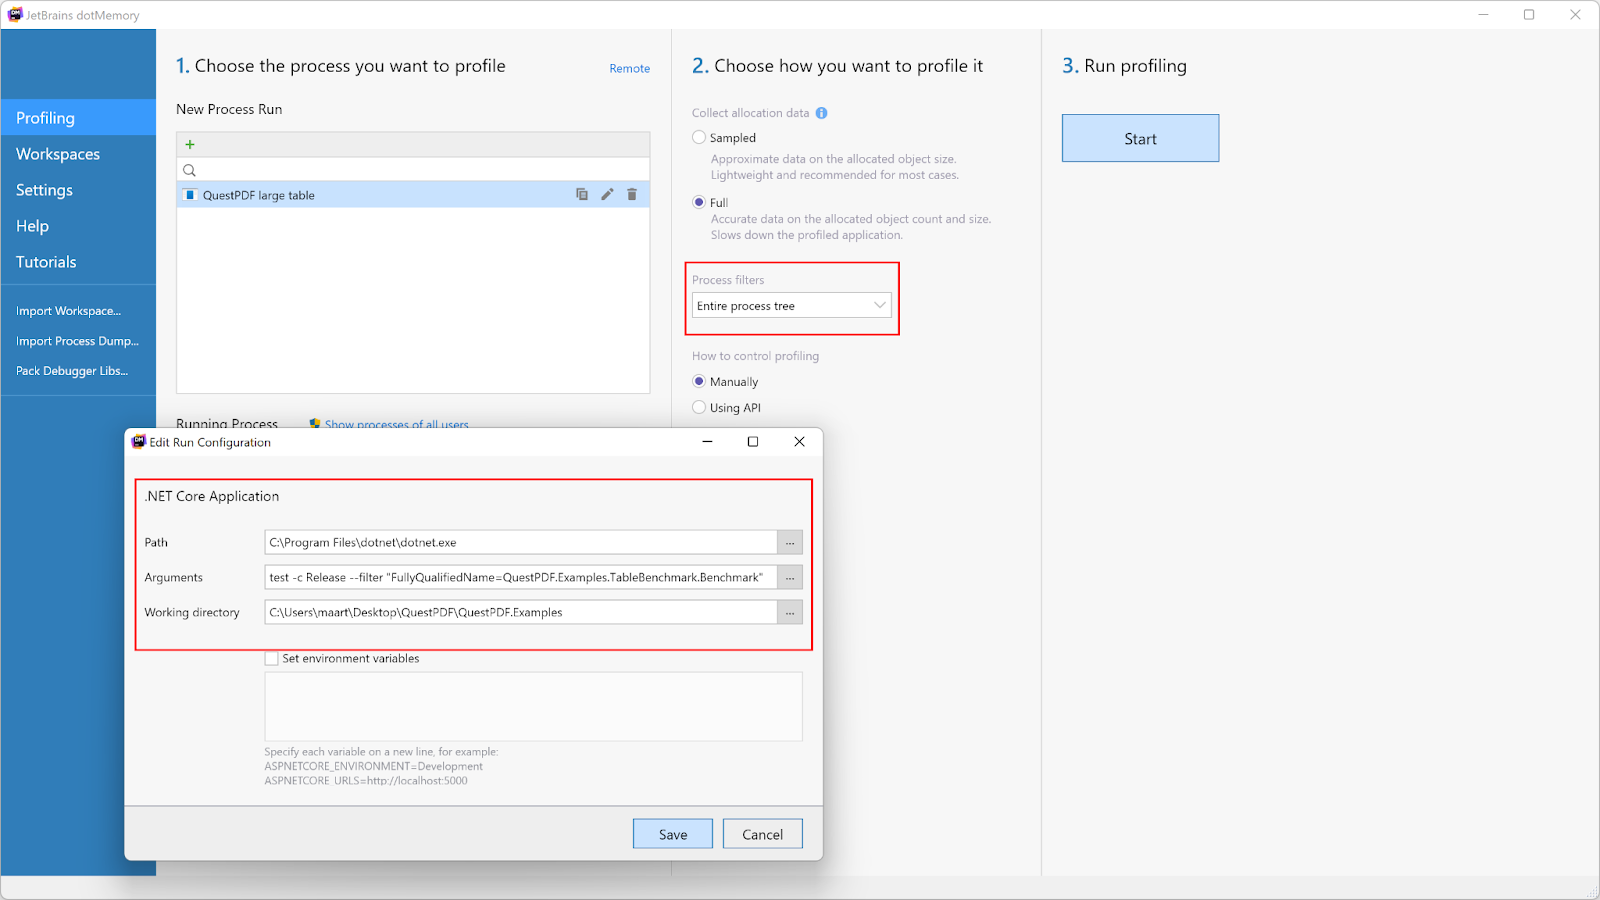
In our latest profiler snapshot, there’s still a lot of memory being allocated. This is not bad in itself, but the fact that 23.5% of GC is blocking (and thus, halting execution) is not ideal. Let’s fire up dotMemory and grab some memory snapshots!
Tip: If you want to capture the memory of unit tests, you can create a run configuration that starts dotnet test for a particular test. Also make sure to capture data for all processes, since dotnet and the test itself will run in separate processes.
During test execution, we captured several snapshots to get an idea of the various object types being allocated while the PDF is being generated.
In the snapshot overview, we can see the largest object is TextStyle:

Drilling into TextStyle, we were a little surprised. Remember our PDF has 100,000 rows and 10 cells, so 1 million cells in total. If each cell had one attached text style, we would expect 1 million TextStyle instances in memory. To our surprise, we saw 2 million!

This is where dotMemory’s retention graphs are invaluable. We found that each cell in the table had a specific, customized text style, which is expected. However, each cell also had its own instance of the default text style!

As it turned out, the static TextStyle.Default was creating a new TextStyle every time it was accessed, instead of making this a static, single-instance default value. Looking through the QuestPDF source code again, we found an easy way to make this a static reference without breaking functionality, so we did.
- public static TextStyle Default => new TextStyle();
+ public static readonly TextStyle Default = new TextStyle();
This one-line change resulted in 50% fewer TextStyle instances being allocated (and having to be garbage-collected).
Reducing the size of TextStyle objects
While exploring the TextStyle class further and looking at a specific instance in dotMemory, we found that the object size was probably bigger than it needed to be. Let’s look at the outgoing references of one instance:

For this instance, only the Color, BackgroundColor, and FontFamily properties are set. Their values are really references to String objects, of which you can see the Address here. What caught our attention was that the references were duplicated in this PaintKey property (and some also in the FontMetricsKey property).
Digging through the code, we found that these two properties are recalculated quite often:
PaintKey ??= (FontFamily, Size, FontWeight, FontPosition, IsItalic, Color);
FontMetricsKey ??= (FontFamily, Size, FontWeight, IsItalic);
Their values are only used in one of the final rendering stages. Whenever a TextStyle is updated, these two properties would be created from scratch, with the old ones ready to be garbage-collected.
Garbage collection is not bad. In fact, it’s what makes working with .NET enjoyable (most of the time) as it gives you virtually unlimited memory. The downside, though, is that the garbage collector needs to figure out whether an object can be removed from memory safely. The garbage collector does this by following all references to see whether the root object (TextStyle in our case) or any of the referenced objects are still in use elsewhere. The more references, the longer GC will take.
Every time one of the tuples stored in PaintKey and FontMetricsKey need to be garbage-collected, the garbage collector checks whether the referenced properties need to be garbage-collected, as well. That’s a lot of work to be done, and it could explain some garbage collector pauses.
Since PaintKey and FontMetricsKey are only used in the rendering stage, there’s no use keeping these properties around for every TextStyle and for the entire time it takes to generate a PDF. We made some changes so that instead of storing these properties, we’re now calculating them during the rendering process:
- The
TextStyleobject became smaller, because there are fewer properties stored. The object size went from 128 bytes to 116 bytes, on average. For 1 million objects, that’s a good reduction. - The garbage collector now has less work to do because there are fewer references to clean up.
Again, the proof is in the profiler. We launched dotTrace Timeline once more, and here’s what we got:

Let’s look at the numbers:
- Total execution time went from 609,303 ms to 549,401 ms. That’s a good improvement in our book!
- Allocations went from 23,936 MB to 21,542 MB. A good reduction in allocations, but we think there’s more work that can be done here.
- Garbage collection time went from 15,742 ms to 12,824 ms, and blocking GC from 23.5% to about 20%.
The 21,542 MB in allocations still consists of many TextStyle instances. Looking at the data, we see that many of these instances repeat the same information. 100 table cells with red italic text all have their own TextStyles with this information. Deduplicating these instances, for example by introducing a TextStyleManager that allows reusing styles when they are the same, would definitely reduce the memory pressure here. There may be other solutions as well.
If you’re interested in doing this exercise, the QuestPDF project would certainly welcome such changes!
More optimizations!
We then made a few additional small changes, such as replacing collection.Any() with collection.Count > 0 on the hot path. This reduces readability a little bit, but avoids allocating a new IEnumerator every time it’s called.
We also changed how the maximum column width is calculated, by keeping a running maximum value instead of looping over all cells multiple times.
All in all, we managed to bring all the numbers down some more by making these small incremental changes:

Let’s compare the numbers from our initial snapshot (before we started optimizing), with the end result:
- Total execution time went from 844,267 ms to 505,344 ms.
- Allocations went from 26,724 MB to 20,341 MB.
- Garbage collection time went from 33,855 ms to 10,916 ms, and blocking GC from 38% to about 19.5%.
Conclusion
In this post, we profiled and optimized the QuestPDF library. The scenario we looked at was an extreme case, and profiling it uncovered some bottlenecks. By optimizing this extreme case, we also managed to reduce execution time and blocking garbage collection for a more common report example that you’d find in many applications.
Profiling and optimizing QuestPDF has improved the performance and throughput of code in the library itself, and uncovered some other places where gains can be made. What’s more, any application that uses QuestPDF will benefit from these changes. Applications will generate PDFs faster and consume fewer resources.
More performance gains are definitely possible – not only in QuestPDF, but in your applications, too. Code evolves, and new hot paths may emerge. At the time QuestPDF was created, the VisitChildren method was rarely used. Adding more functionality resulted in this method becoming part of the hot path. It’s a good habit to profile often and see what else can be done in terms of improvements.
Give dotTrace and dotMemory a try on your code base! We have a tutorial on how you can get started from within JetBrains Rider, and a lot of extra resources on how to optimize performance in your apps.
PS: If you’re interested in contributing more performance improvements to QuestPDF, fork its GitHub repository, find (or create) a large test, and send back any improvements made! When you do, let us know in the comments below!