.NET Tools
Essential productivity kit for .NET and game developers
Case Study – Housekeeping and Codebase Improvements With dotTrace

You can develop fairly efficient applications straight away without a profiler, but if you work with third-party code via API, then bottlenecks will occur quite often. It is impossible to predict, but it is still possible to account for third-party code specifics without having the code itself. One story like this was shared by Jonas Meer in this interview.

Hi Jonas! Could you briefly introduce yourself and tell us about the work you are involved in?
I work at a small startup called aurivus. So I do many things there, but mainly I’m a software developer in .NET and sometimes in C++. I also do lots of things like CI pipelines and testing because we lack personnel – we have only five full-time employees and several students.
What projects do you typically work on?
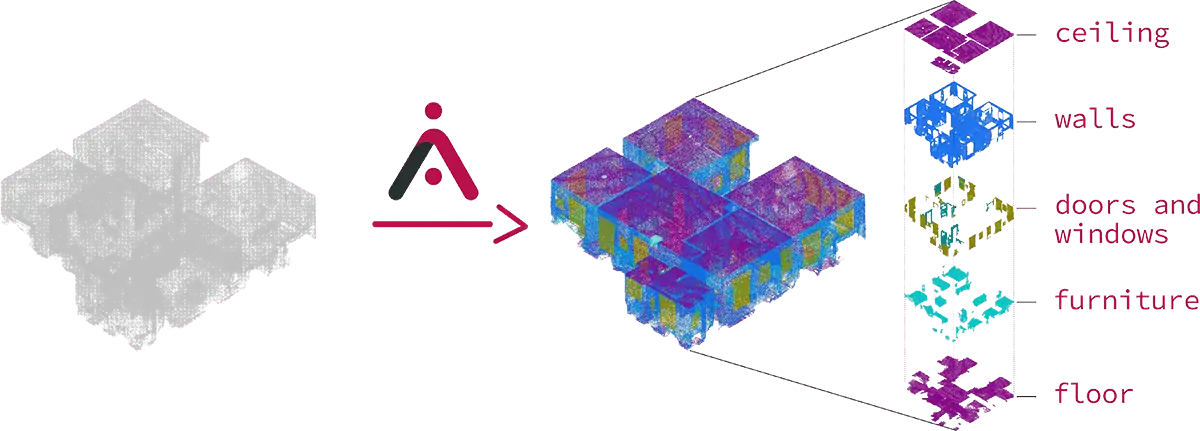
We strive to make 3D modeling of buildings easier. Today’s laser scanners create cloud points or plenty of separate 3D pictures, but then you most likely have to process them manually to get a 3D model out of it. Our startup develops artificial intelligence to help with such modeling and automate many routine tasks. Our AI already detects separate objects in a large point cloud and can make some classifications. It definitely helps with the modeling because you can just focus on what you need.
Could you tell us the most memorable story about how you faced a performance problem in your app? How did you find the problem and what steps were taken to troubleshoot it?
We needed to somehow present data to the customer. For this, we had to develop a plugin for Revit, a common building software by Autodesk. Normally, you only have one large single-point cloud. But we had thousands or hundreds of thousands of objects, so we had to implement some point cloud stuff on our own. I tested it with a small point cloud, and everything worked fine. But then I loaded a larger point cloud, and Revit became totally unusable, and the FPS dropped by five times.
To eliminate this problem, I decided to use dotTrace. I just used the default settings, and it pretty quickly pinpointed where the problems were. Basically, the process looked like this: I filtered the Timeline to the time range I was interested in, then I used the Call Tree and Scope to This to just focus on our own code, and then I used the Hot Spots feature to immediately see where most of the time was spent.
The main problems with the visualization were caused by how the Revit application works. It gives you a buffer to fill with points to display, and you should only copy the points which are visible in the viewport. It is also possible that Revit asks you multiple times in one frame to fill different buffers, but you have to remember between the calls which points you already copied. So, for our point cloud, we needed to have some sort of efficient filtering and level of detail system. The API gives you a filter object with a method TestPoint(Point pt) which you have to call in order to determine if the point should be added to the buffer (this depends on your settings in Revit and the camera position). With our first implementation, this method was called for every point, which worked surprisingly well for very small point clouds. But this was terribly slow for larger point clouds (>1 million points), and we have even larger point clouds (>40 million points). Thanks to dotTrace, it was obvious that this method was the root of the problem. This tool helped me see where I needed to take a look, and which parts are not that important right now.
To eliminate the problem, we experimented with a simple grid, but it did not give us satisfactory results – we either had to check too many individual points or too many cells. With a few experiments and dotTrace, we could see that the octree is what we needed, so that’s what we implemented.
Did the profiler help you identify other issues that you were not aware of?
Yeah, besides pointing to the main problem, dotTrace also showed us that our array of point arrays was not that efficient when iterating through it. This structure was needed because of the max size of around 4 GB for a .NET array. This was not that obvious, but it was revealed by the profiler. With the help of dotTrace, I could see which parts to focus on.
It also gave me a better understanding of how the external API from Revit works, its performance, what paper cuts I can make more often, and what I should avoid, all without any source code. So for example, when implementing the octree, we could use the TestCell(Point min, Point max) method of the filter object for a quick check if this node of the octree is visible or not. However, there was a sweet spot on how deep the octree should be and when it was faster to call the TestPoint method again. Finding this sweet spot was only possible with the profiler.
Why did you decide to adopt dotTrace? What are the key benefits you got from using it?
Actually, I have been using Rider for many years, and the profiler is really nicely integrated with this IDE. So I think that was the main reason why I use it. I also have some experience with the Visual Studio profiler, and it works nicely, but when I was profiling the plugin, there were a lot of noise, so it was unclear which of the profiling results were related to our code. It was much easier with dotTrace to filter out that stuff and just dive into our code, which is quite important. It’s also possible with Visual Studio, but I had to dig in more, while with dotTrace it was intuitive.
I definitely like that the Timeline view allowed me to find where and when our code was executed and scope to it. It also allowed me to profile multiple different scenarios in one session and easily find them. This way I could test things faster, because it is slow to always restart the entire Revit application.
Nice to hear our products are well integrated with each other! What was your experience getting started with dotTrace? How straightforward was the profiling process?
Oh, actually, there were no obstacles. Getting started was very easy, because you can start everything from Rider – boot up Revit, configure, and start profiling. So just one click and voila! The only thing I had to look into the documentation for was run configurations because I had to figure out how I could profile an external application without all the noise, which was just about choosing the proper configuration.
How did you handle issues before adopting profilers? What was missing, challenging, or problematic in your previous approach?
I didn’t know about profiling before. It was like “Huh, let me guess…well, the problem could be there, maybe, I’ll change it. Is it faster? No, I don’t really know, probably not”. So it was more trial and error, and it was not a satisfying experience to improve performance in this manner. We have unit testing, and you can immediately see and debug the place where the problem is, but with the performance, it was how it felt.
What are some non-obvious tips and tricks you would like to share with others?
I highly recommend the Scope to This feature.
Also, I noticed during plugin development that I really like the Timeline configuration and how it allows you to avoid all of the noise. Usually, you have to start the application, load some files, then try to profile several things at once, and it always takes a long time to get you there. With the Timeline it’s very easy to just go to the moments I’m interested in.
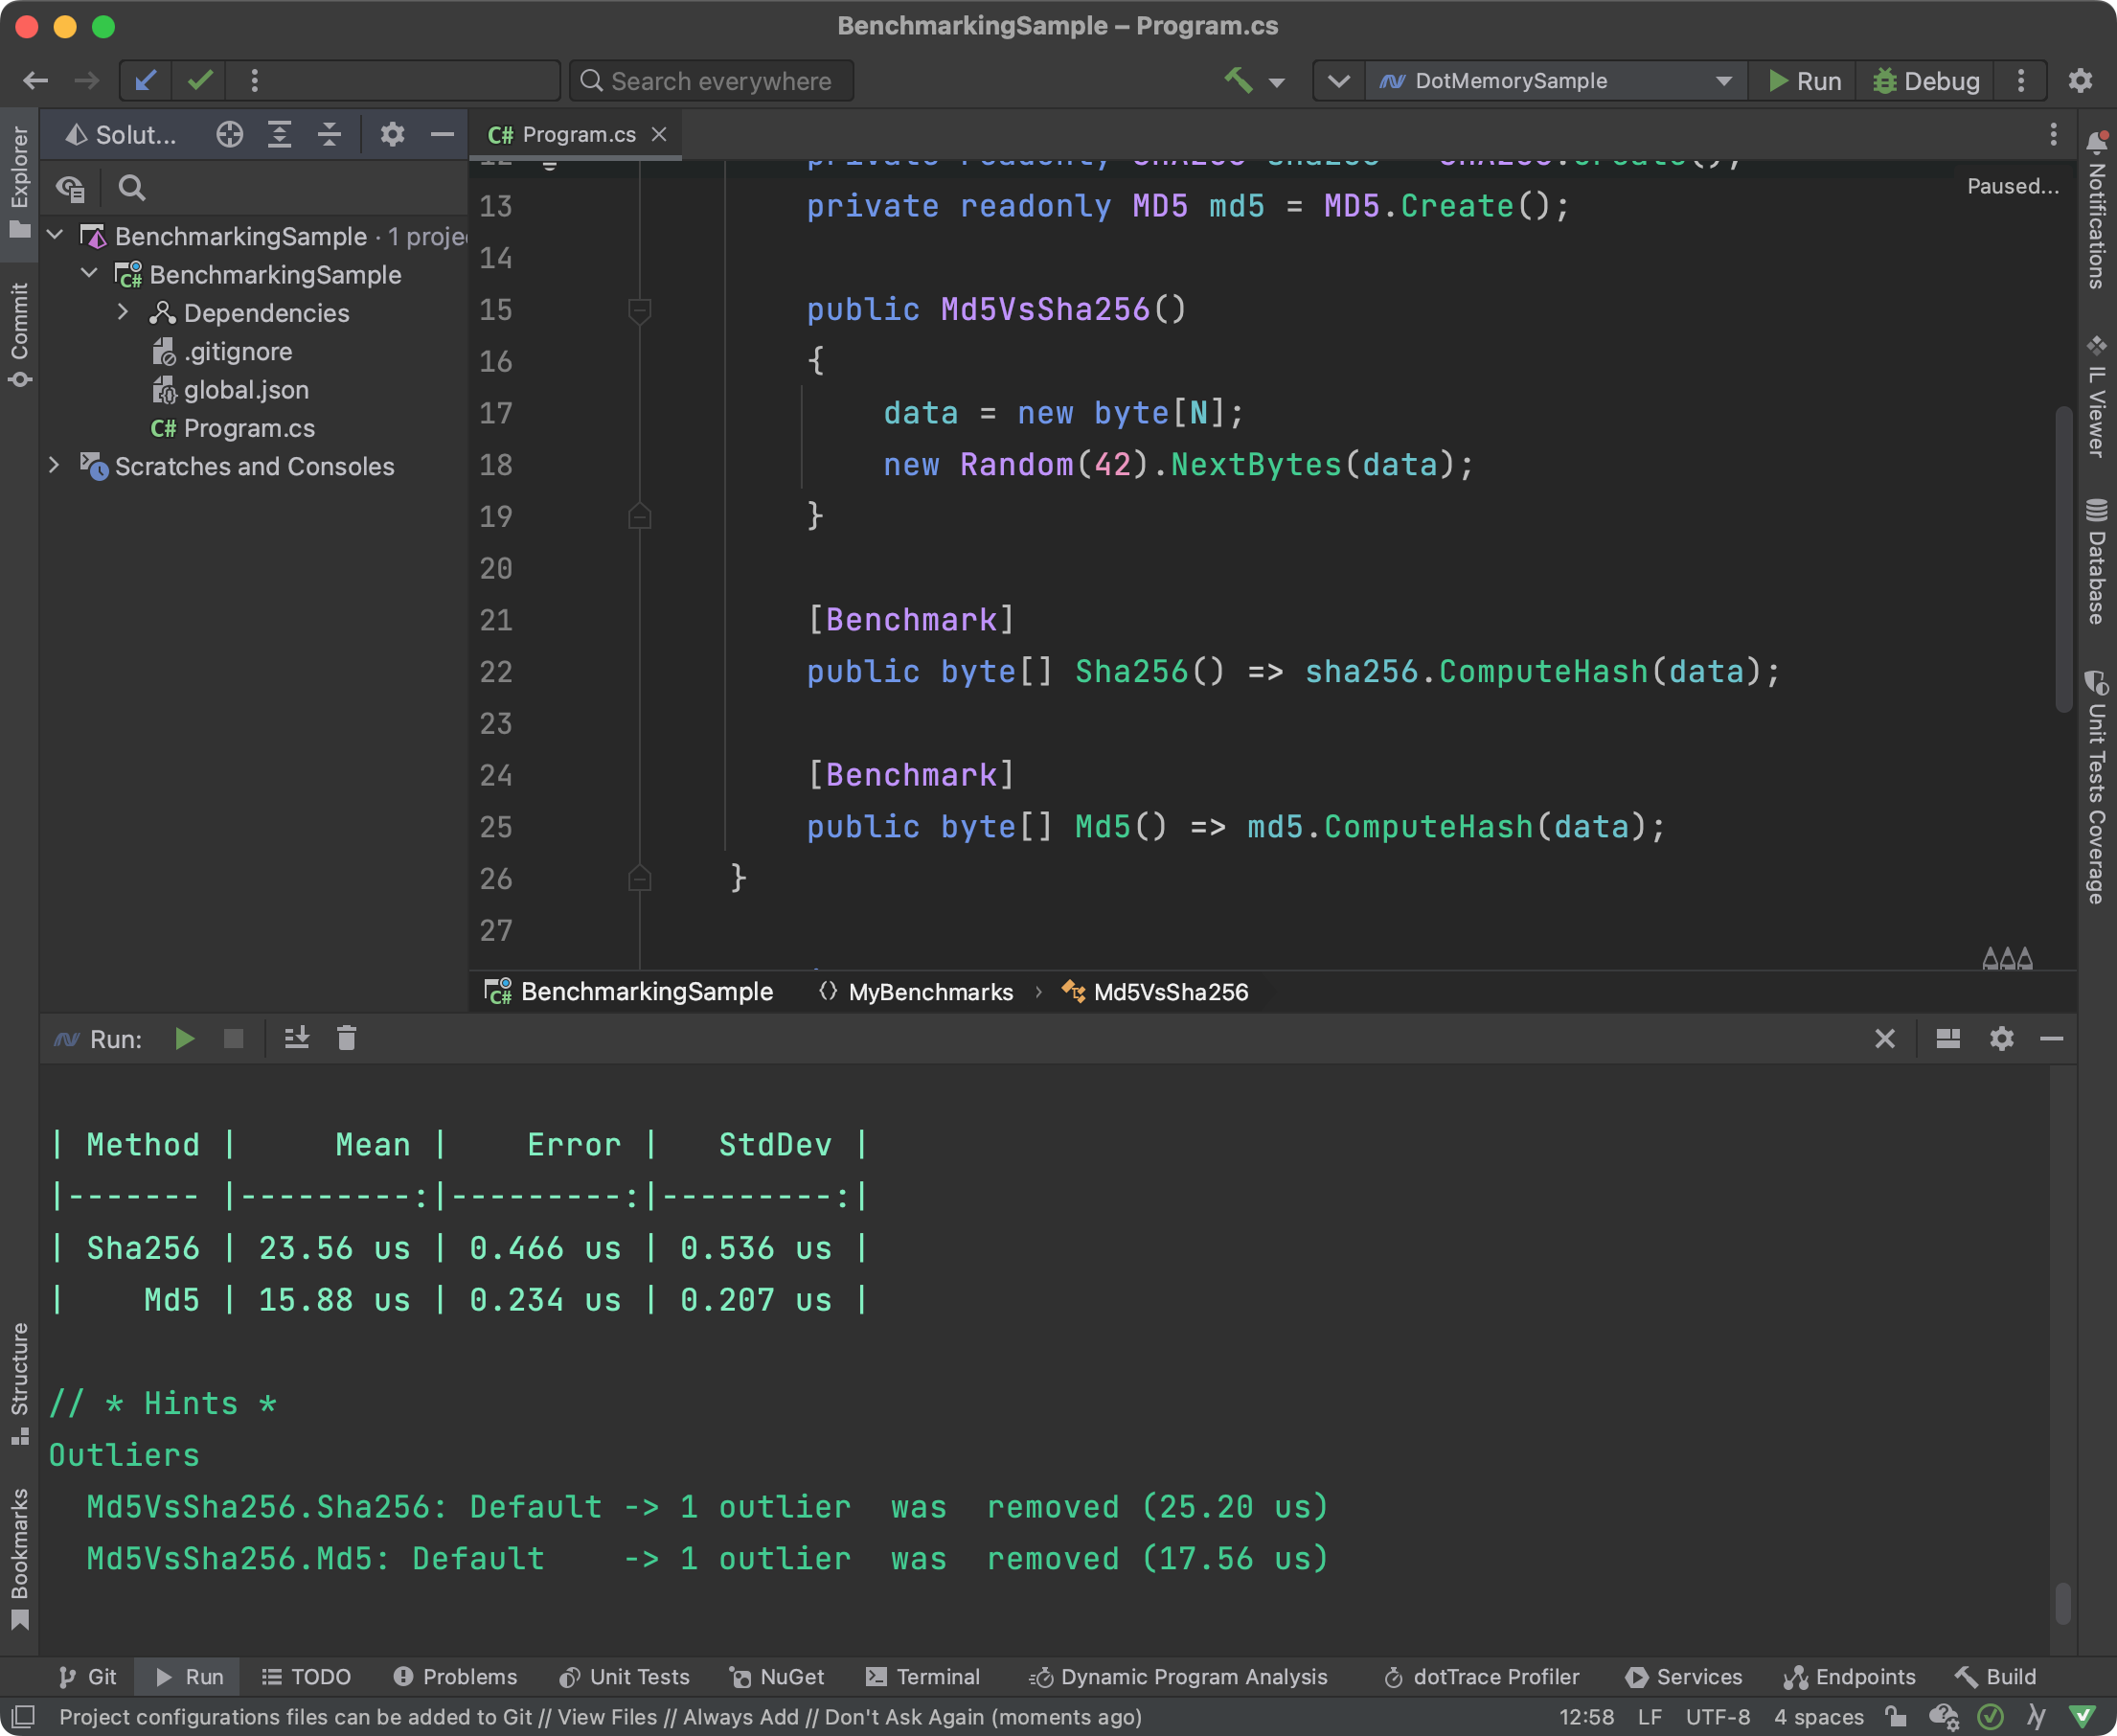
What I really like is keeping the feedback loop small. So when I profile something, I see “okay, there’s an issue”, but I don’t want to make the change and then give up the problem. When you have a long feedback loop, you’re tempted to make lots of changes, and then you don’t know which change was the right one. So instead of that, I isolate parts and run some benchmarks with BenchmarkDotNet, and in about 30 seconds understand whether performance has been improved significantly or not. You can just compare different solutions, and that’s pretty easy and awesome.
Why do you think profiling is not as popular as refactoring, even in situations when it’s definitely needed?
When it comes to my colleagues, they just haven’t had to use it before. They know about the profiles but maybe they think that it’s really hard to get started with profiling, even though it’s not that hard to see where the main problem lies. So, mainly, I think, it’s because it’s a little bit unknown and intimidating.
In what situations would you say it is necessary to use profiling tools to build high-quality software? How often should developers use it?
Well, I’m really happy that I have tools which can help me improve application performance, but I also like to write clean code. I think the code is usually less clean when you squeeze out the last bit of performance. So I prefer to optimize only where it is needed.
We’d like to thank Jonas for taking part in this Q&A session.
Do you also optimize applications with dotTrace? We invite you to share your experience with us. If you are interested, please let us know by leaving a comment below or contacting us directly.