.NET Tools
Essential productivity kit for .NET and game developers
Improved Startup Performance in Rider 2022.3

Have you tried the latest Rider 2022.3 (Early Access Program) yet? It may feel faster than previous versions, because… it is! As part of the Rider 2022.3 release, we have been working on a number of performance improvements to make solutions load faster, speed up syntax highlighting when opening editor tabs, and more.
Let’s have a look at some of the changes we made.
What happens during IDE startup and solution loading?
When you start Rider and open a solution, a lot of work has to be done in order to make sense of your code. There’s of course loading the IDE itself, with all of its built-in functionality such as Git tools, database tools, editors, and so on.
Rider then has to parse your solution and project file, run a design-time MSBuild, restore NuGet packages, enumerate all files in your solution, parse code and analyze the syntax, index symbols so code completion, navigation and refactoring becomes possible, and much, much more.
That’s a lot of work, but at the same time you probably want to start working on your code as soon as possible after starting your IDE.
In the Rider 2022.3 release, we have improved this “cold start” time quite significantly. Here are some statistics from loading some open source projects:

Orchard and Avalonia are both solutions with many projects, where our startup performance optimization really pays off. But even on solutions with fewer projects, such as Entity Framework Core, cold start should be noticeably faster.
Scanning and loading files and assemblies
On startup, Rider builds a virtual file system (VFS) representation of your solution. The VFS contains details about files, and also tracks changes made to files and folders. If you have ever used Local History to recover code you did not commit, the VFS is to thank for having stored your code in such cases.
VFS performance has been improved by better making use of multi-core machines. On startup, the VFS work is now fanned out across more CPU cores, making the scanning for new files and changed files faster.
As you may know, Rider consists of two main components: the front end, powered by IntelliJ Platform, and the backend, powered by ReSharper (R#). The R# process has to load its own assemblies from disk in order to power the Rider IDE experience.
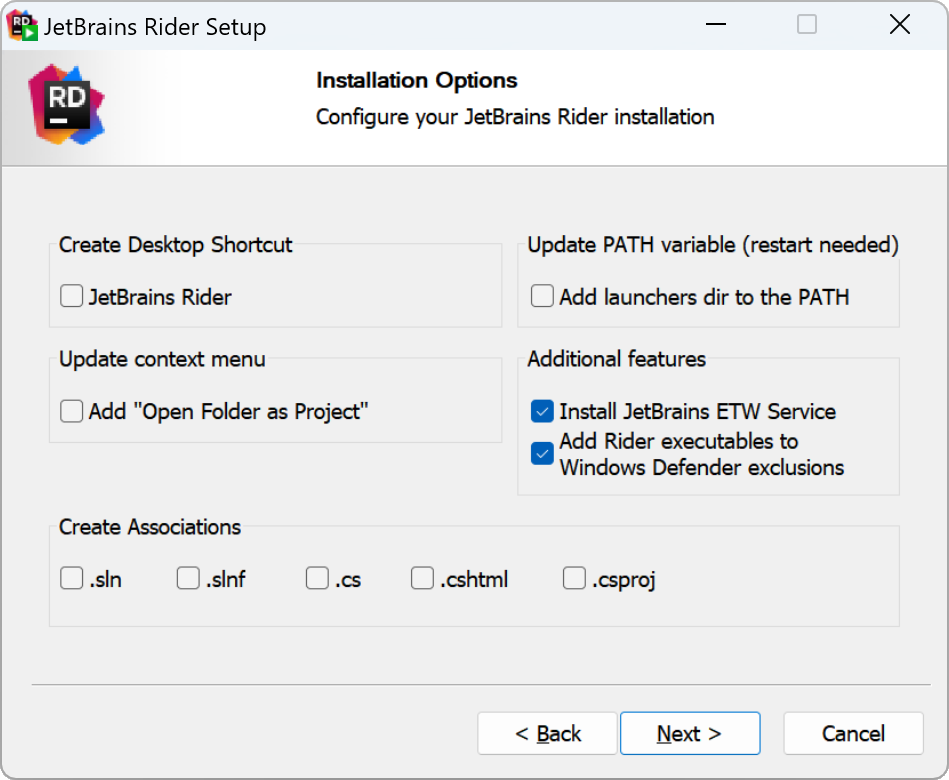
On Windows, the Windows Defender process slows down assembly loading quite a bit. We have added a new option in the installer (and JetBrains Toolbox App) to add Rider executables and assemblies to Windows Defender exclusions, making it faster to load them.
We also refactored part of the ReSharper component container. All functionality in ReSharper is shipped in separate assemblies, regardless of that functionality being provided by us or it being a third-party plugin. When the ReSharper backend is started, we load the .NET metadata tables for every assembly to determine which classes need to be instantiated for functionality to load. Instead of analyzing type and member information from their respective metadata tables, we now use the custom attributes table to get faster access to the types and members where our marker attributes are being used.
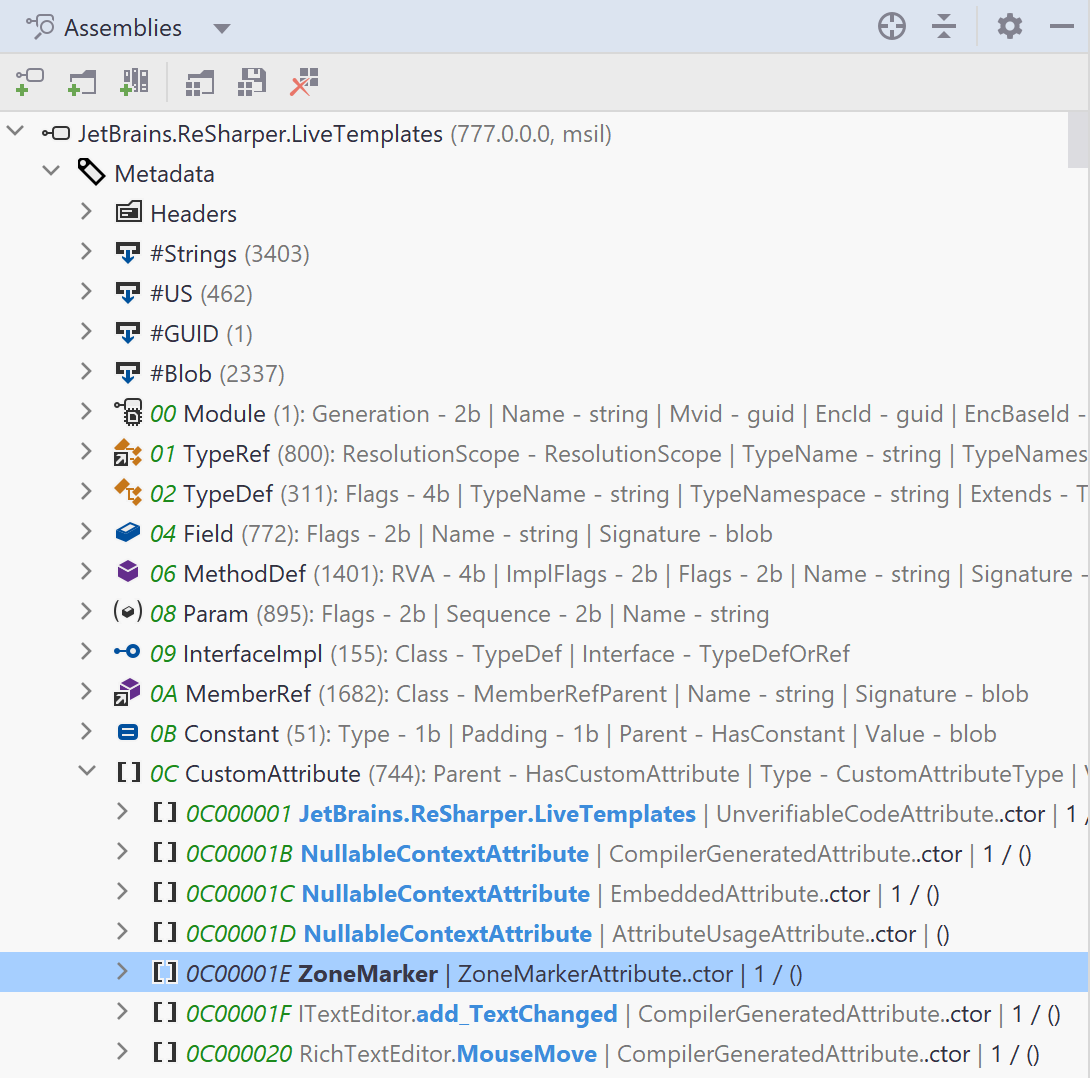
Note: if you want to look at the assembly metadata, including all types of headers, check out dotPeek, the assembly explorer in Rider, or CFF Explorer.
Garbage collection and memory traffic
Performance and memory usage/traffic often go hand-in-hand. The more objects are being allocated and the more references these objects have, the more work the .NET garbage collector has to clean it up, wasting CPU cycles on memory management.
Tip: we recently covered how we profiled and optimized the QuestPDF open source library, check out this blog post if you want to learn more about analyzing your application and improving performance and memory usage.
We’ve been profiling (and optimizing) memory traffic during Rider startup. In addition, since EAP 4, we’ve enabled server garbage collection (GC) to get better memory throughput for the ReSharper backend process.
Server GC is now also used when we run MSBuild in your solution. In addition, we now run design-time builds in parallel when projects have no interdependencies. Combining these changes, loading a solution with many projects is now noticeably faster.
Syntax highlighting
We recently released Fleet, our new IDE. It comes with a lightweight mode that brings editor functionality, and a smart mode that, at least for C# code, uses ReSharper as a background process as well.
For the lightweight mode in Fleet, we built a new C# parser that gives better syntax highlighting than we can achieve with e.g. TextMate bundles, and at the same time gives access to heuristic metadata to provide basic code completion.
We’ve now included this parser in Rider as well, so we can give you this basic syntax highlighting during startup, and the full experience when the IDE is started and your solution is loaded completely.
Summary
With Rider 2022.3, there should now be less time between starting the IDE and being able to work on your code. The IDE starts faster, and loading your solution and its projects should now also be quicker than ever.
Did you try out the latest Rider 2022.3 EAP version? Comments and feedback are welcome in the comments below!