.NET Tools
Essential productivity kit for .NET and game developers
Optimizing Entity Framework Core Database Queries With Dynamic Program Analysis

Whether you use Object-Relational Mappers (ORMs) like Entity Framework Core (EF Core) or Dapper to work with data and databases in your applications or you use the underlying ADO.NET and SqlConnection directly, it’s easy to run into situations where performance could be improved by changing how you access and query the database.
Profiling your application regularly can help find performance issues and bottlenecks. Even small optimizations can reduce database load and help make your application faster. “But who has time to profile regularly? We need to ship – now!”
What if you could get meaningful tips to optimize your application just by running it? This is where Dynamic Program Analysis (DPA) in ReSharper and JetBrains Rider comes in.
In this post, let’s have a look at what Dynamic Program Analysis is and how it can help you find and optimize common issues in database access code.
What is Dynamic Program Analysis again?
Dynamic Program Analysis, or DPA for short, automatically monitors your application for common memory allocation and database issues. It is available in both ReSharper and Rider.
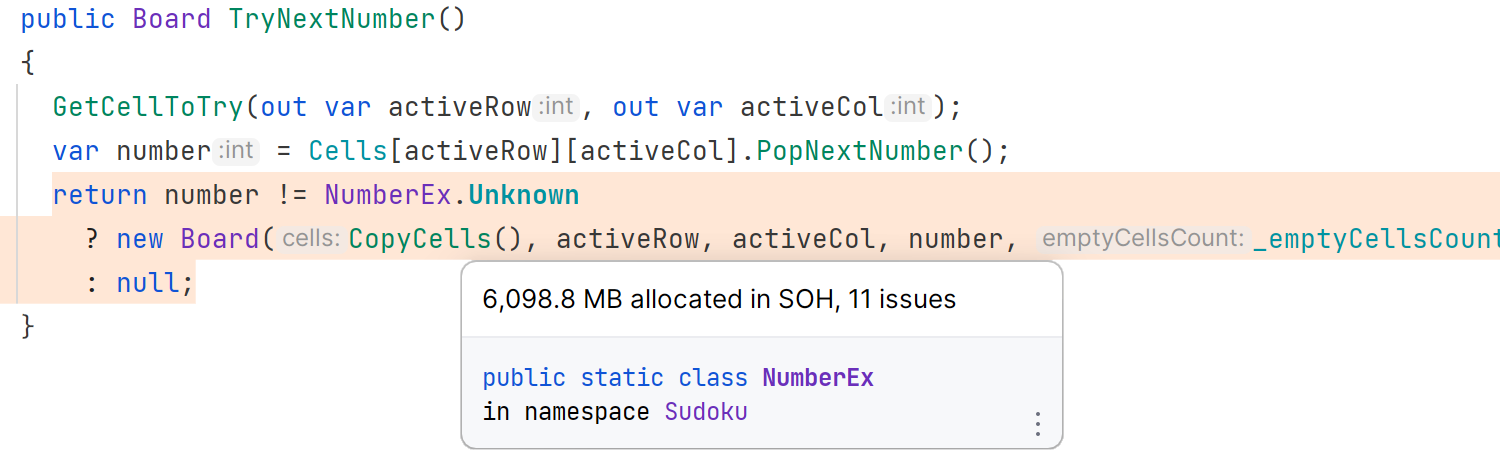
When a method call allocates more memory than the specified threshold, DPA will mark it as a potential issue in the editor:
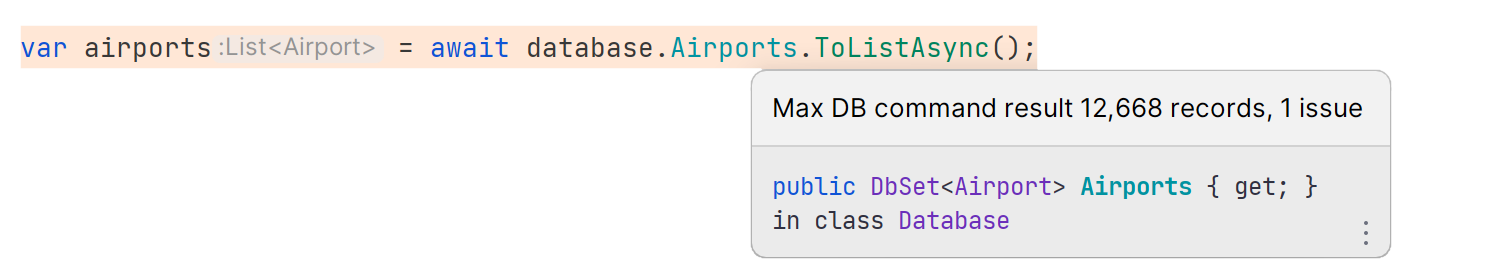
Similarly, when a command retrieves too many results from the database, you’ll see a warning to that effect in the editor:
DPA checks for various memory allocation issues, such as closures and allocations to the large object heap (LOH) and the small object heap (SOH). In addition, it monitors how you’re querying your database and helps discover long queries, queries that return too many results, and other potential issues.
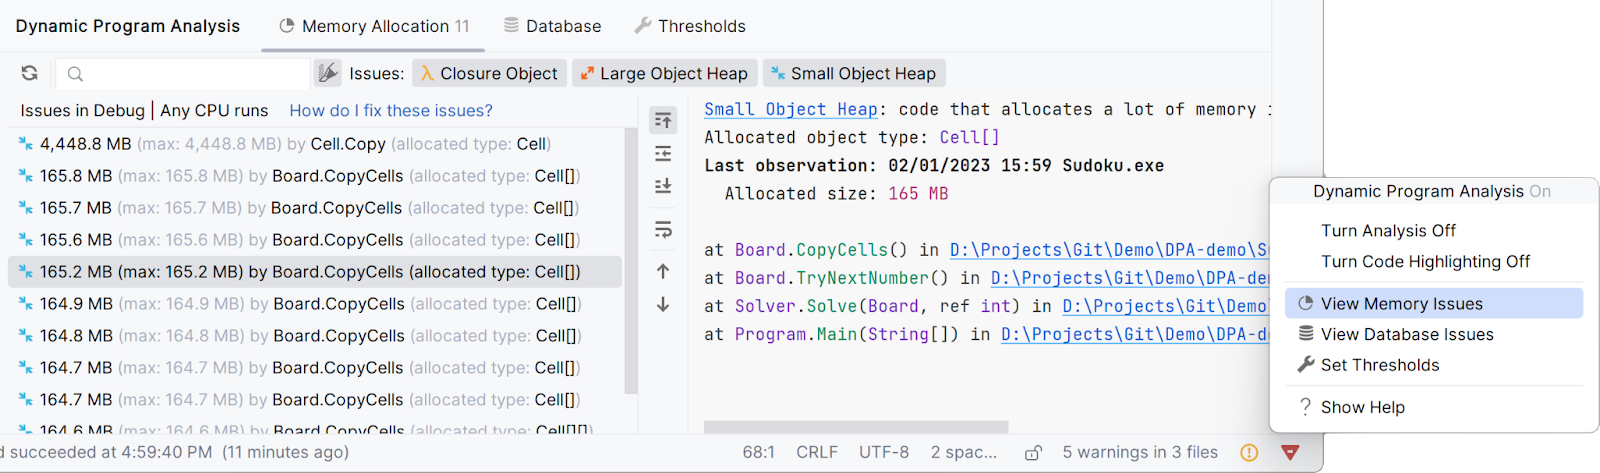
In ReSharper and Rider, code is highlighted when an issue is discovered. In addition, the DPA icon in the status bar will be either green (no issues detected) or red (potential issues that need your attention). You can navigate to the list of issues and, from there, view the stack trace, jump to the corresponding code in the editor, and investigate the issues further.
Tip: To learn more about memory profiling, check out our tutorial about how to profile application code in Rider (including using DPA).
In a previous post, we discussed using Dynamic Program Analysis to detect memory issues. In the remainder of this post, let’s look at how DPA can help detect some common database issues and how to fix them. We’ll use Entity Framework Core (EF Core), but keep in mind DPA works with Dapper, ADO.NET, and more.
Queries returning too many records
One common issue with database access is fetching too much data. A very straightforward example would be the following code, which requests an airport from the Airports table using the airport IATA code:
var airports = await database.Airports.ToListAsync();
var brusselsAirport = airports.First(it => it.NormalizedIata == "BRU");

Console.WriteLine($"{brusselsAirport.Country} ({brusselsAirport.Timezone})");
When you run the application, DPA will highlight the first line of code in this snippet in the editor. Looking at the Dynamic Program Analysis tool window, you’ll find more details about this (potential) issue:
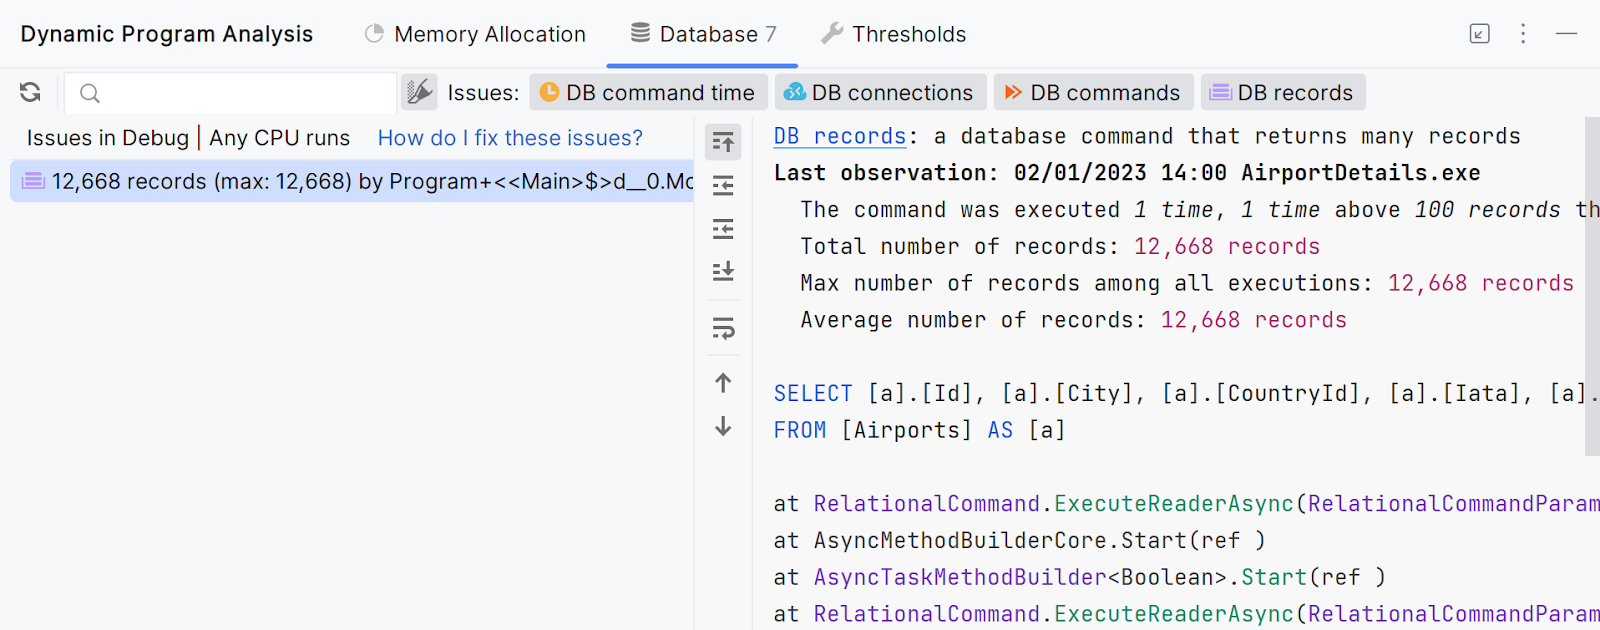
This particular query returns over 12,000 records! Looking at the SQL statement, you can see we forgot the WHERE clause, which could have limited the number of records returned. We can solve this in code by allowing the database to filter the records before returning the result to the application:
var brusselsAirport = await database.Airports.First(it => it.NormalizedIata == "BRU");

Console.WriteLine($"{brusselsAirport.Country} ({brusselsAirport.Timezone})");
The example in this section may look contrived, but you’d be surprised at how common the mistake of filtering an unnecessary amount of data in memory can be! Being aware of the data you retrieve – as opposed to the data you use – can help mitigate performance issues later. Thanks to Dynamic Program Analysis, you can catch these issues early and often.
Beware of N+1 performance
‘N+1’ problems are common when lazy loading is enabled. With many developers migrating from EF 6 to EF Core, some have had to keep the feature enabled as they take small steps to pay down technical debt. While it’s not recommended to enable this feature, you can add lazy loading using the “Microsoft.EntityFrameworkCore.LazyLoading” package on NuGet. Let’s look at an example of when ‘N+1’ problems can degrade performance.
Our database contains Airports and Countries, and each Airport has a related Country through a foreign key. Here’s how you could write the number of airports per country to the console:
var countries = await database.Countries
   .OrderBy(country => country.IsoCode)
   .ToListAsync();

var countriesAndAirports = countries
   .Select(country => new
   {
       Country = country,
       Airports = database.Airports
           .Where(airport => airport.Country == country)
           .ToList()
   })
   .ToList();

foreach (var countryAndAirports in countriesAndAirports)
{
   Console.WriteLine(
       $"{countryAndAirports.Country.Name} has {countryAndAirports.Airports.Count} known airports.");
}
In the editor, this particular example will light up like a Christmas tree!
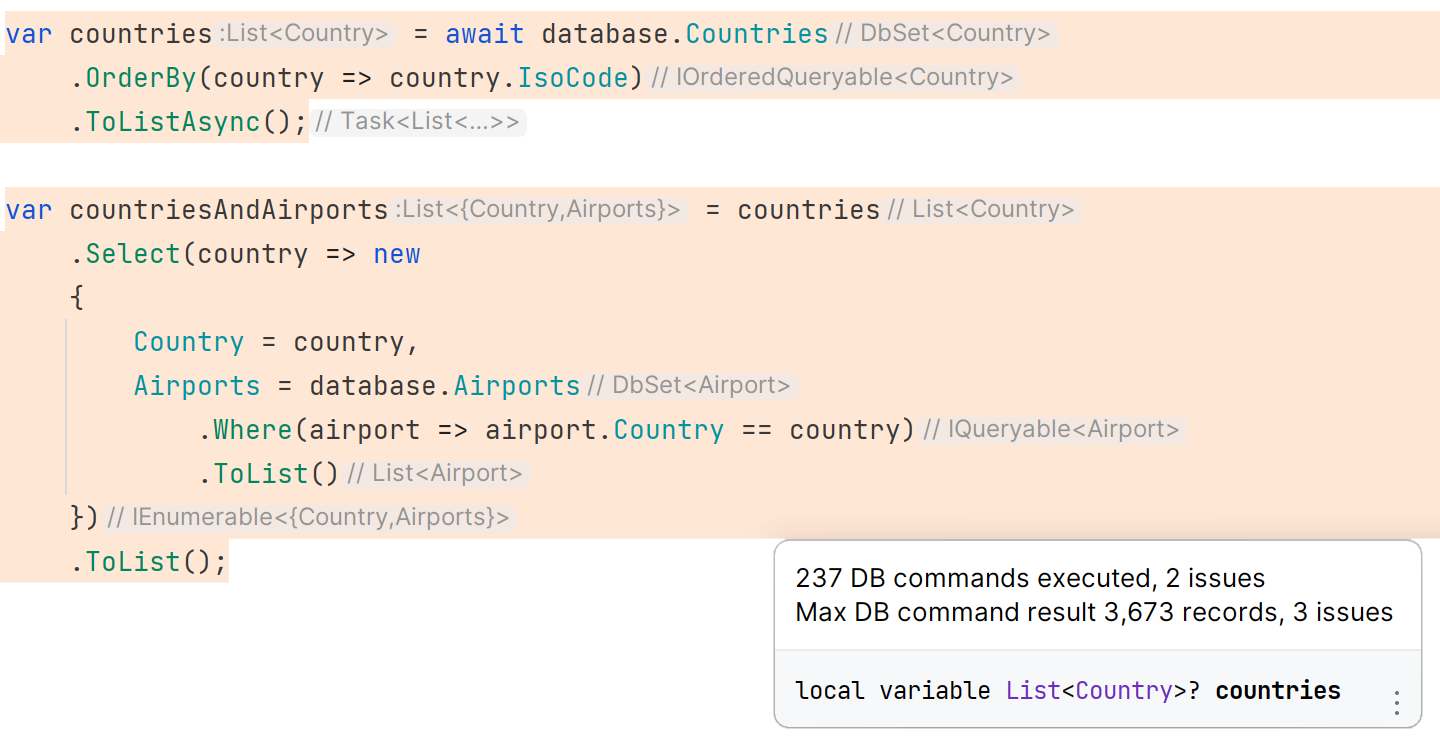
Two lines of C# result in 237 database commands, and one of those commands returns 3,673 records. While it may look like a single query, it’s definitely not! As we loop through the countries, we are making an additional query for airports in that particular country. In other words, for every Country entity (N), we are making a separate call to the database for the list of Airport entities (+1).
In this case, Country has a navigation property Airports. Entity Framework Core can load this related data as part of the query, using the .Include() method:
var countriesAndAirports = await database.Countries
    .Include(country => country.Airports)
    .OrderBy(country => country.IsoCode)
    .ToListAsync();
If you don’t need all properties of Country and every Airport, you can also use a projection. If all you need in this application is the country name and the number of airports in that country, this snippet could be rewritten as follows:
var countriesAndAirports = await database.Countries
    .Select(country => new
    {
        Country = country.Name,
        NumberOfAirports = country.Airports.Count
    })
    .ToListAsync();
Using this projection, the database will handle the aggregation (count) of airports in every country for us and only return the data that the application really needs.
Cartesian explosion and AsSplitQuery
After optimizing a query, always run the application again and see if the optimized query is gone from the list of potential issues. You just might find that a particular optimization results in another database performance issue.
Let’s try and write the number of airports per country to the console. We already learned that N+1 queries are not ideal, so let’s include the Airports navigation property:
var countriesAndAirports = await database.Countries
    .Include(country => country.Airports)
    .OrderBy(country => country.IsoCode)
    .ToListAsync();

foreach (var countryAndAirports in countriesAndAirports)
{
    Console.WriteLine(
        $"{countryAndAirports.Name} has {countryAndAirports.Airports.Count} known airports.");
}
This example will also be flagged by DPA. Once again, it looks like we’re retrieving too many records from the database!
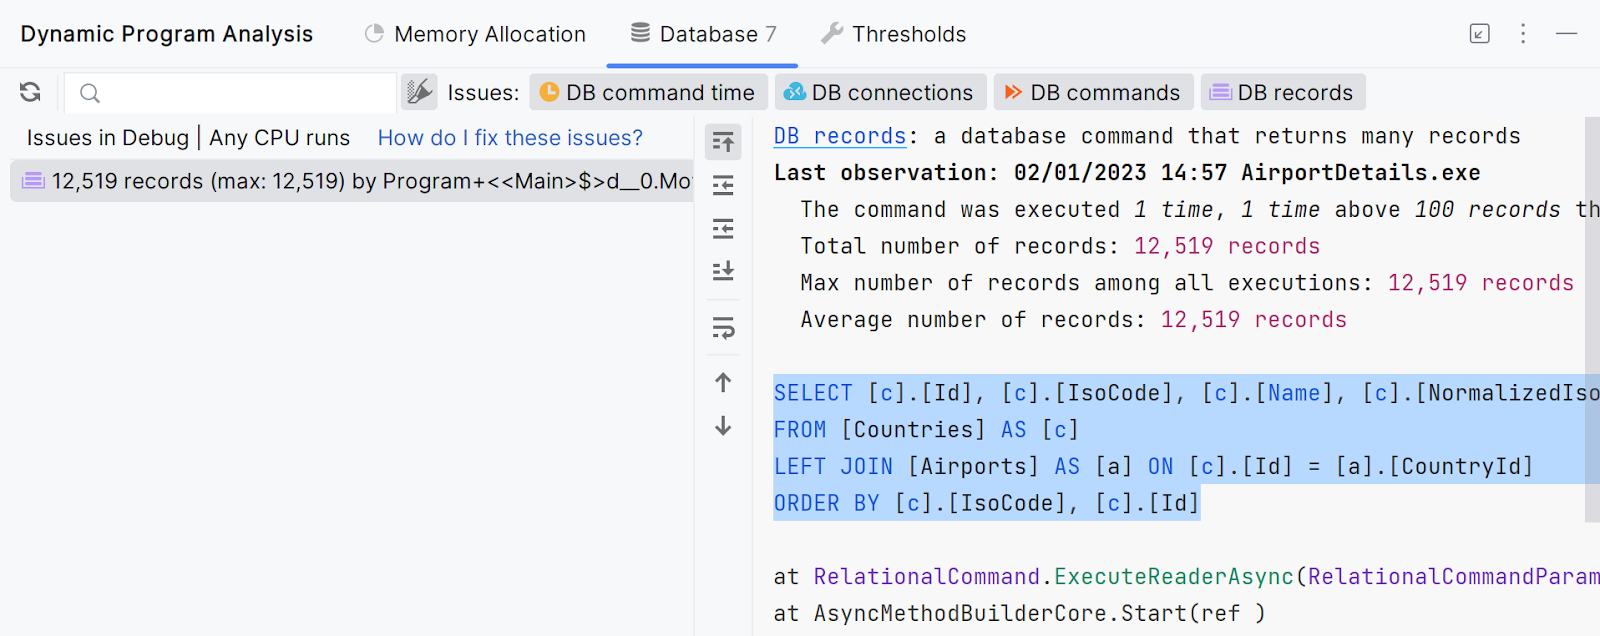
The reason for this excessive amount of records being retrieved is because of cartesian explosion. Entity Framework Core translated the LINQ query to a SQL LEFT JOIN, as highlighted in the screenshot above. If you run the resulting SQL query against the database, you’ll see the data for every country is repeated over and over again, together with the airport data.
...
20,BE,Belgium,BE,BELGIUM,297,Antwerp,20,ANR,51.18940,4.46028,Antwerp International Airport (Deurne),ANTWERP,ANR,ANTWERP INTERNATIONAL AIRPORT (DEURNE),Europe/Brussels
20,BE,Belgium,BE,BELGIUM,298,Beauvechain,20,\N,50.75860,4.76833,Beauvechain Air Base,BEAUVECHAIN,\N,BEAUVECHAIN AIR BASE,Europe/Brussels
20,BE,Belgium,BE,BELGIUM,299,Kleine Brogel,20,\N,51.16830,5.47000,Kleine Brogel Air Base,KLEINE BROGEL,\N,KLEINE BROGEL AIR BASE,Europe/Brussels
20,BE,Belgium,BE,BELGIUM,300,Brussels,20,BRU,50.90140,4.48444,Brussels Airport,BRUSSELS,BRU,BRUSSELS AIRPORT,Europe/Brussels
...
This is quite wasteful: A lot of data is going over the wire, and Entity Framework Core has to enumerate these rows and map them into objects.
A better way of writing this particular query is using the .AsSplitQuery() method. Doing so will instruct Entity Framework Core to split the query into multiple partial queries, each of which retrieves a particular entity from the database.
var countriesAndAirports = await database.Countries
    .Include(country => country.Airports)
    .OrderBy(country => country.IsoCode)
    .AsSplitQuery();
    .ToListAsync();
By running this LINQ query in split-query mode, Entity Framework will retrieve all countries once, and all airports once, and then link them together in application memory.
While this too sounds wasteful, remember that the previous query required Entity Framework Core to process a lot of duplicate data from a set of 12,519 records. If you really want to know which one is better for your situation, this is a perfect opportunity to use a full-blown profiler like dotTrace.
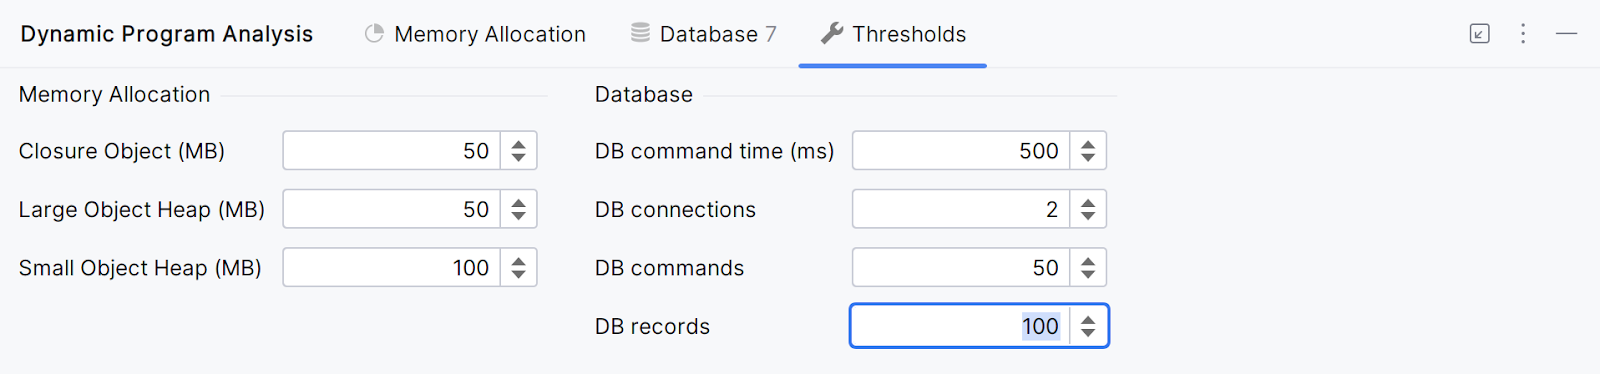
Note: The default threshold for the “DB records” inspection is 100. There are just over 250 countries in the world, so the threshold may need to be slightly changed even when using .AsSplitQuery(). You can do this in the Thresholds tab of the Dynamic Program Analysis tool window:
If you want to suppress a specific warning or set a different threshold for a specific method, you can do so with the SuppressMessage attribute on the method that makes a specific query. The MessageId property of this attribute can be used to change the threshold:
[SuppressMessage("ReSharper.DPA", "DPA0007: Large number of DB records",
    MessageId = "count: 250")]
Detecting slow queries
Slow queries in Entity Framework Core can be caused by a number of factors, including the complexity of the query itself, the amount of data being returned, and the performance of the database server.
No matter the reason, DPA will let you know when a query exceeds a specific threshold (defaults to 500 ms):
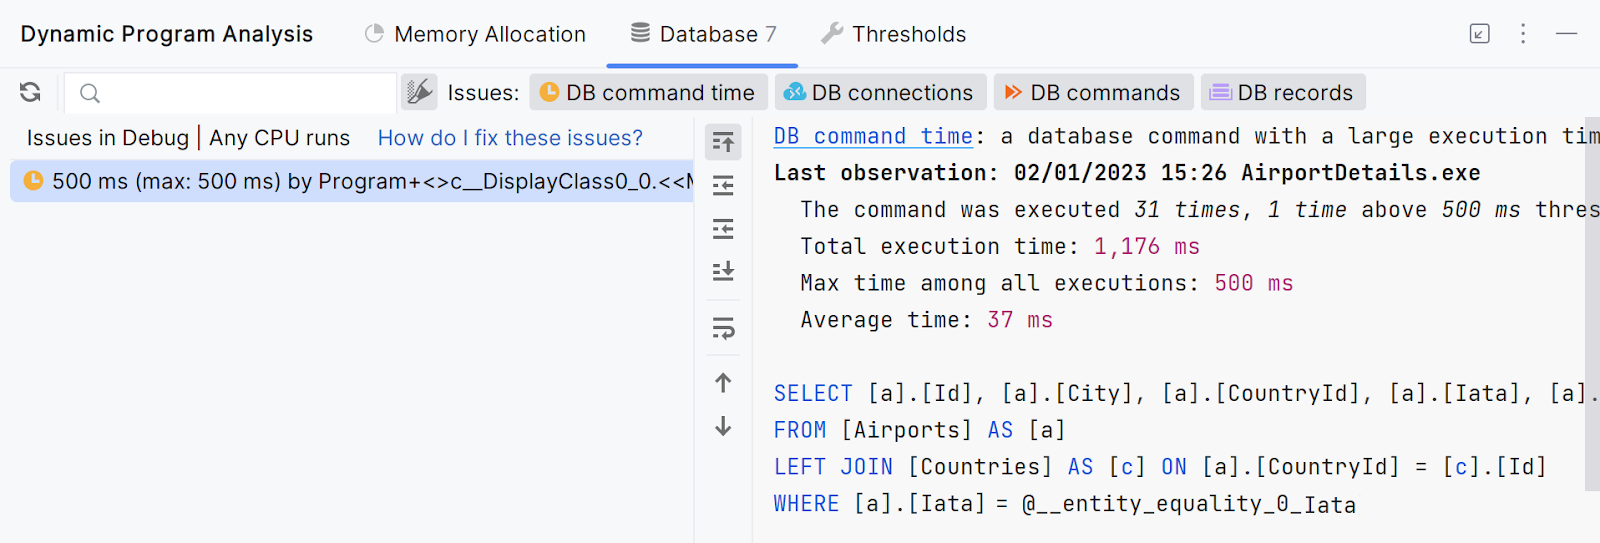
Even though Dynamic Program Analysis is not a database profiler, it can help highlight issues like these and indicate that further investigation might be needed. You may want to start by inspecting the query execution plan of this particular query, or even look into using a full-blown database profiler.
In this case, an index on the Iata column would help speed up the query. You can add one in the database context’s OnModelCreating method:
public class Database : DbContext
{
   // ...

   protected override void OnModelCreating(ModelBuilder builder)
   {
       // Airport indices
       builder.Entity<Airport>().HasIndex(nameof(Airport.Iata));
   }
}
You can then create and apply a new database migration to add the index to your database.
Too many connections
In general, it’s OK to open multiple database connections in Entity Framework Core. The framework is designed to manage connections to the database for you, so you don’t have to worry about manually opening and closing connections.
When using multiple database connections with Entity Framework Core, make sure to consider:
- Performance – Opening and maintaining multiple database connections takes time and can negatively impact the performance of your application, especially if you have a high volume of database transactions.
- Resource consumption – Each database connection consumes system resources, such as memory and CPU time. If you open too many connections, you may run out of resources on your application or database server.
By default, Dynamic Program Analysis will flag code that opens more than 10 database connections so you can investigate.
Summary
Dynamic Program Analysis (DPA) is an automatic, always-on profiling tool in both ReSharper and JetBrains Rider. It provides inspections for common memory issues and various problems related to database usage: long command execution times, too many simultaneously executed database commands, commands returning too many records, and too many database connections.
We’ve seen how these inspections can help you find common issues with Entity Framework Core, such as N+1 query performance problems, slow queries, cartesian explosion, and more.
Tip: Check our blog post about common EF Core pitfalls to learn more about the potential issues you may run into when using Entity Framework Core.
One final note: While we used Entity Framework Core throughout this blog post, the database inspections in DPA are available for both EF Core and applications that use SqlConnection. If you’re using ADO.NET or Dapper for data access, DPA will be able to highlight your code, too.
Give Dynamic Program Analysis a try! Do we need more automatic profiling in ReSharper and JetBrains Rider? What kind of issues would you like us to help you discover? Let us know in the comments!