.NET Tools
Essential productivity kit for .NET and game developers
Automatically Analyze ASP.NET Core Performance With Dynamic Program Analysis

Slow web pages may make your users or customers abandon your web application, even before they’ve had a proper look at it. You’ve likely also been frustrated working with a web application that is slow to load.
The good news is that the latest versions of ReSharper and JetBrains Rider’s Dynamic Program Analysis come with new inspections to help you find performance issues with your ASP.NET Core MVC, Razor Pages, and Razor ViewComponents – all without having to dive into a full-blown profiler!
Let’s take a look at those new performance inspections for applications targeting the ASP.NET Core framework.
What is Dynamic Program Analysis (DPA)?
Before we dive into what’s new, let’s quickly recap what Dynamic Program Analysis (or DPA) is all about. DPA is a process that runs in the background of ReSharper and JetBrains Rider, and checks your application for various issues whenever you run it on your machine.
DPA will check for issues with memory allocation and database usage. It provides hints about allocations to large and small object heaps, but also informs you when a database query returns more rows than you expected, helping you trap N+1 queries and Cartesian explosions, among other potential performance issues.
DPA for ASP.NET Core applications
The ReSharper 2023.3 and JetBrains Rider 2023.3 releases now come with new inspections to make you aware of potential issues in your ASP.NET Core applications.
When you see a red icon in your status bar, DPA has found a potential performance issue. Alternatively, you will see a warning in the editor gutter and highlighting in your code:
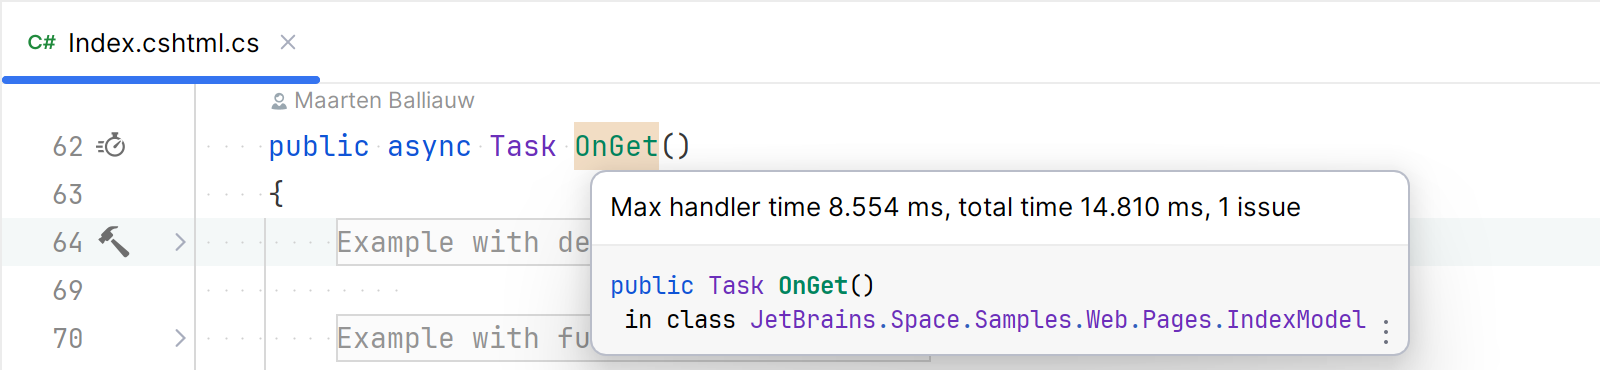
You can double-click the icon in the status bar (or press Alt+Enter and then View ASP issues) to open a new tool window and see the inspections that were triggered. The different tabs will show potential issues with Memory Allocation, Database, or in this case, ASP.NET.
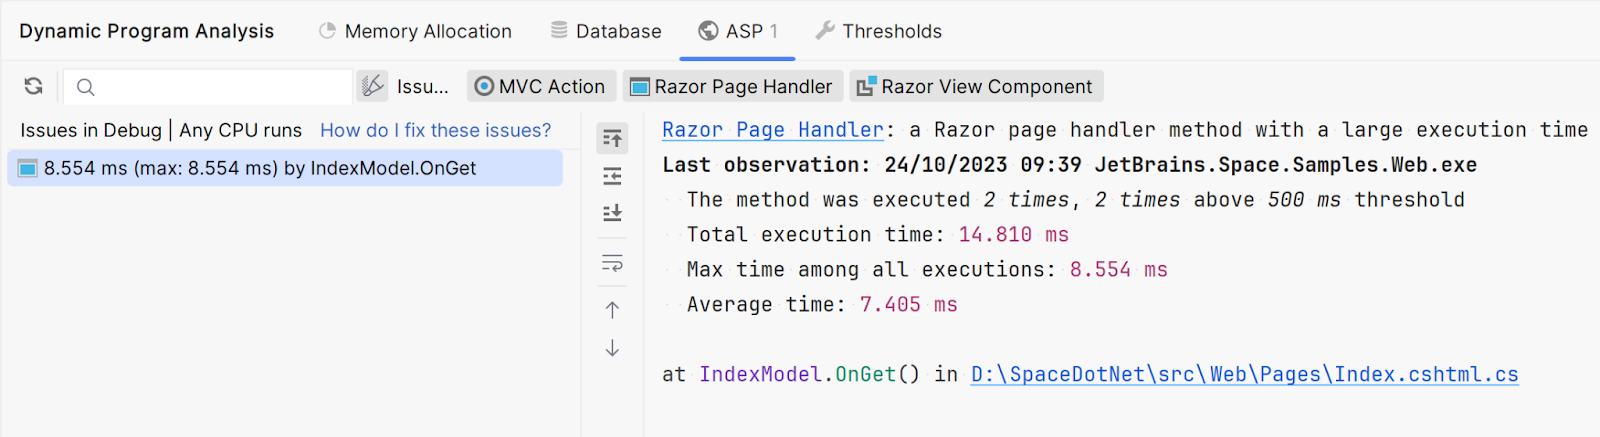
For the IndexModel.OnGet() Razor Page in the above application, DPA detected that the average execution time is over 7 seconds. Yikes!
Much like the other inspections available in DPA, the inspections for ASP.NET Core applications will require you to look more closely at your source code (or use a full-scale profiler such as dotTrace or dotMemory). However, without having to do anything specific, DPA does make you aware of potential performance issues before your application goes to production.
The new inspections in Dynamic Program Analysis that target ASP.NET Core frameworks are available in the Early Access Program for ReSharper and JetBrains Rider. Give them a try, and see if you can find any issues in your MVC actions, Razor Pages, or ViewComponents. As always, we welcome your feedback in the comments.