.NET Tools
Essential productivity kit for .NET and game developers
Another Look into the Future with Rider’s Predictive Debugger

In the 2023.2 release cycle, we’ve introduced the Predictive Debugger in ReSharper, which gives you predictions about code paths and variables beyond the current execution pointer. We’ve written extensively about its advantages compared to alternative debugging strategies like thorough thinking, log statements, and unit tests. The bottom line is that the debugger is just another companion on our developer adventure that gives us a reliable “view into a system that’s too complicated to understand” while our “head is a faulty interpreter of all that code” that we have to deal with (John Carmack in an interview with Lex Fridman).
We’ve already hinted that Rider would catch up with ReSharper, and just one major release later, we are excited to tell you everything about our new Predictive Debugger in Rider.
How does Rider’s Predictive Debugger work?
Rider’s predictive debugger feels similar to ReSharper’s in that it can make predictions about the future program flow. However, it works quite differently.
ReSharper’s implementation executes code through Visual Studio’s Debugger API and is subject to side effects. It’s pretty much the same as if you would evaluate expressions or execute statements in the Immediate tool window.
On the other hand, Rider’s implementation is based on a no-side-effects (NSE) interpreter that interprets annotated IL code. In this case, “annotated” does NOT refer to Roslyn or JetBrains annotations (as in ReSharper’s implementation) but to the multi-level process of analyzing nested methods. During this process, your source code is automatically recompiled using Roslyn with annotations made by our NSE interpreter so that it can capture intermediate values and correlate to IL code:
// Unannotated
void M(Person p)
{
    if (p.GetFullName().Length == 12)
        Console.WriteLine("Exactly 12 chars!");
}

// Annotated
void M(Person p)
{
    if (Tracker.Annotate(p.GetFullName().Length == 12, startLine: 3, startColumn: 7, endLine: 3, endColumn: 20))
        Console.WriteLine("Exactly 12 chars!");
}
These annotations allow our debugger to show helpful highlightings. Stay tuned for the next section to see it in action!
A lot of code eventually calls into native/extern APIs. Because Rider’s predictive debugger works without side effects, these API calls (call and callvirt) are interpreted via hooks. For instance, for all calls of the String.Length method, the following hook is executed instead:
PrimitiveStackValue String__get_Length(
		MethodInstantiation methodInstantiation,
		StringStackValue stackValue)
{
    var length = stackValue.Value.Length;
    return new PrimitiveStackValue(
				length,
				methodInstantiation.MethodSpecification.Method.ReturnValue.Type.SubstituteGenericArguments(methodInstantiation));
}
Compared to ReSharper’s implementation, this approach gives us more opportunity for analysis and ensures that you never have to deal with side effects. But that should be enough about the theory and internals of Rider’s predictive debugger – let’s see it in action!
Rider’s Predictive Debugger in Action
The predictive debugger is enabled by default, and you will see it working immediately once you stop at a breakpoint and suspend the execution. In order to illustrate the different visual cues, we will use the sample code from our previous post:
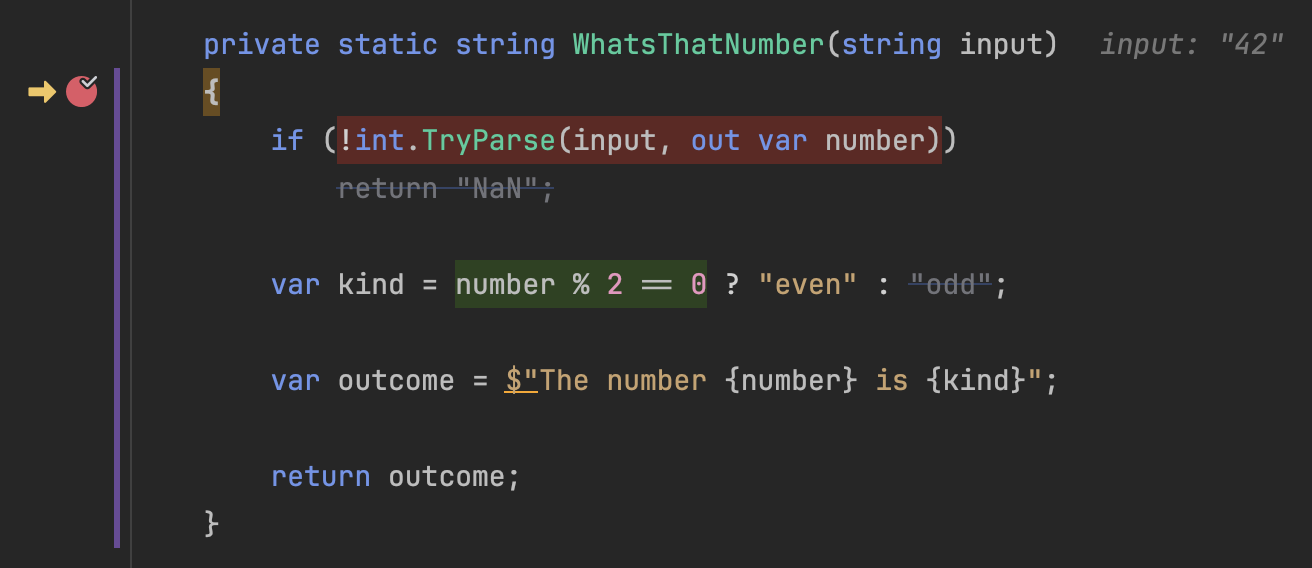
Boolean expressions are highlighted in green and red, indicating their evaluation as true and false, respectively. Unreachable code is “muted” with a grey text color and a strikeout effect.
You may have also noticed the violet-colored bar on the left. This gutter bar acts as an indicator of how far the debugger could interpret your code:
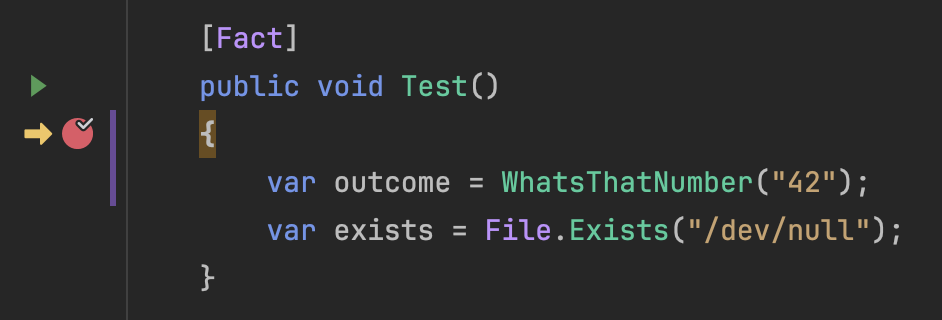
File.Exists also calls into native code. We’re on it to implement a hook!
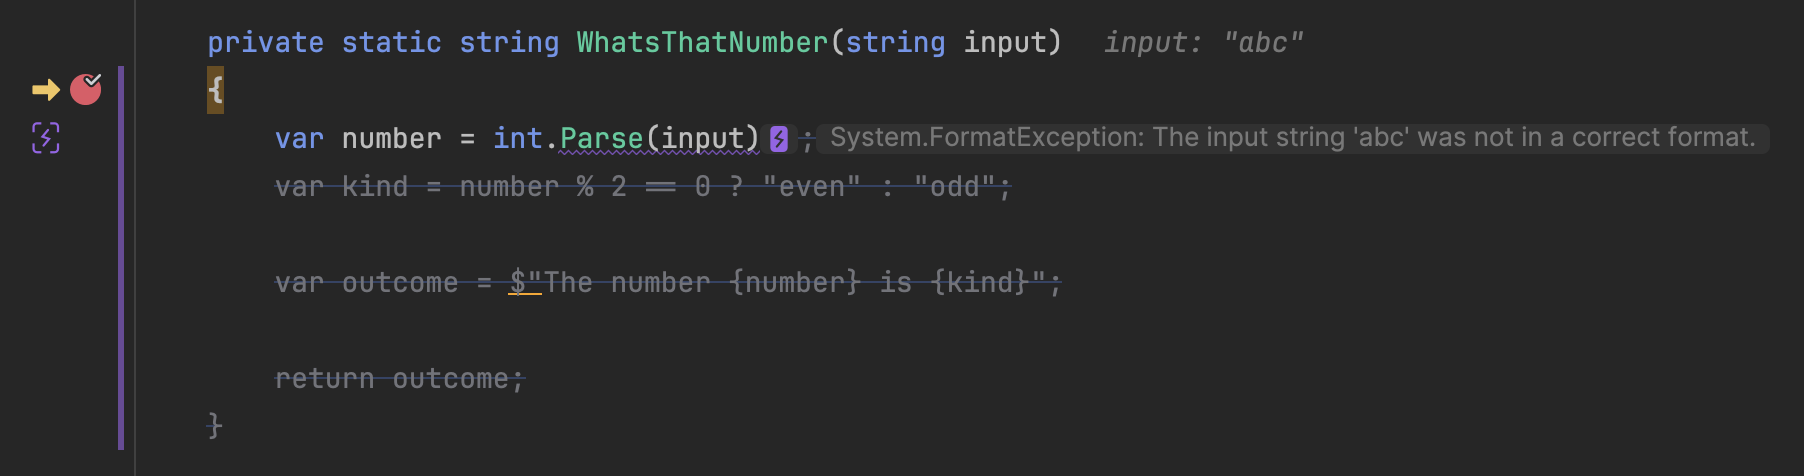
Of course, you will also see exceptions that are going to be thrown. The exception type and message are displayed next to the line as an inlay hint, along with an exception icon. That same exception icon is also displayed in the gutter for faster recognition. A squiggly allows you to identify the statement/expression that is throwing the exception:
The predictive debugger also helps you predict what’s happening inside a loop for different iterations. Using the inlay hints, you can move forward and backward:
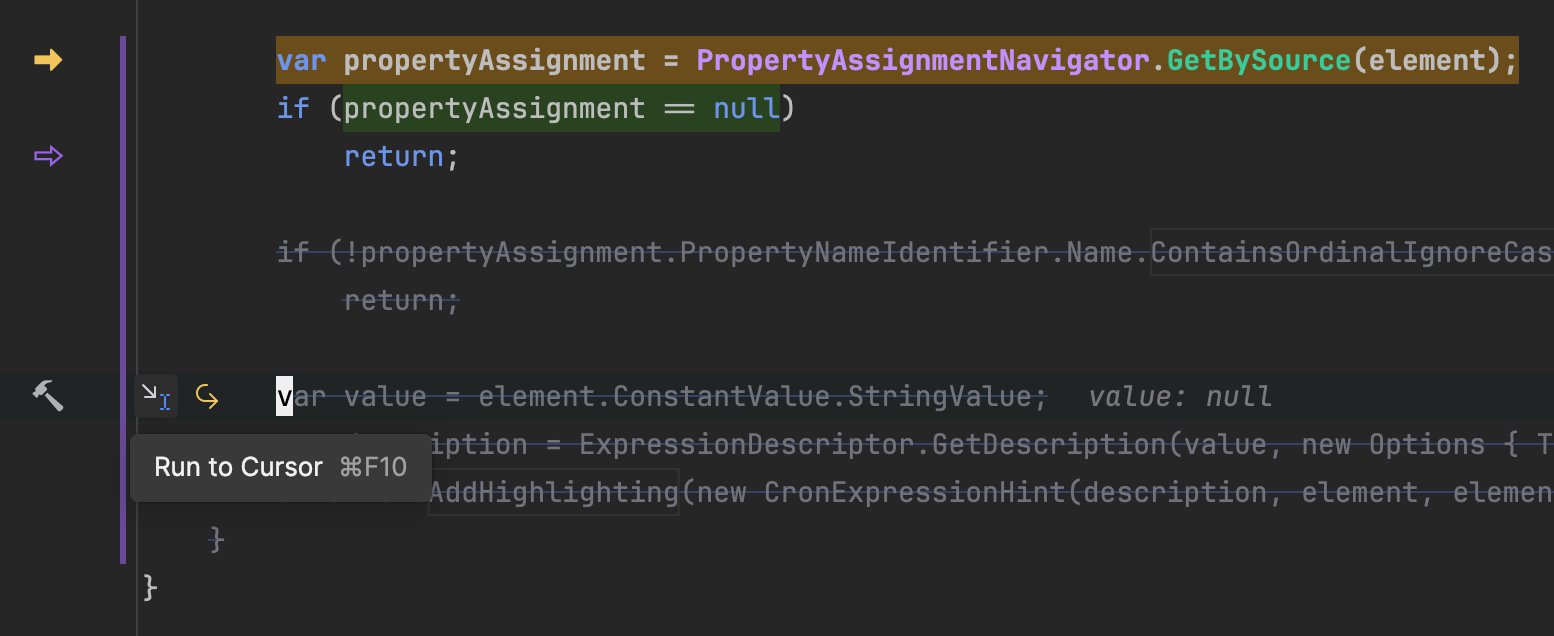
Another great advantage reveals itself in combination with the run-to-cursor floating action. Previously, you may have thought that your code could run to the desired location while it actually returns much earlier, and suddenly, you’re debugging the next call of the function. With Rider 2023.3, this behavior becomes predictable:
Configuring the Predictive Debugger in Rider
The way predictions are displayed is customizable in Rider’s settings dialog under Editor | Color Scheme | Debugger | Predictive debugger. From here, you can change how unreachable code and false/true values should look:
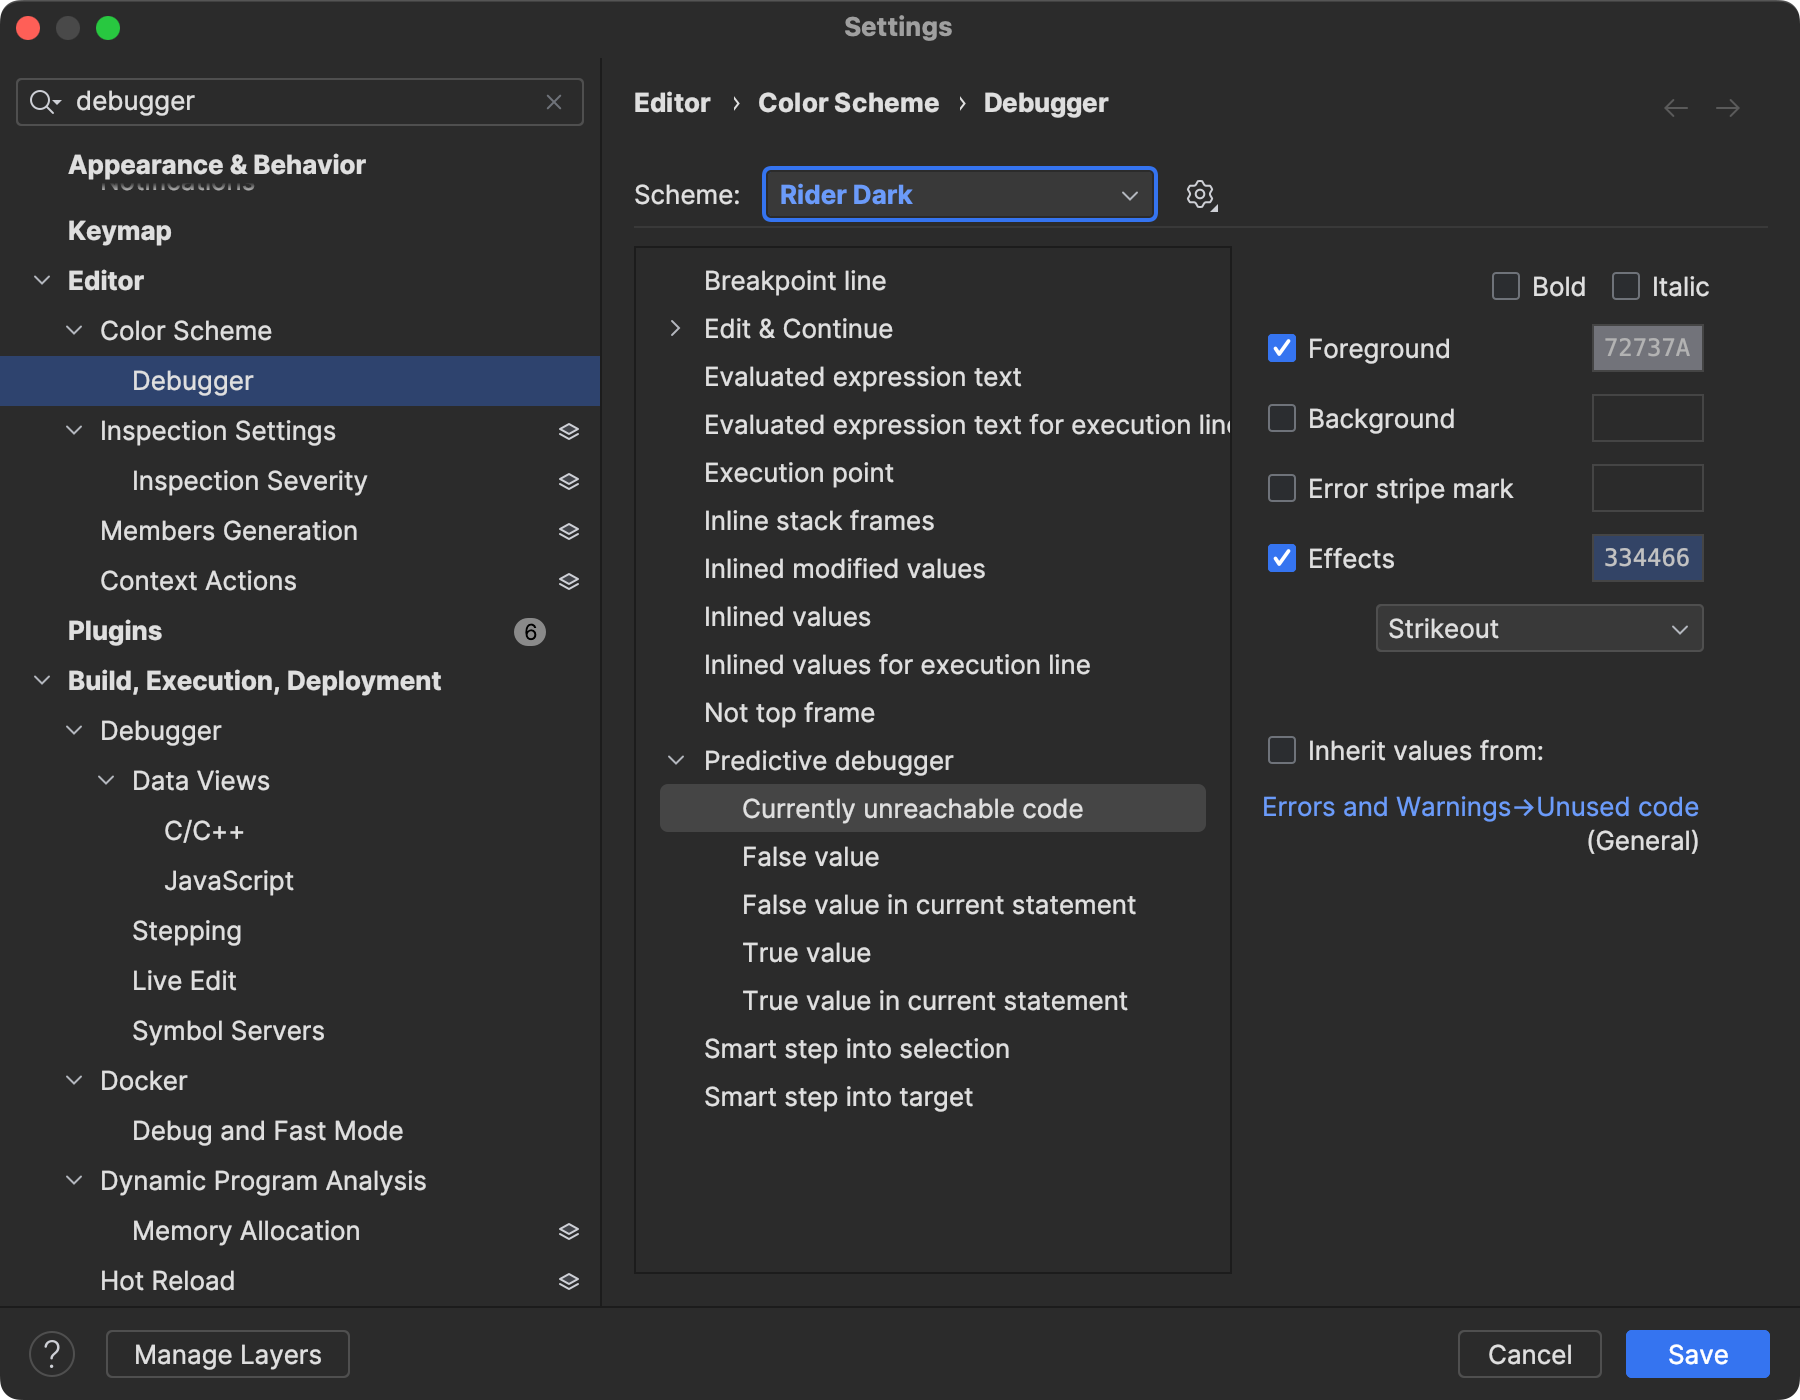
So, for instance, if you prefer unreachable code not to have a strikeout effect (as in ReSharper’s Predictive Debugger), you may change that here.
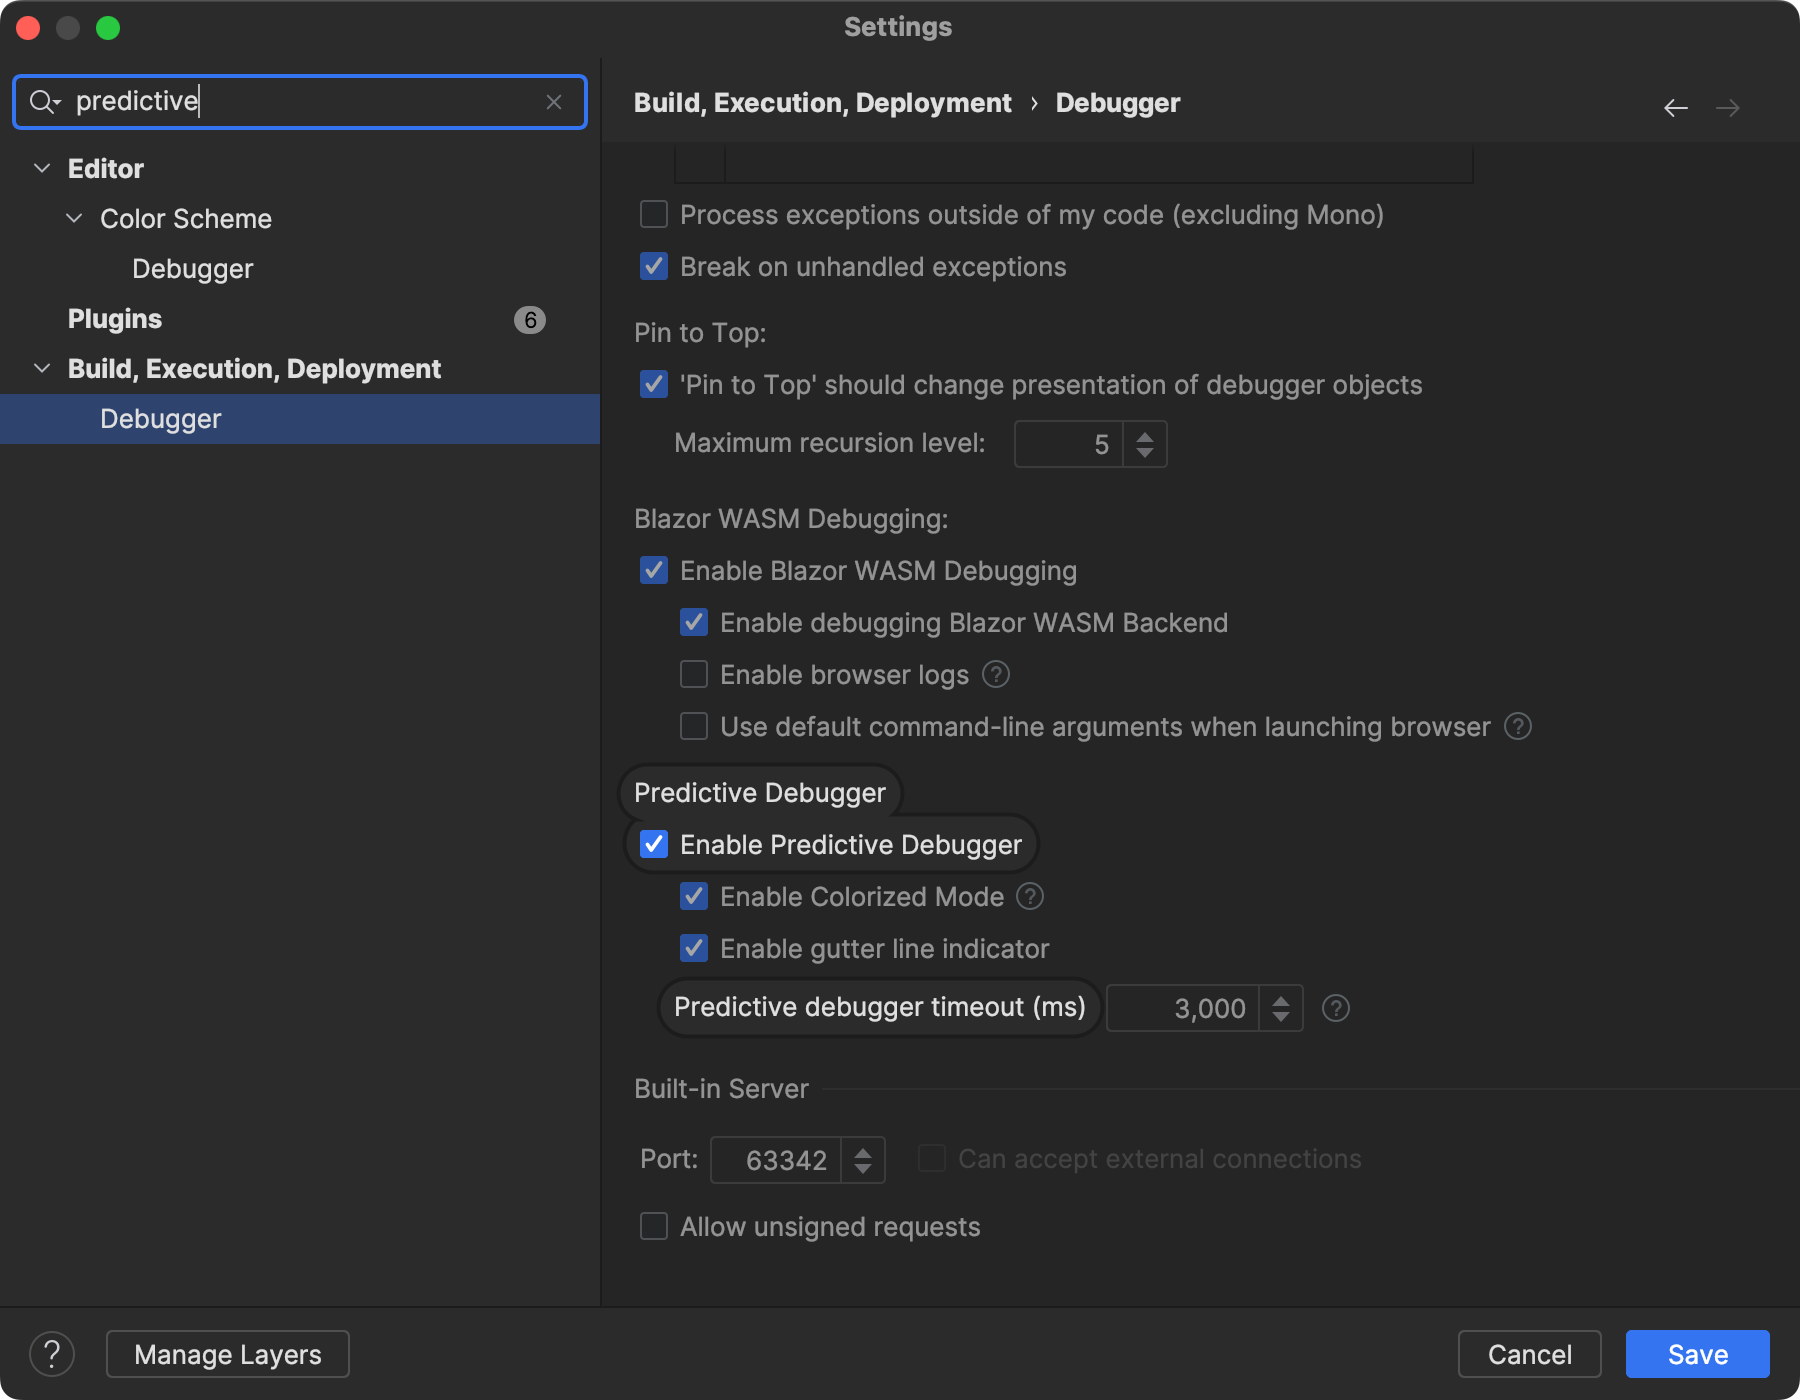
Of course, you can also disable all colorizations, the gutter indicator, or the predictions as a whole under Build, Execution, Deployment | Debugger. Similar to properties in the watch window, you can also change the evaluation timeout:
Future Work
Unlike ReSharper, Rider’s predictive debugger does not show data tips about predicted values yet. Be assured that we will let you know once those arrive!
As for interpreter hooks – we’ve got a large set implemented already! However, we expect more hooks coming for BCL and extern methods to make the interpreter faster. Also, libraries that use P/Invoke might need some help.
Please don’t hesitate to share your code samples with us where you don’t see the expected results.
Conclusion
Rider has quickly caught up with ReSharper’s ability to predict the future program flow. It works quite differently and, therefore, isn’t as prone to side effects as ReSharper’s Predictive Debugger. At the end of the day, though, both features greatly enhance your overall debugging experience.
Give it a go with the latest Rider 2023.3 EAP, and let us know if you have any questions or suggestions in the comments section below. Thanks for reading!
Image credit: Immo Wegmann