.NET Tools
Essential productivity kit for .NET and game developers
Introducing Predictive Debugging: A Game-Changing Look into the Future

With the introduction of debugging tools, software developers were empowered to interactively investigate the control flow of software programs to find bugs in live environments. At JetBrains, we’ve always strived to improve the art of debugging. Besides the more standard things you expect from a debugger, we also introduced features like:
- Inline local variables, current line expressions and function returns
- Floating execution actions and Pin-to-top (Rider)
- Immediate window with code completion (Rider)
- Edit & Continue and Tooltip Evaluation (Rider)
- Smart Step-Into behavior (Rider)
- Advanced Breakpoints (dependent, temporary, and more) (Rider)
Check out Joseph Guadagno’s talk on Debugging Tips and Tricks with JetBrains Rider to see these features live and in action!
As a seasoned developer, you may have heard a few criticisms of using debuggers. Debugging critics usually advise putting more thought into the issue at hand, instrumenting unit tests, or adding good old log output.
Every software project is different, but we can probably agree that software development has become more complex over the years. We write code that runs on remote machines (including Docker), incorporates more and more third-party libraries, and must scale for millions of operations per second. These scenarios can be hard or impossible to troubleshoot with just logs or unit tests. However, our first-class debugging tools give you great options to handle these with ease:
- Debugging into NuGet packages
- Exploring Memory usages (Rider)
- Debugging Remote Processes over SSH (Rider)
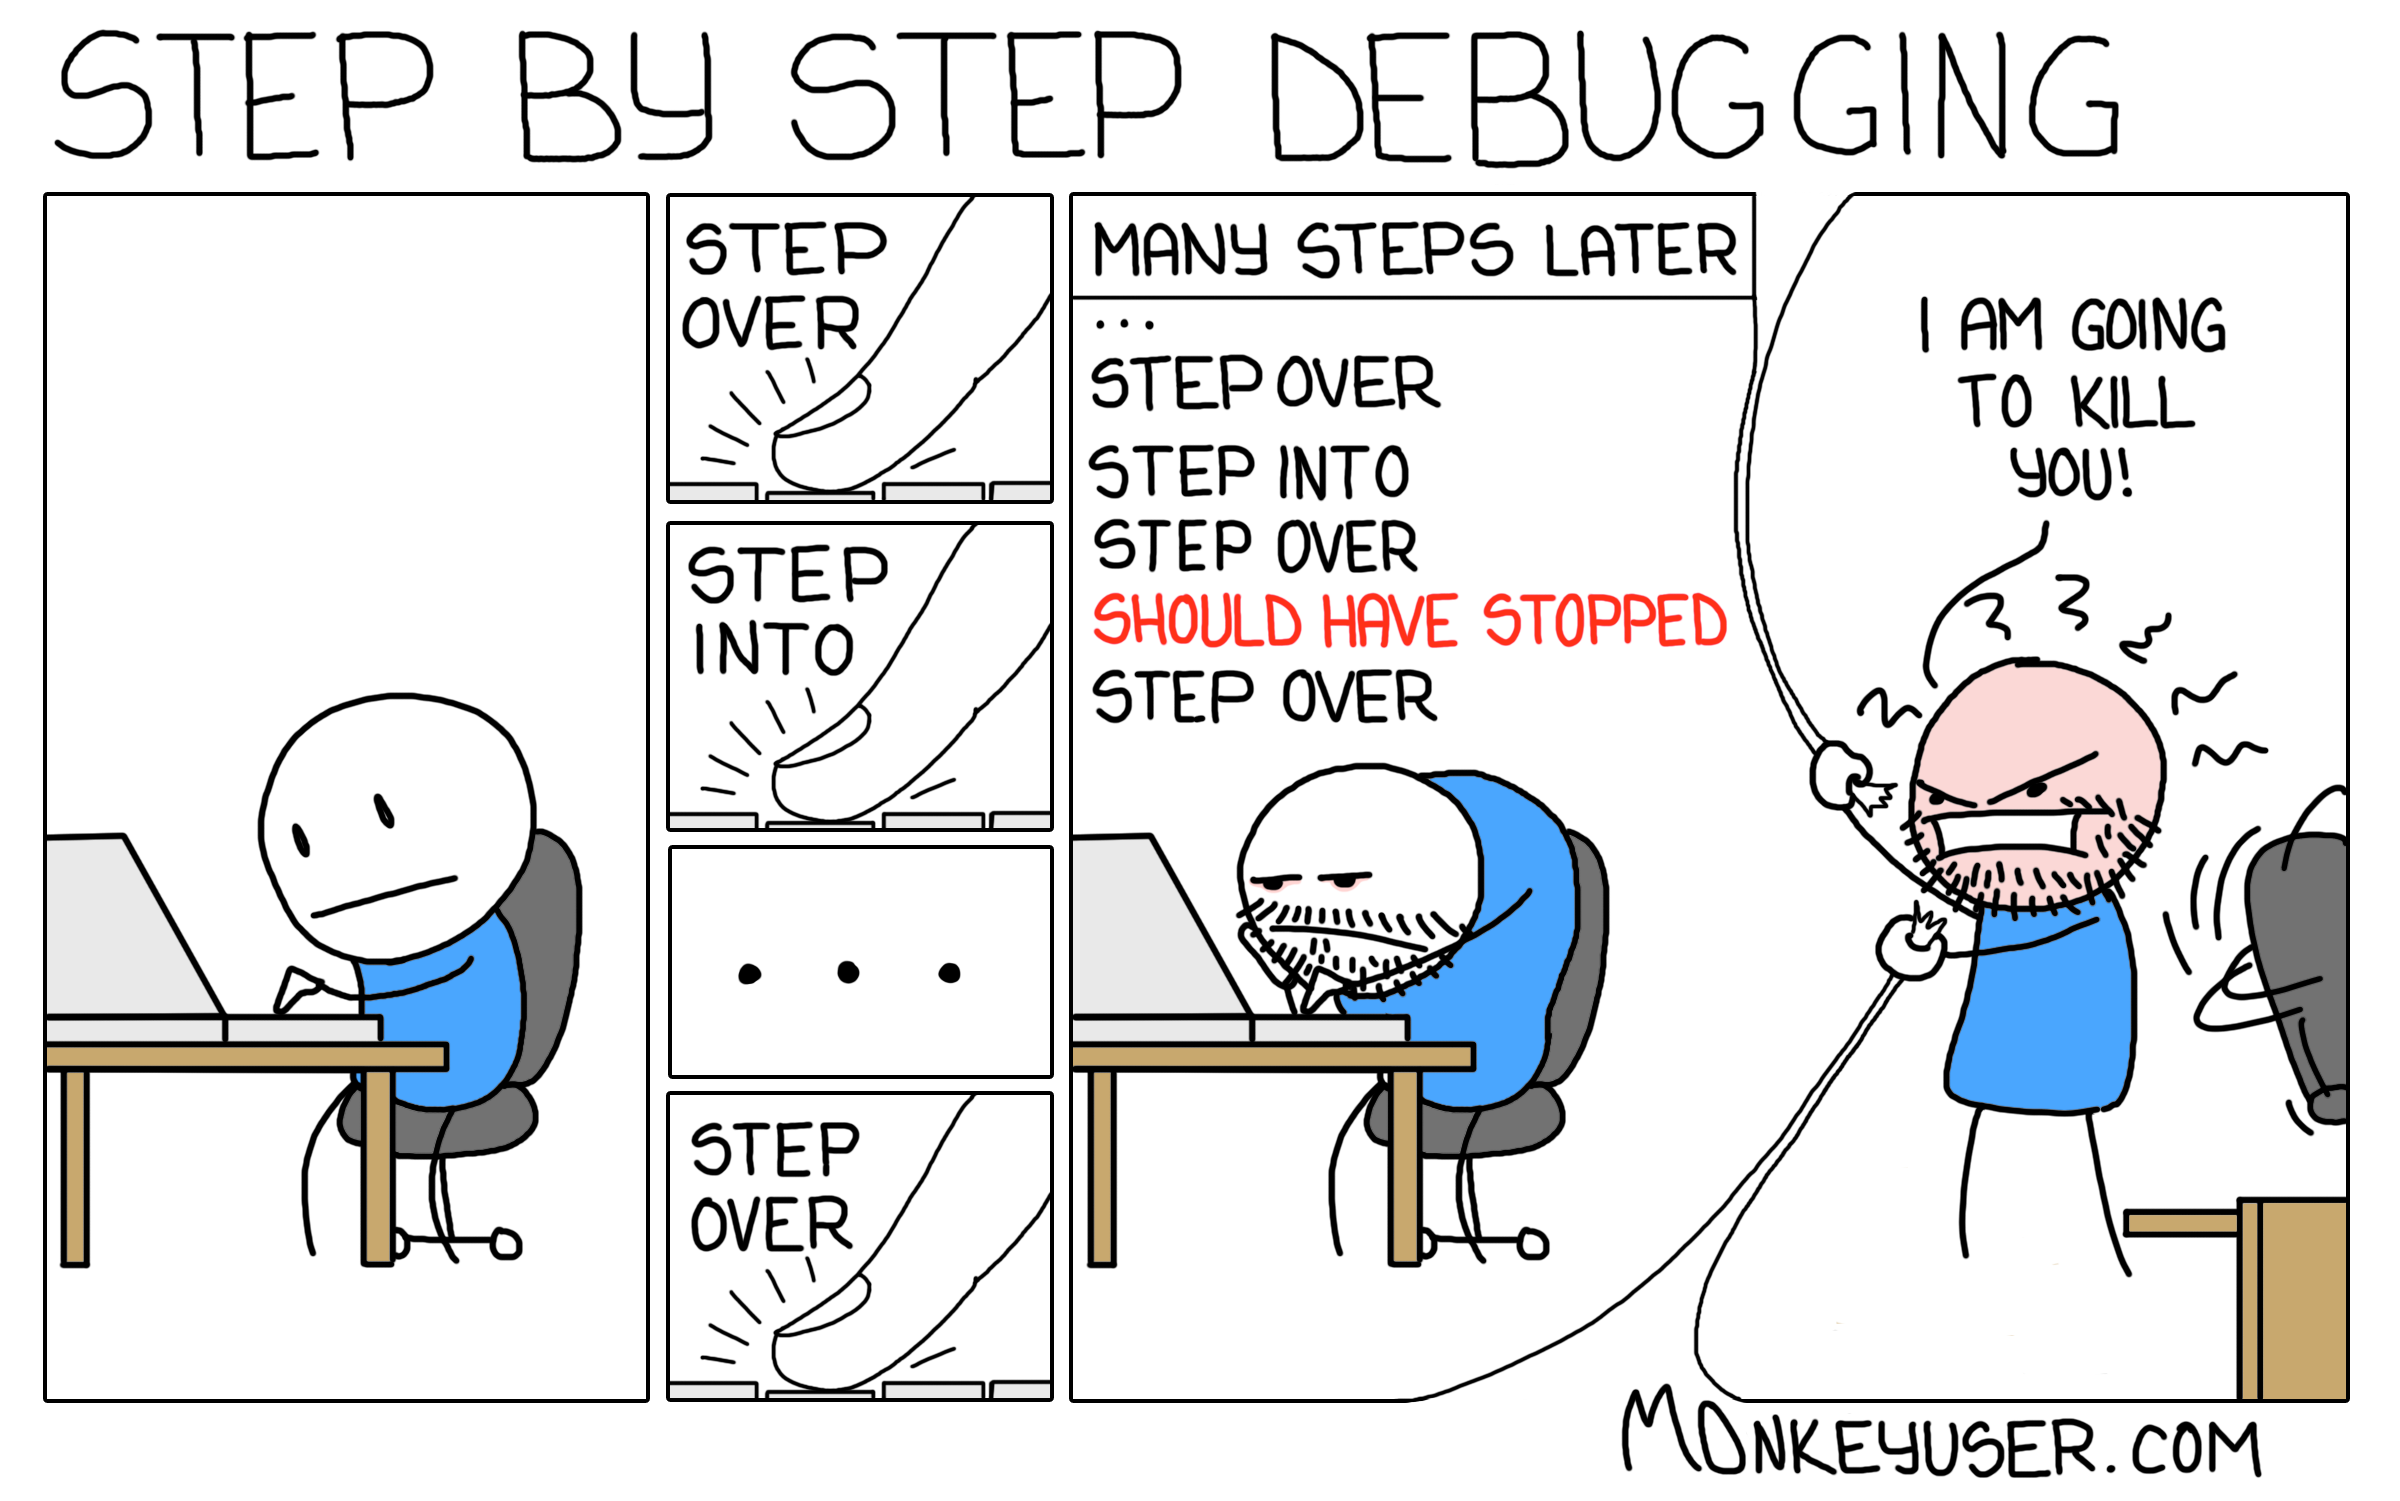
Nevertheless, although JetBrains tools provide a rich debugging experience, developers often find themselves in a situation of step-by-step debugging with lots of restarts and scattered breakpoints:
It comes as no surprise that we want to take your debugging experience to the next level. My fellow .NET developers, meet the predictive debugger in ReSharper 2023.2!
Getting Started with the Predictive Debugger
The predictive debugger is currently in beta and only available in ReSharper (Rider will come later). If you want to try it out, head over to the options page under Tools | Debugger | Editor Integration | Predictive Debugger and enable Show predicted values (beta):
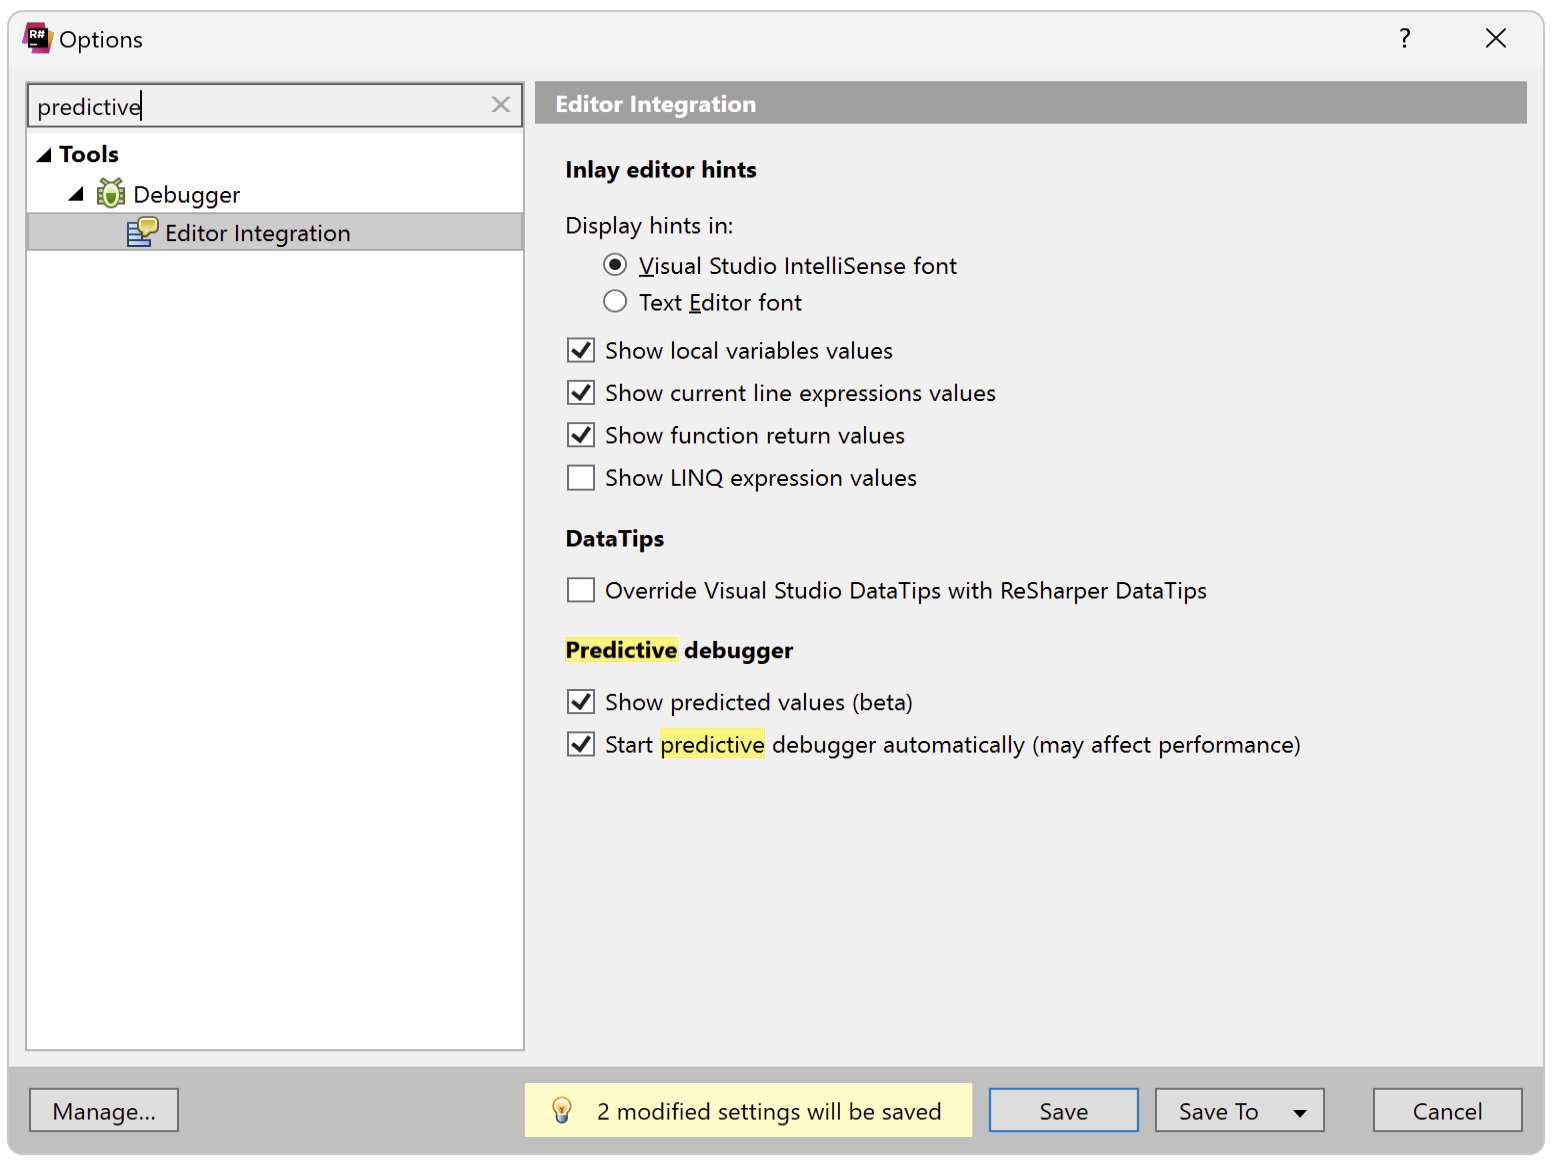
For minimal effort, you can also enable the Start predictive debugger automatically option, but be aware that this might affect performance.
Once enabled, you can start debugging into the future! Let’s begin with an easy-to-follow example:
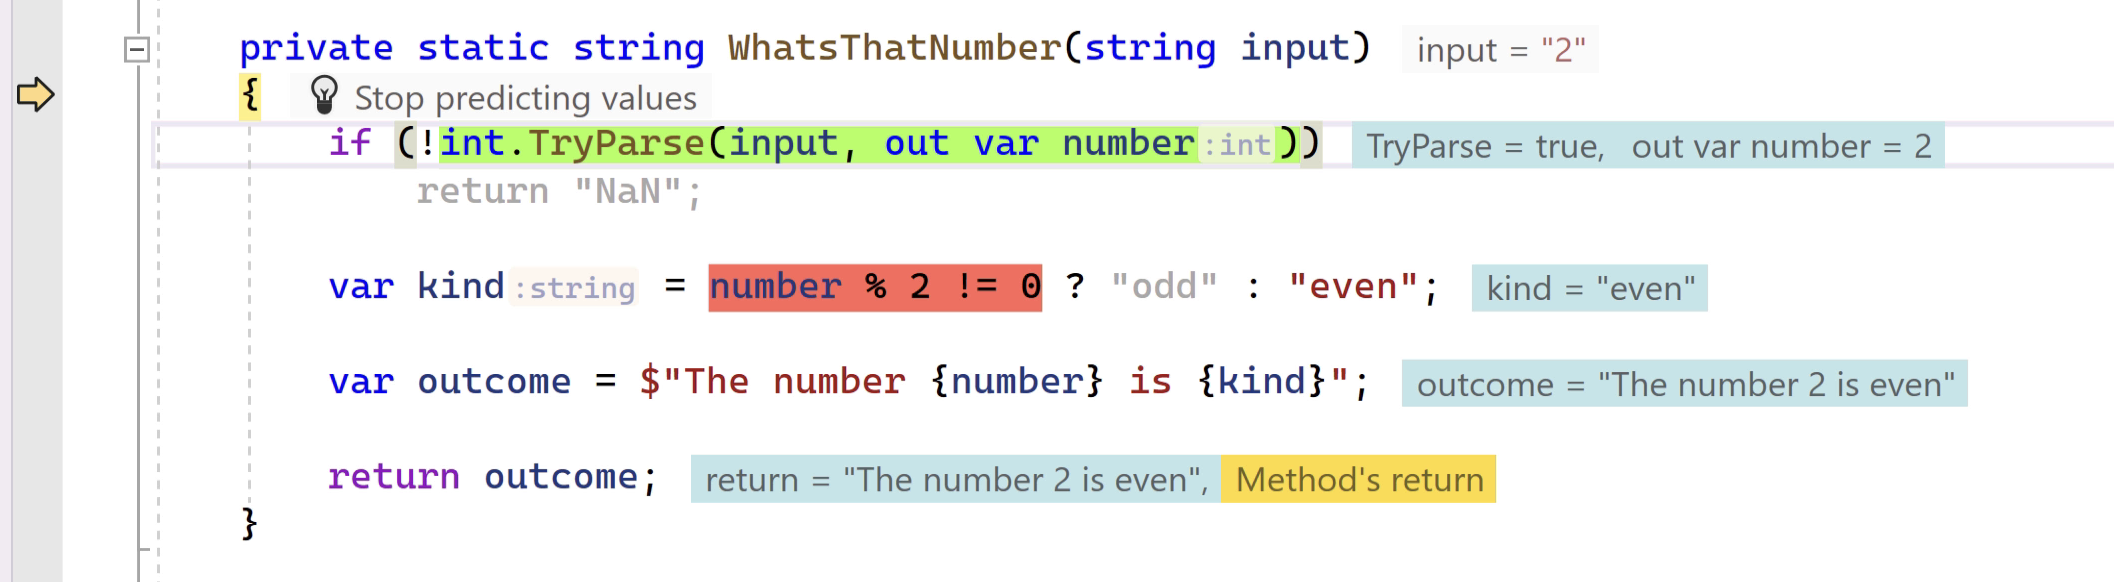
Hopefully, the colors give you a good idea of what’s happening, but of course, we will walk through them anyway:
- Expressions highlighted in green or red indicate that the expression was evaluated to
trueorfalse, respectively. - Statements that are grayed-out indicate that the code path won’t execute, similar to dead code.
- Inline values highlighted in blue show the predicted values after executing the corresponding statement.
- Yellow or red inlay hints show where the prediction ends; for example, when a method returns, an exception is thrown (caught vs. uncaught), or the program halts (
Environment.Exit).
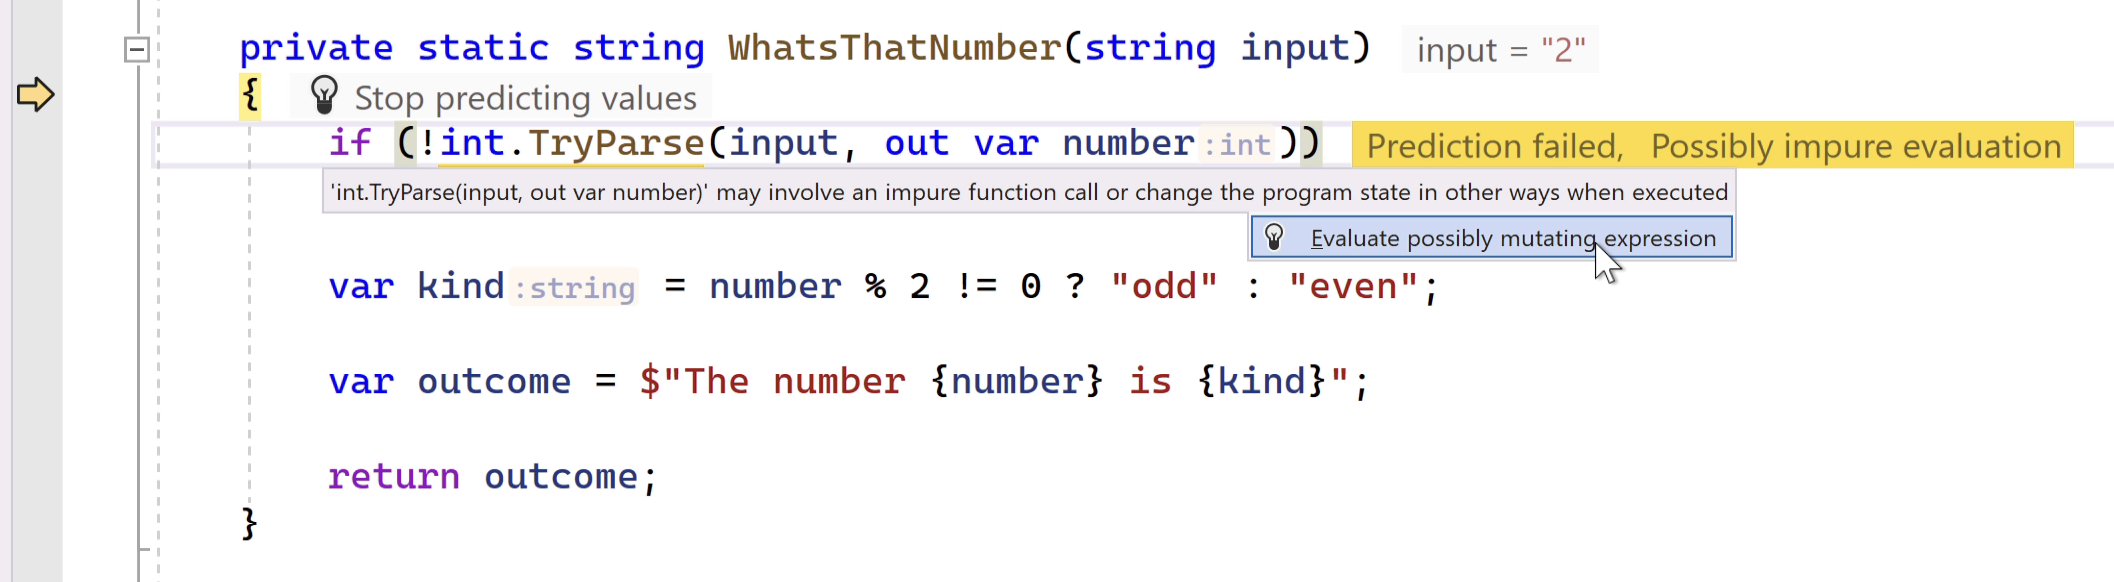
A prediction can also end at a function call the debugger is cautious about evaluating. That is for your own (or your software’s) well-being. Since code is executed during debugging, the debugger has to be sure that it’s not causing any mutations. When running the above example, we must confirm the evaluation of the int.TryParse method (more about that later):
Are you ready for peak productivity? Watch this next example, where the predictive debugger allows our team to perform live edits (Edit & Continue) and eventually fix a bug within the Roslyn codebase!
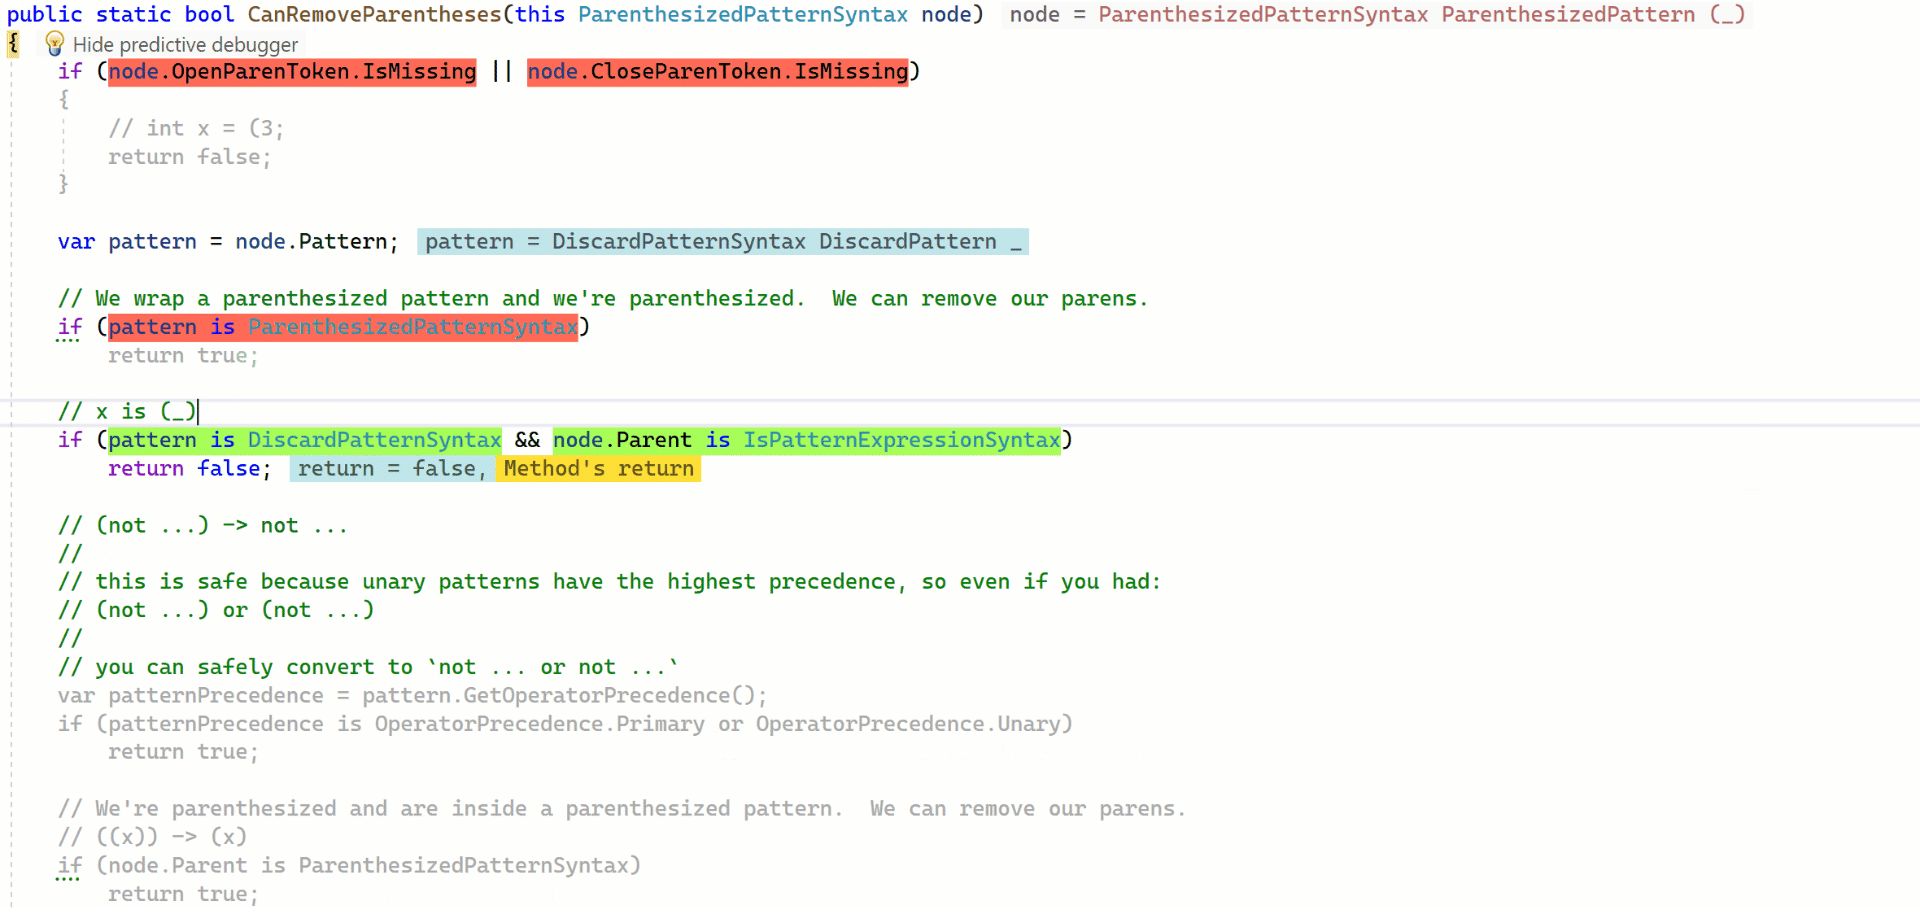
As you can imagine, the C# analysis implementation is rather complex, with many test cases and notable starting times. Predictive debugging makes these tasks a lot easier.
Enhancing Predictions with Annotations
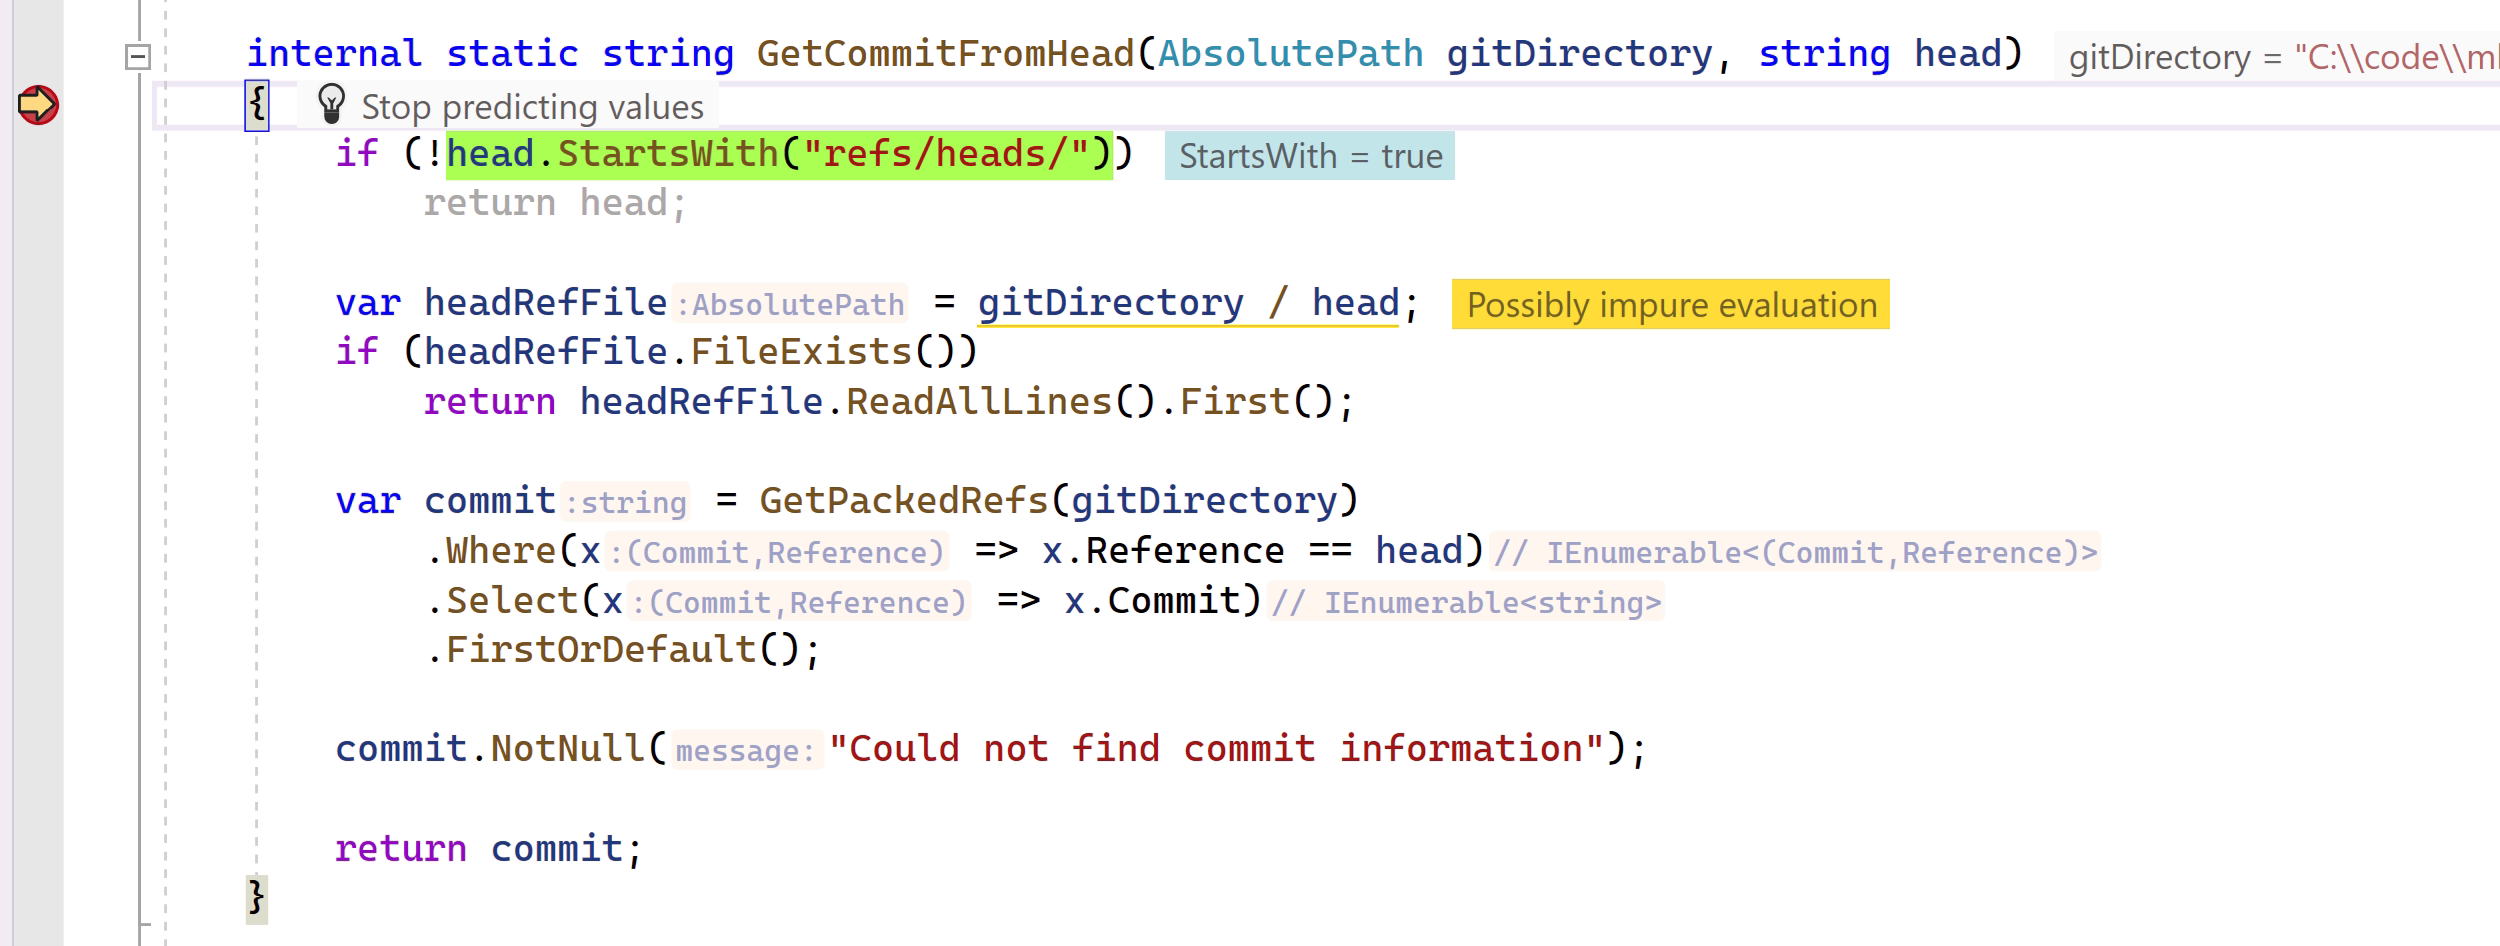
As mentioned in the previous section, the predictive debugger won’t evaluate possibly impure functions to avoid side effects. As a human developer, you most certainly have more knowledge about the code, which is why we give you the possibility to forcefully evaluate a call by clicking the hint:
Of course, it would be technically possible to always evaluate this function with the click of a button. However, if you are a long-term friend and lover of our tools, you’ll know that our .NET products are even smarter when you enhance your code with annotations. In contrast to a local “allow list of functions to execute”, annotations benefit from being code-centric and available to the whole team.
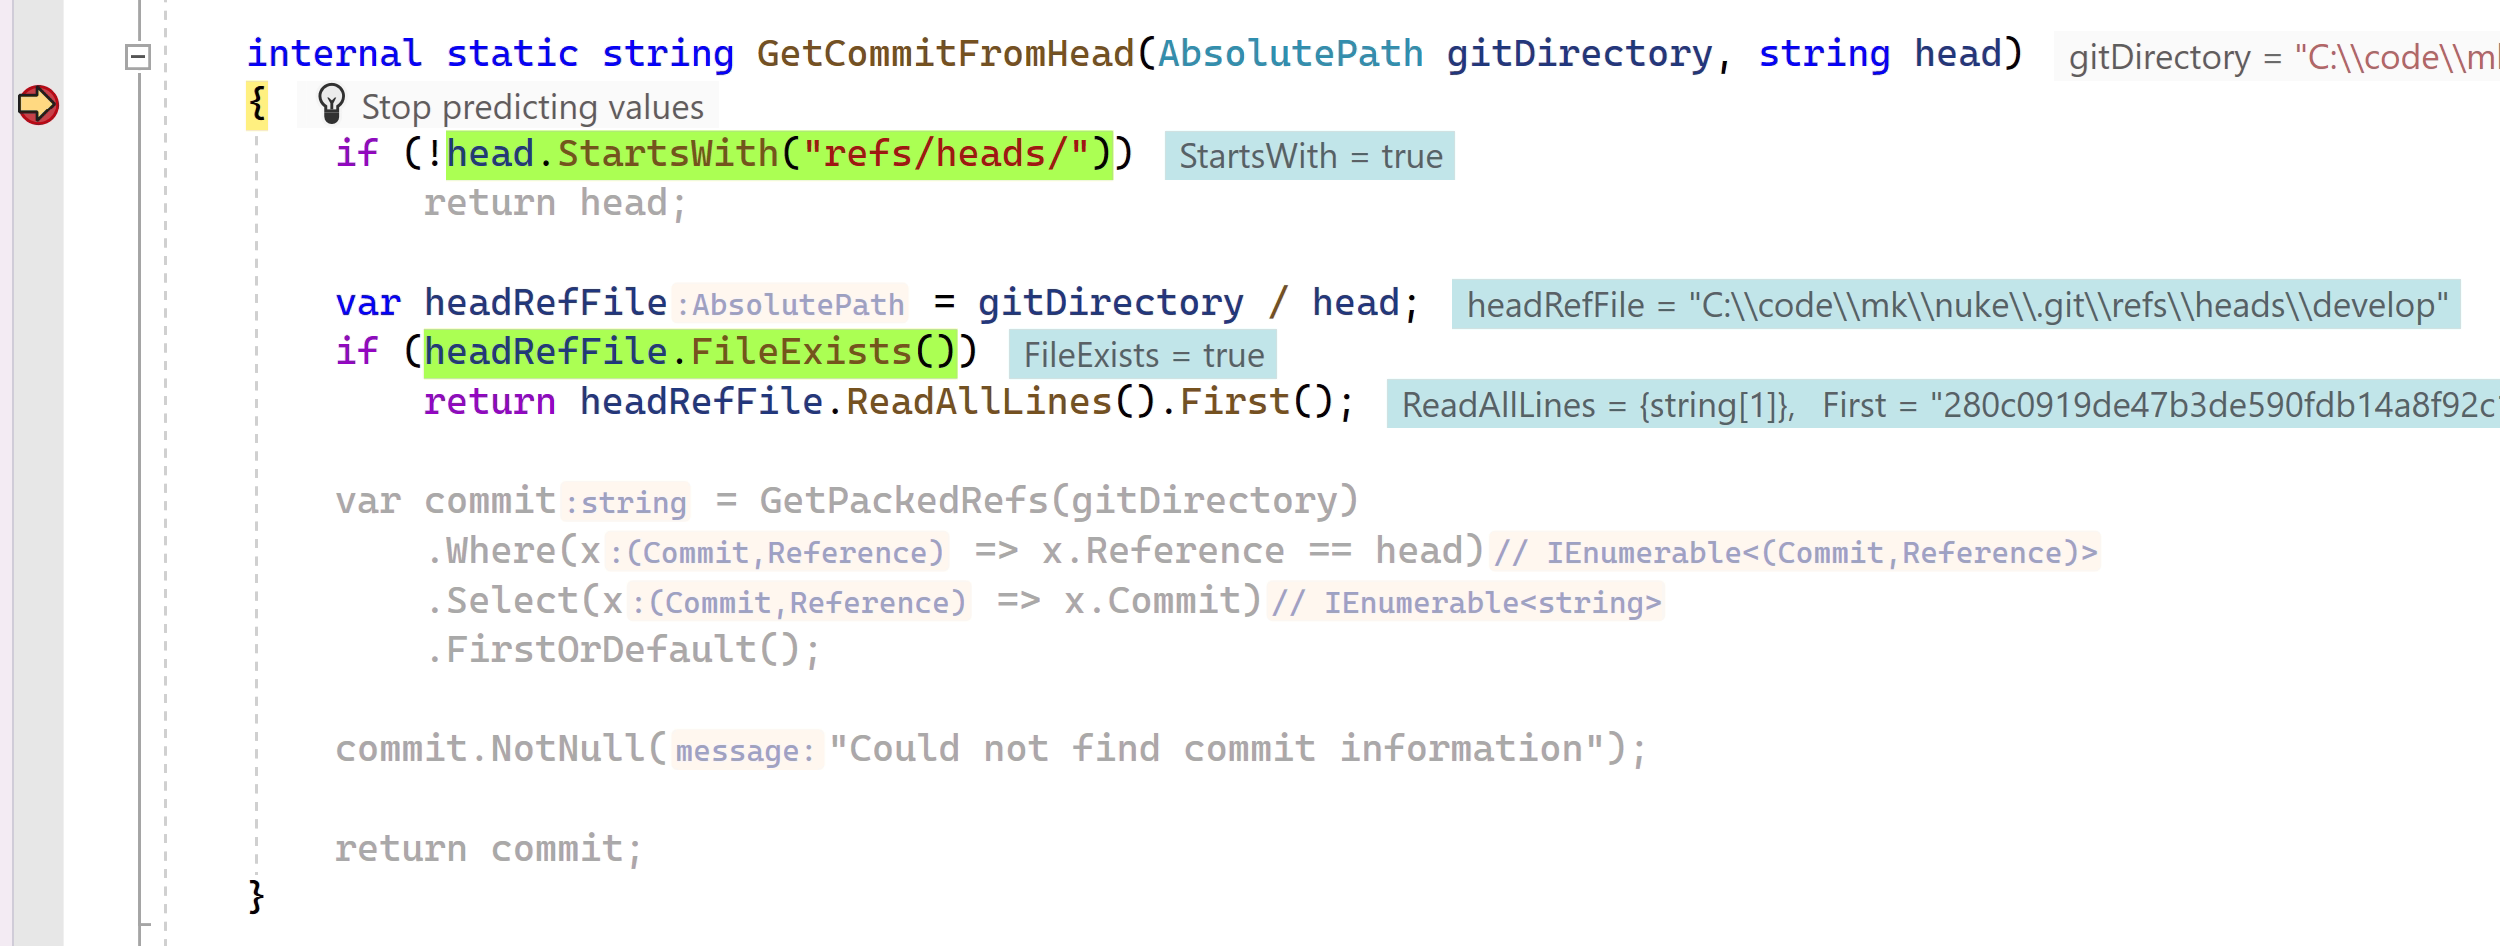
The PureAttribute (either from JetBrains.Annotations or System.Diagnostics.Contracts) was previously used to indicate that a method does not make any observable state changes and that its return value is not used. For the predictive debugger, this attribute comes in handy because the attribution informs the debugger that the method is safe to evaluate. Once we put the PureAttribute on all our qualified functions (i.e., the / division operator, FileExists, and ReadAllLines), the debugger can tell us right away about the outcome of the method:
Debugger predictions also consider contract annotations, which allow to formulate program halts and null/not-null return values based on the function’s input.
Future Work and Limitations
We will use external annotations to mark code we cannot control to reduce possibly impure evaluations. For example, to declare File.Exists or int.TryParse as pure functions.
Unfortunately, async/await code is unsupported because the debugger doesn’t allow multithreaded evaluations.
As already noted, the predictive debugger is currently in beta, meaning that your feedback is crucial for it to reach its full potential. Please report any bugs you encounter to our issue tracker, along with any suggestions or requests you may have.
Conclusion
For our conclusion, let’s come back to one of the debugger criticisms:
Debuggers don’t remove bugs. They only show them in slow motion.
There’s no doubt that debuggers on their own do not remove any bugs. It is rather important to treat the predictive debugger as another tool in our toolbox. A tool that can help understand so-called “impossible situations” (see 6 stages of debugging) more quickly and without any code modifications, allowing us to then write covering tests more efficiently.

Give it a go with the latest ReSharper 2023.2 EAP, and let us know if you have any questions or suggestions in the comments section below. Thanks for reading!
Image credit: Hasnain Sikora