IntelliJ IDEA
IntelliJ IDEA – the Leading IDE for Professional Development in Java and Kotlin
IntelliJ IDEA 2017.3 Public Preview
IntelliJ IDEA 2017.3 is now available for public preview! Everyone is welcome to download the public preview build right away. We are committed to creating a better product, we really appreciate your input when you share your feedback and send us bug reports. We are constantly working to improve user experience and productivity, and, of course, on bug fixes. In this post, we’d like to give you a glimpse of the highlights of the upcoming release.
Java inspections & quick-fixes
IntelliJ IDEA 2017.3 has loads of new improvements made to the data flow analysis.
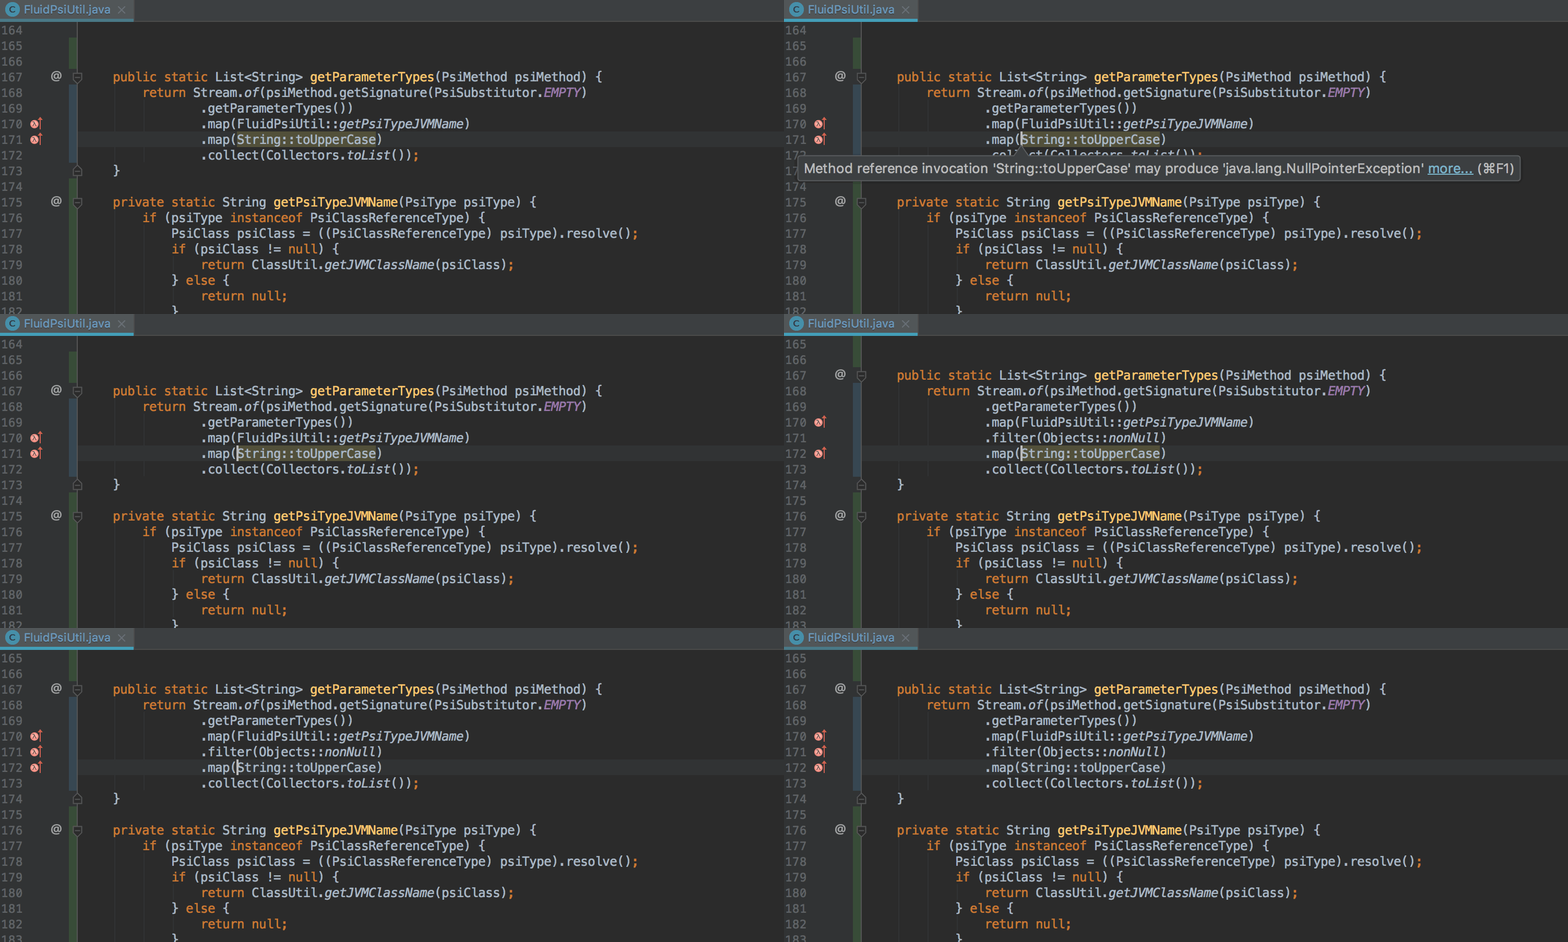
The IDE now detects possible nullability issues in Stream API call chains:
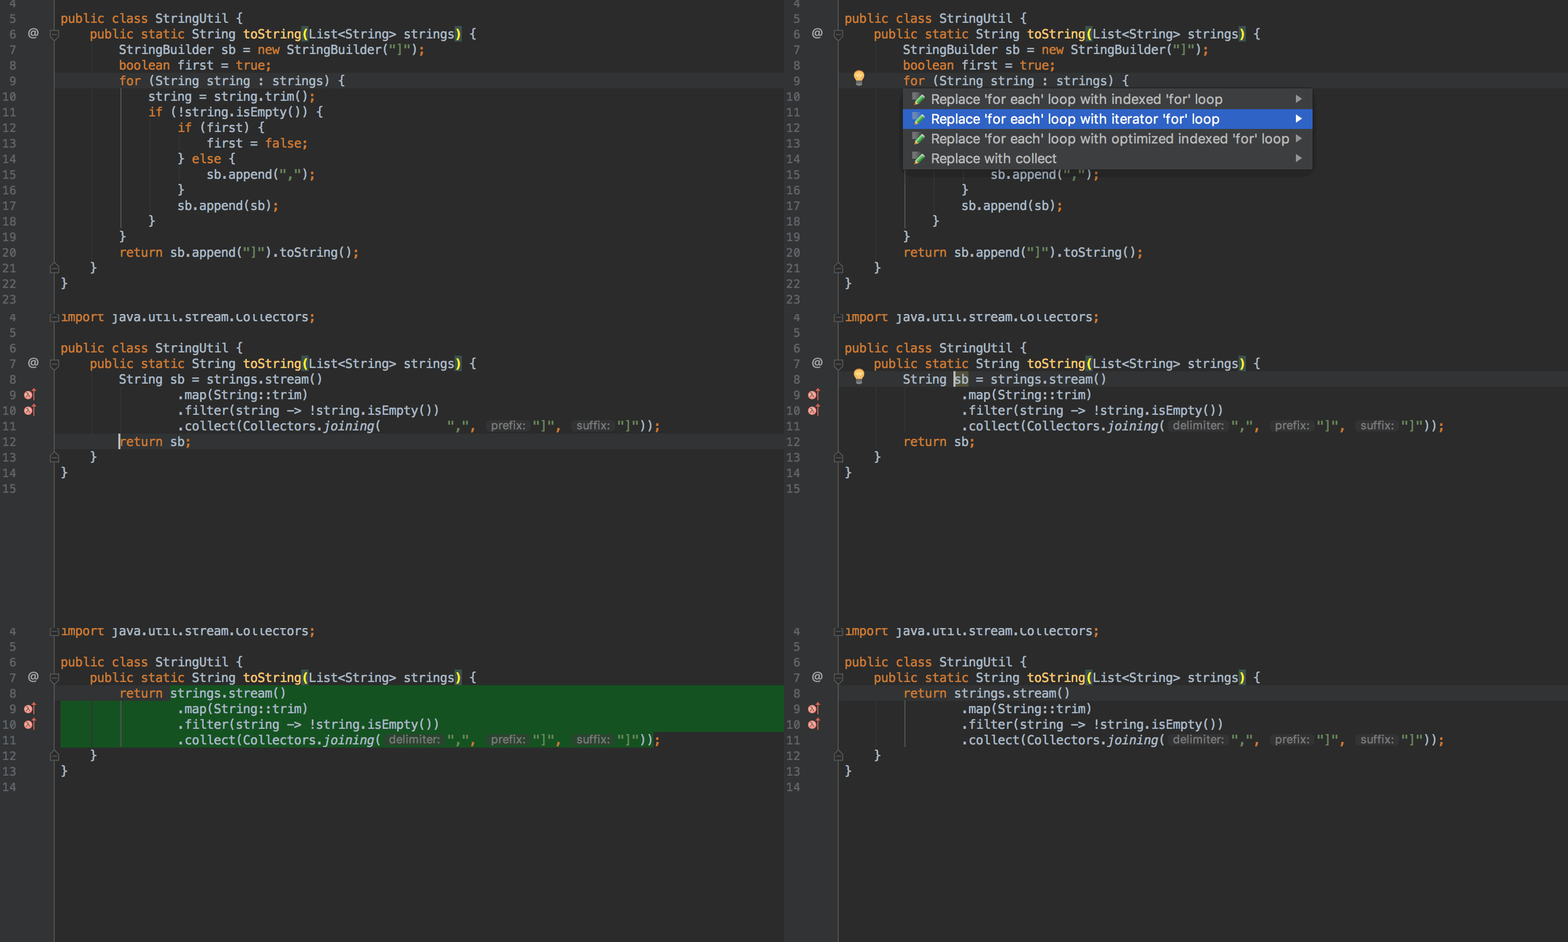
Now you can replace StringBuilder usages with Stream.collect and Collectors.joining:
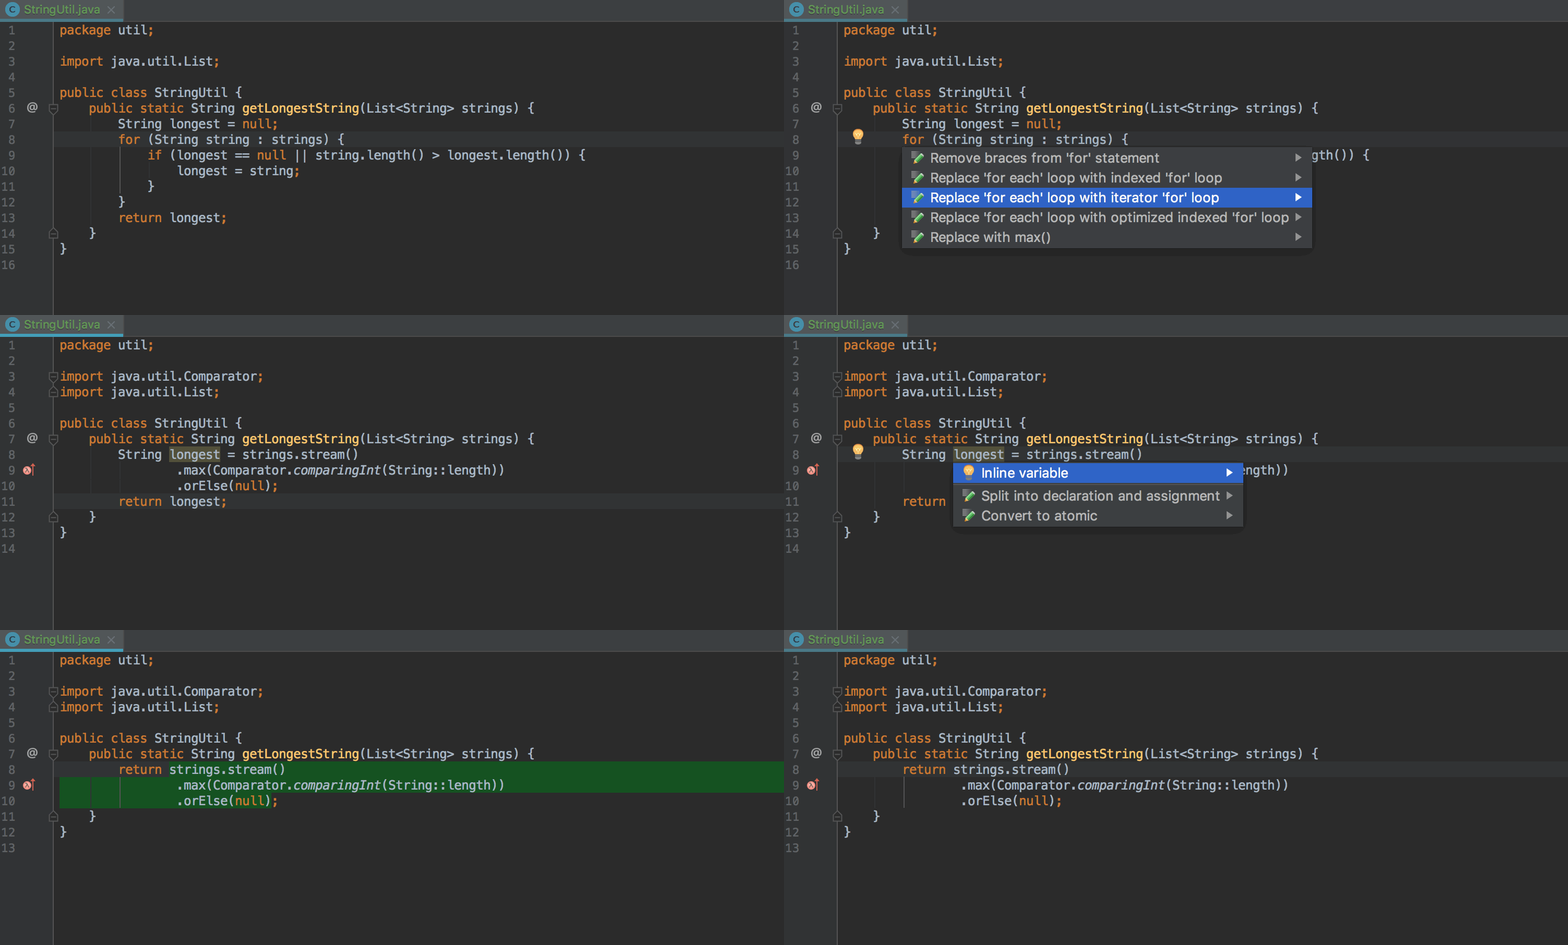
You can replace code that iterates to find a maximum or a minimum with Stream.max and Stream.min:
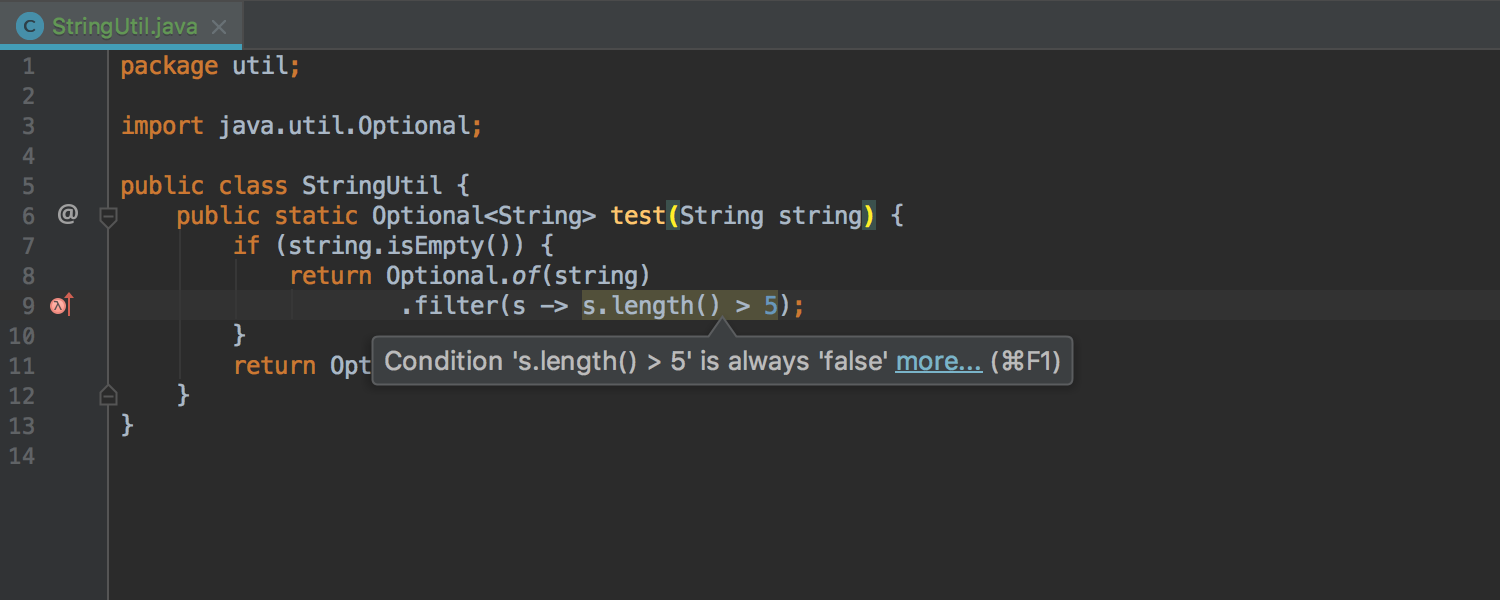
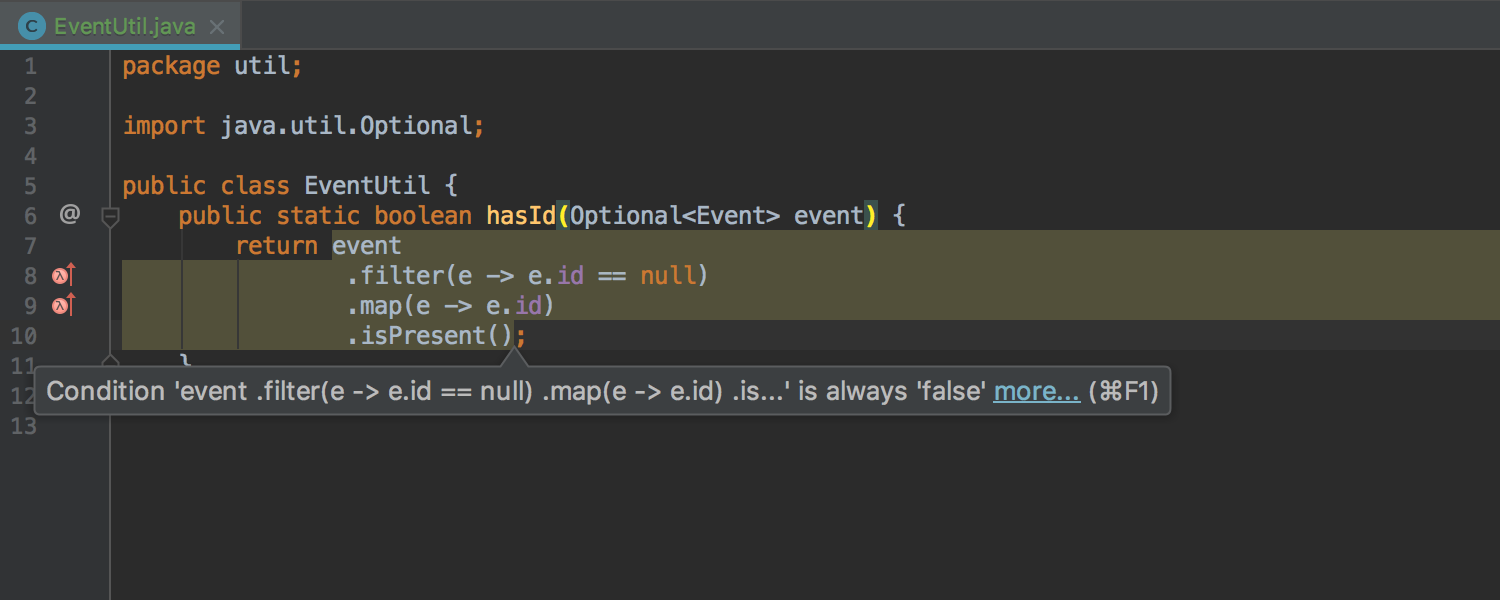
We’ve made the data flow analysis for the Optional type even smarter:
It now even detects issues that were not obvious:
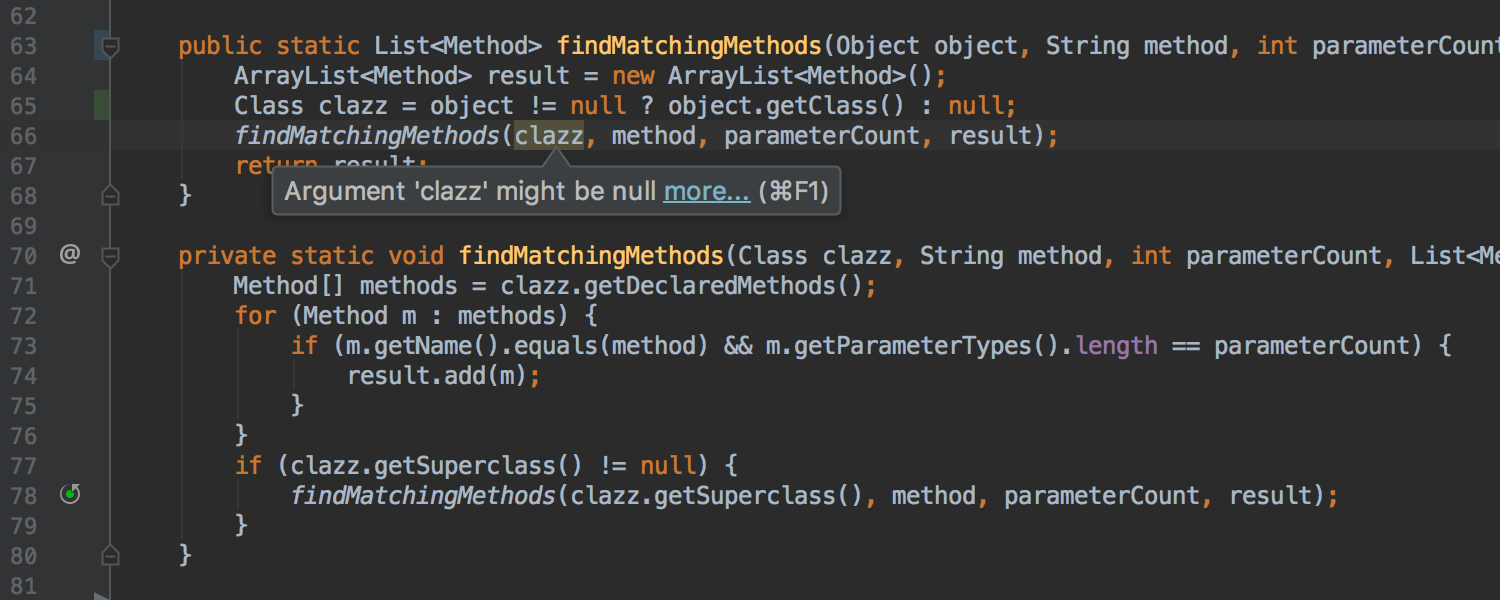
The updated inspection infers nullability annotations for parameters of sealed and private methods:
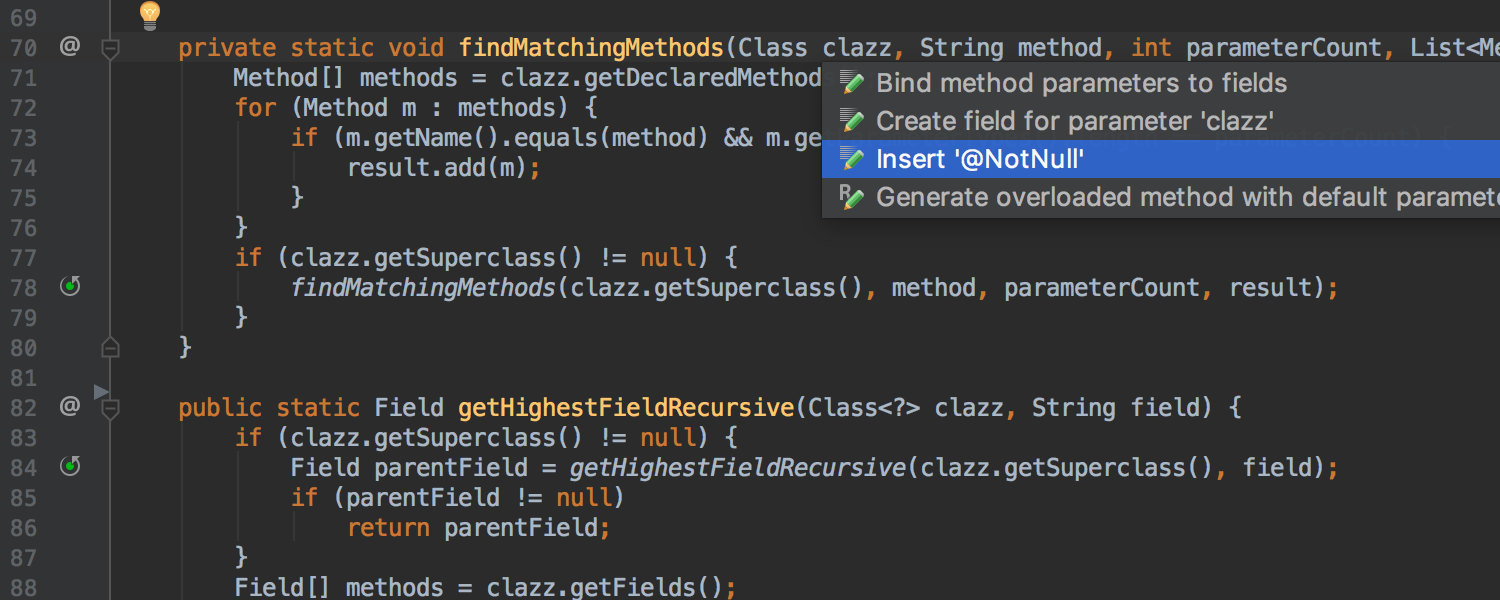
It offers a quick-fix to explicitly declare the inferred annotation:
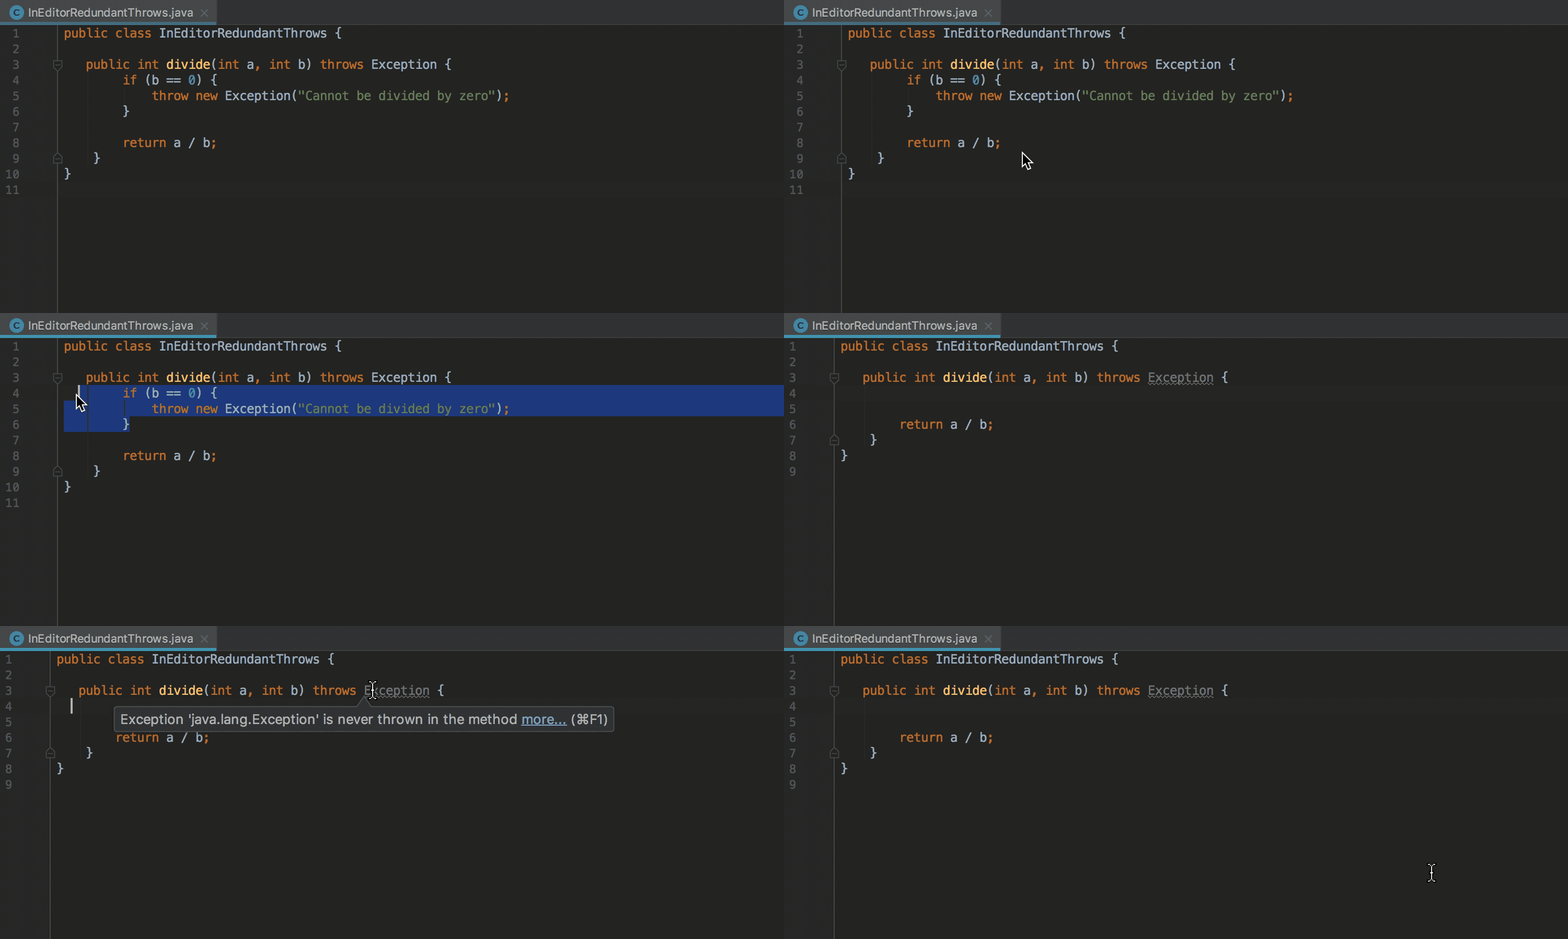
Redundant throws declarations can now be detected and fixed on the fly.
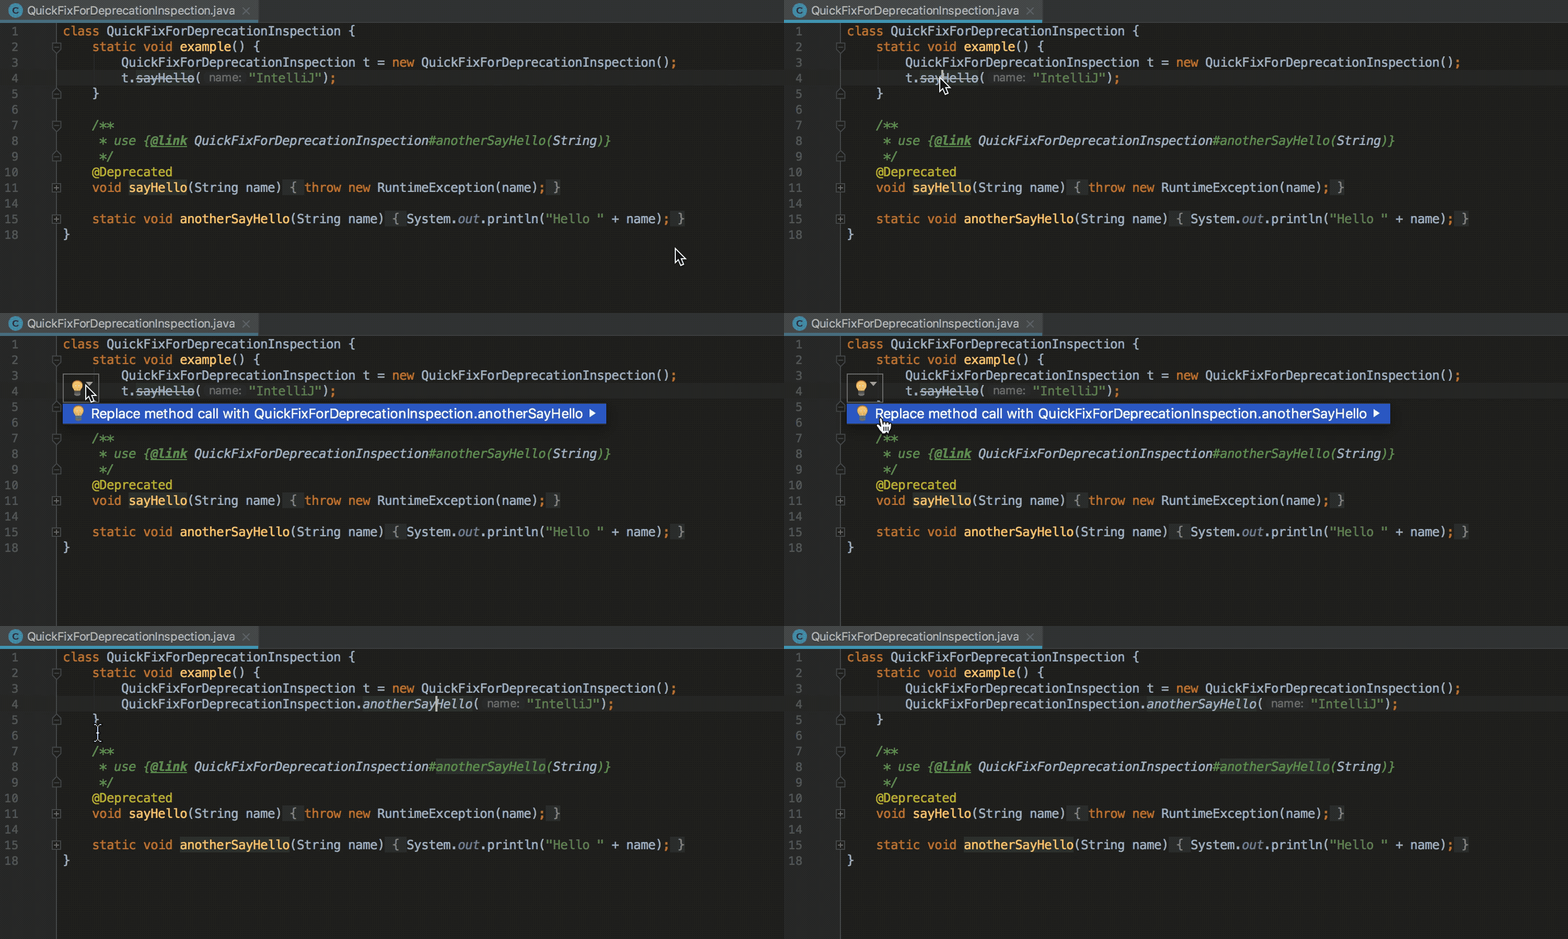
For deprecated code, the IDE now suggests a quick-fix if there is a replacement method in the JavaDoc.
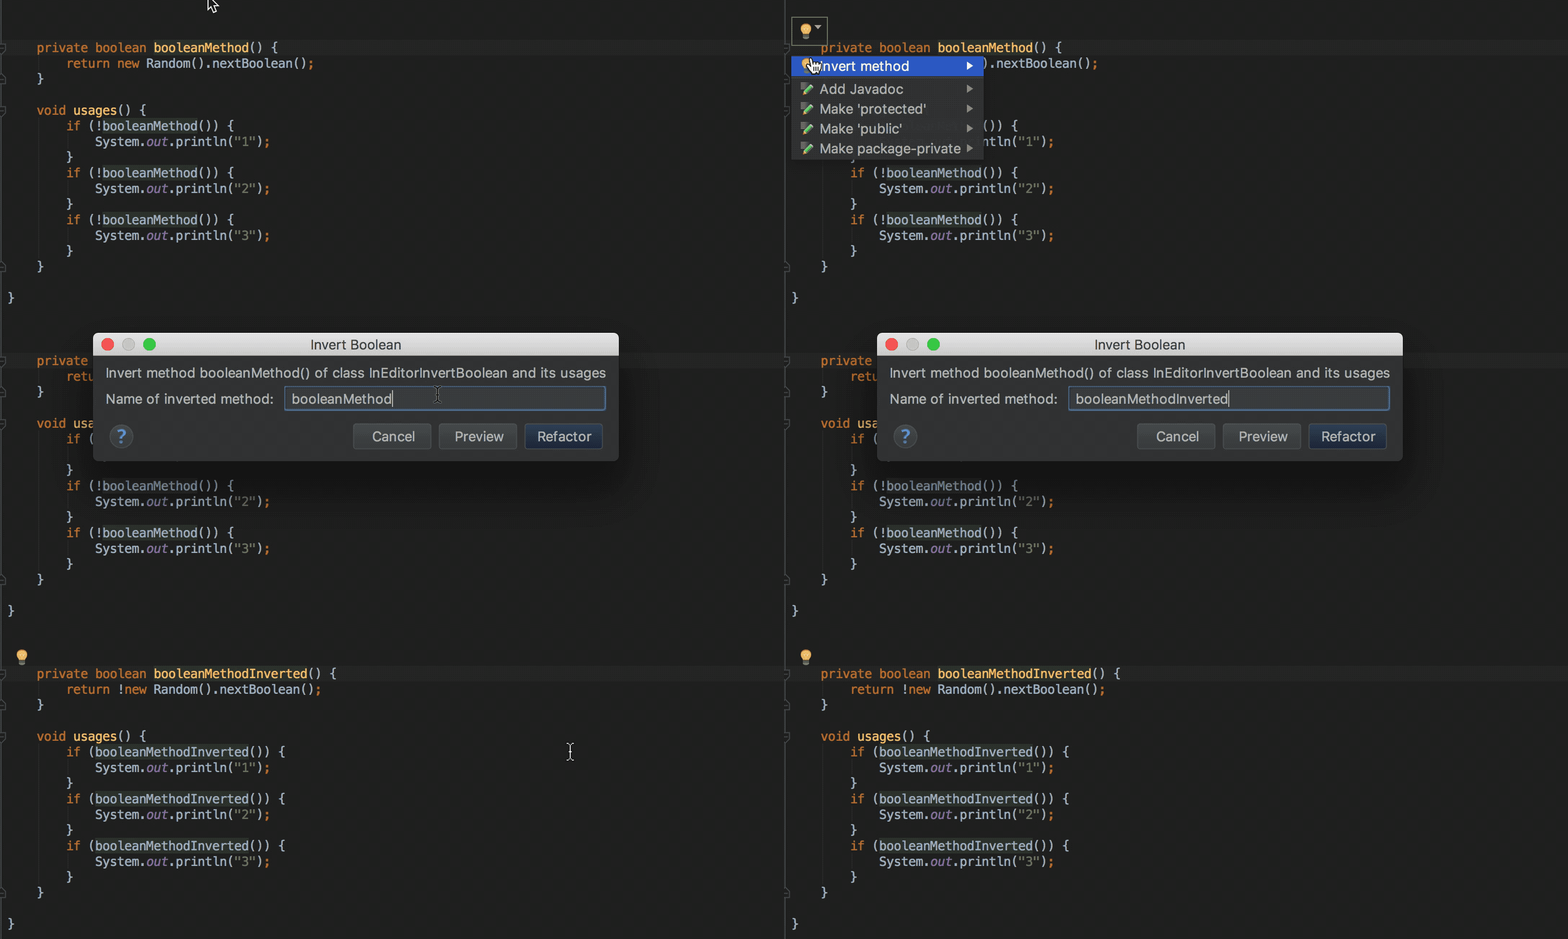
The inspection for Inverting a boolean method is now available on-the-fly.
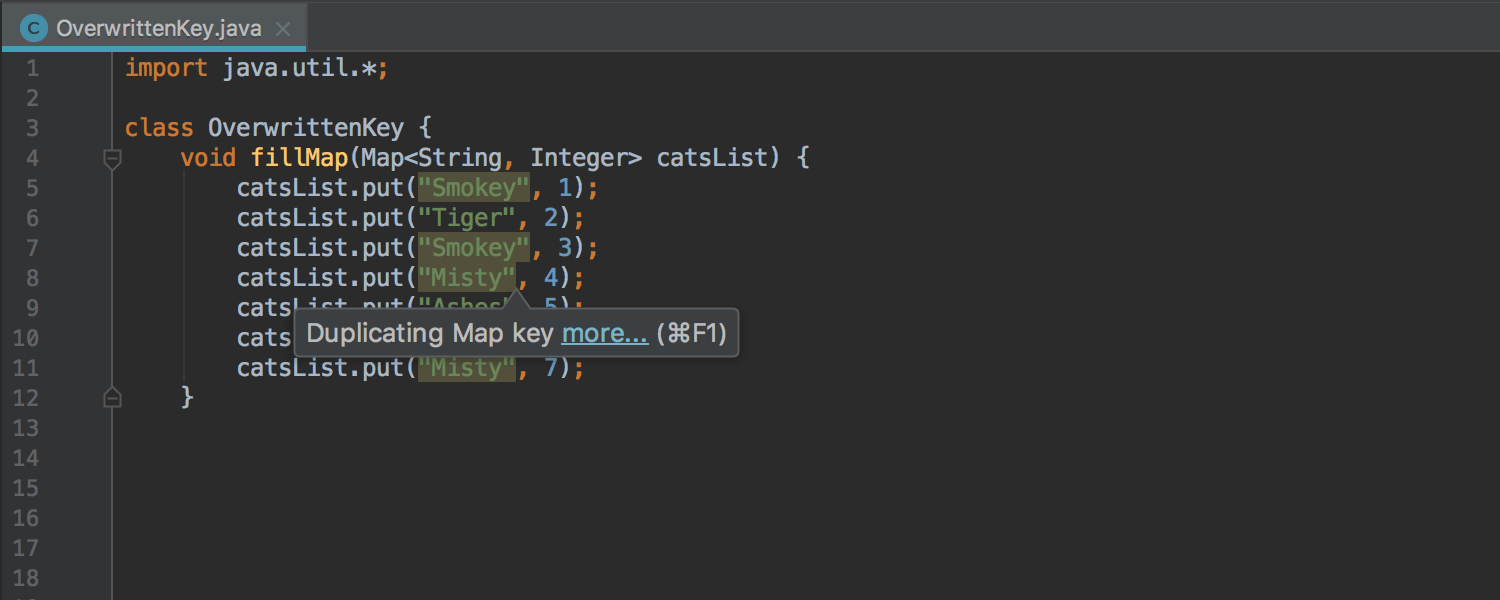
The IDE now detects duplicating Map keys and duplicating Set elements.
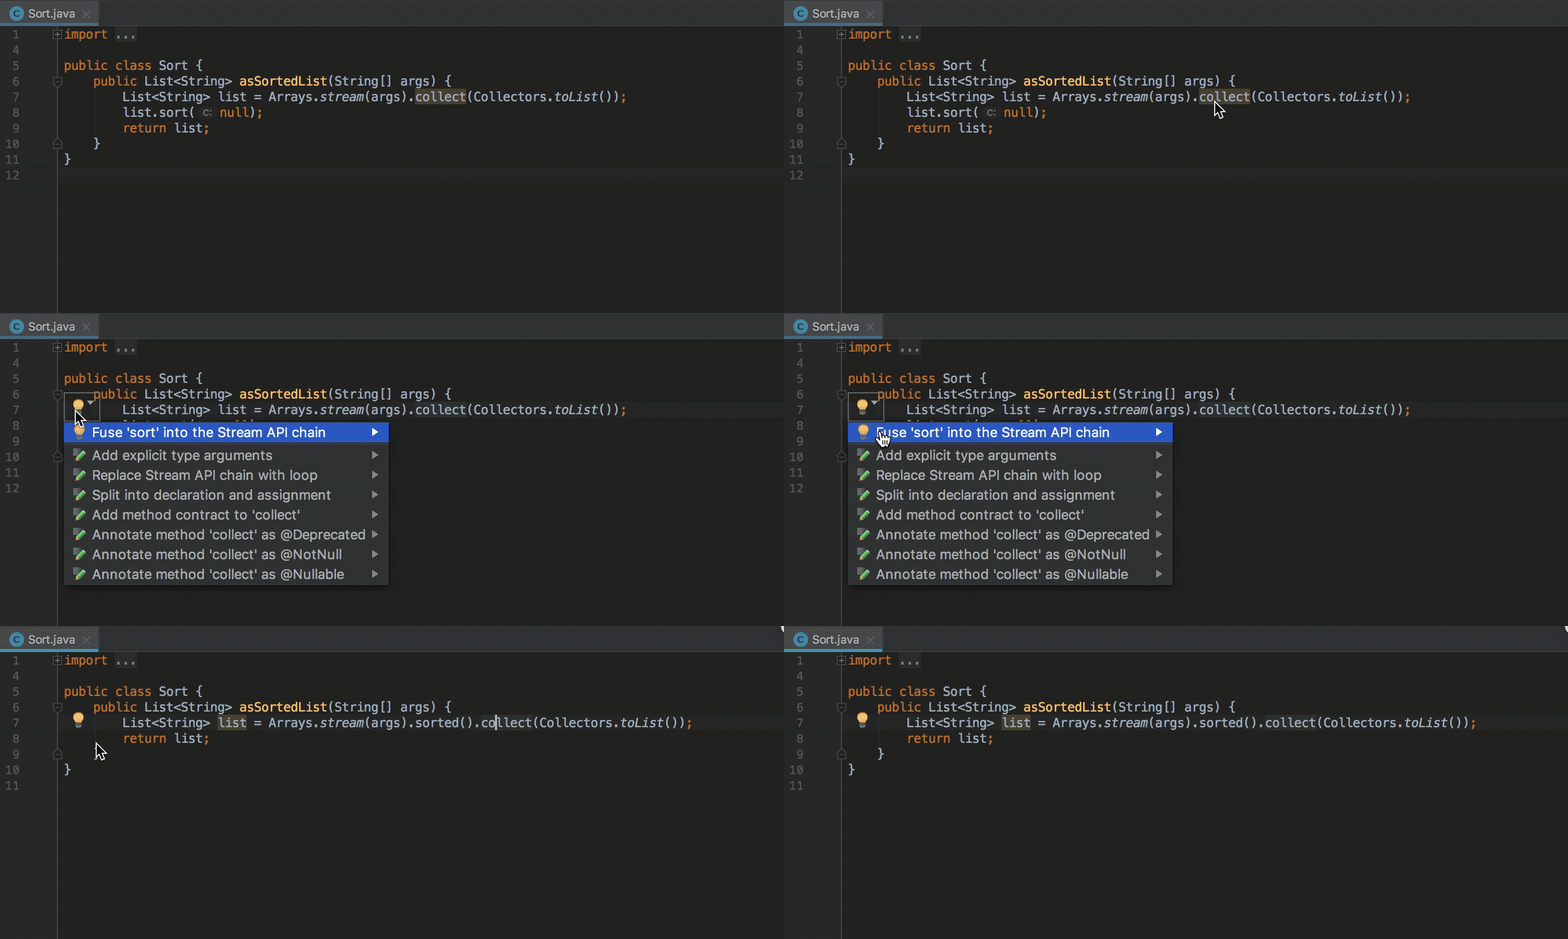
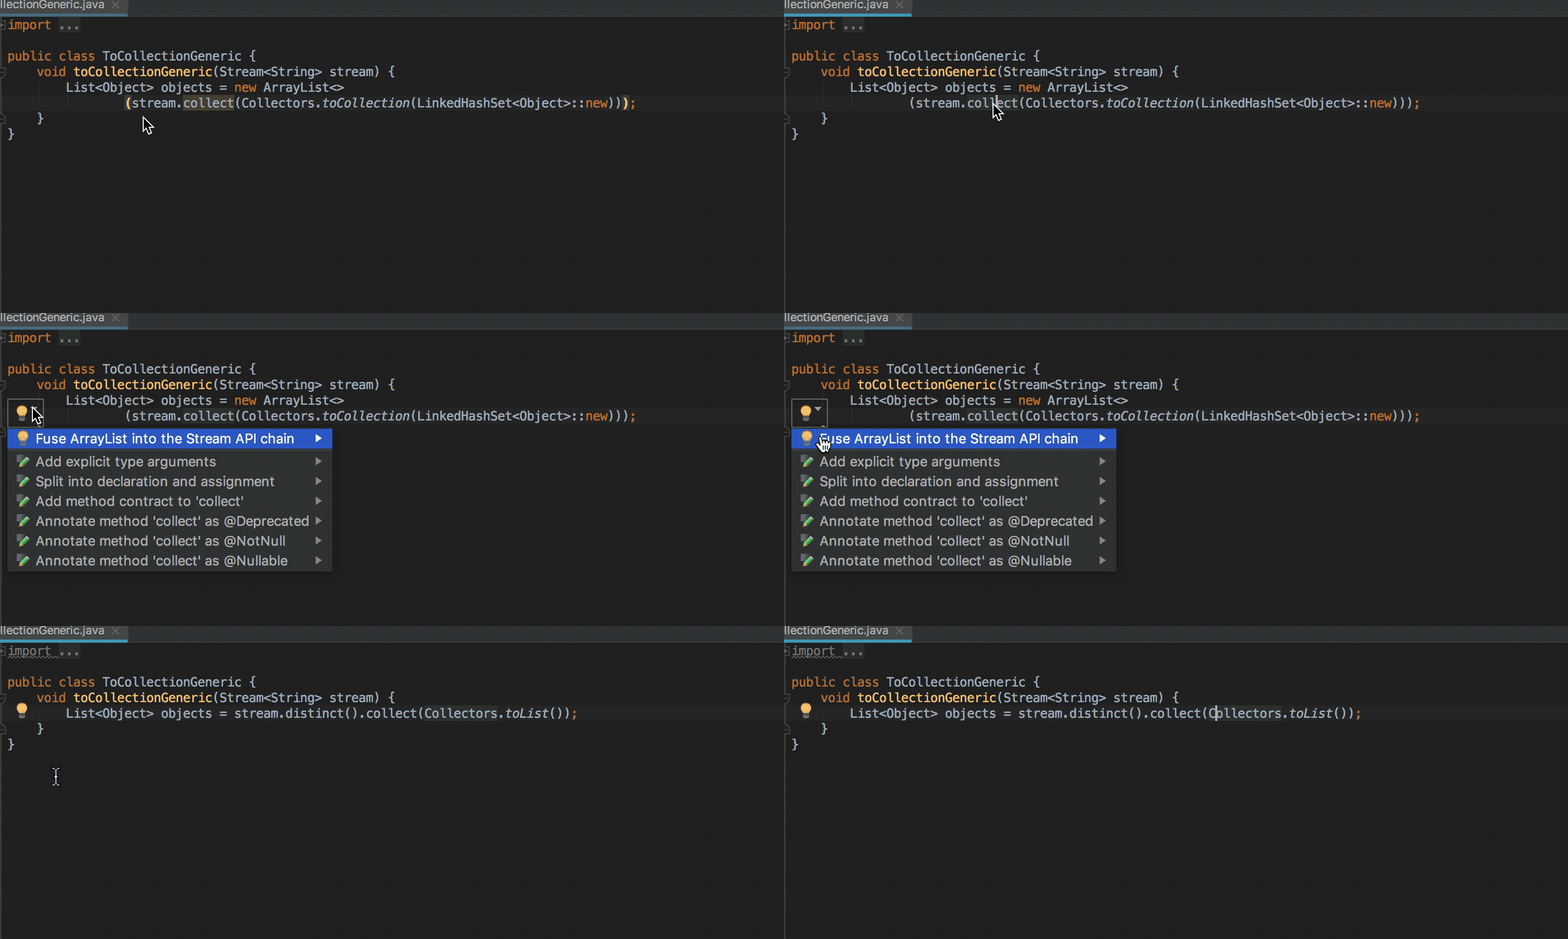
You will also find new inspections for the Fuse Stream API call chain:
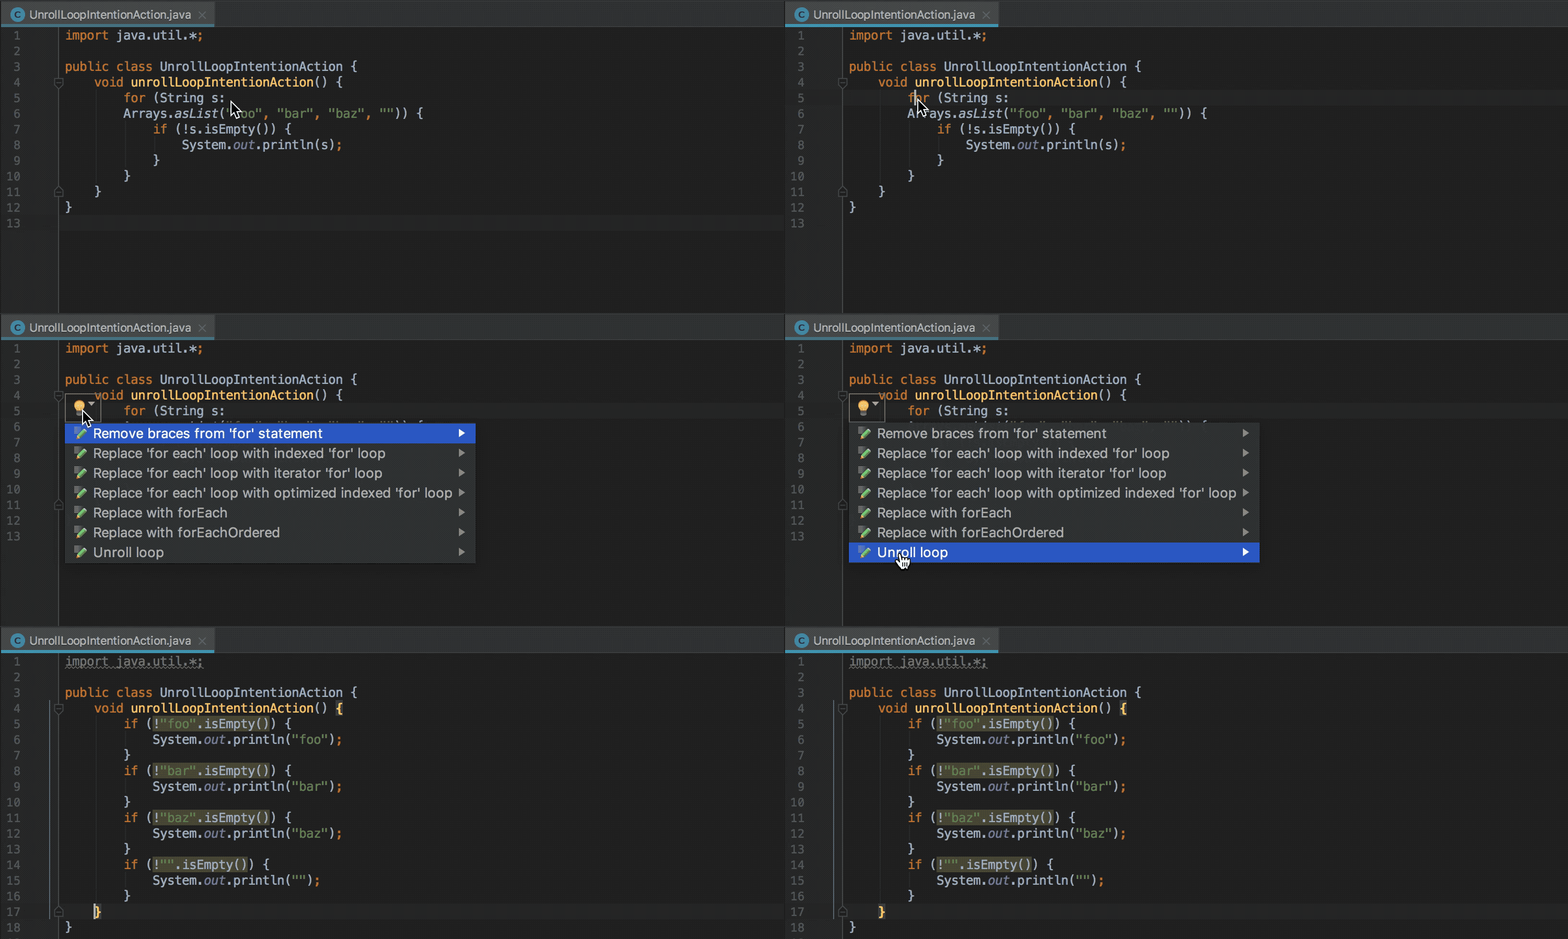
There’s a new intention action called Unroll loop:
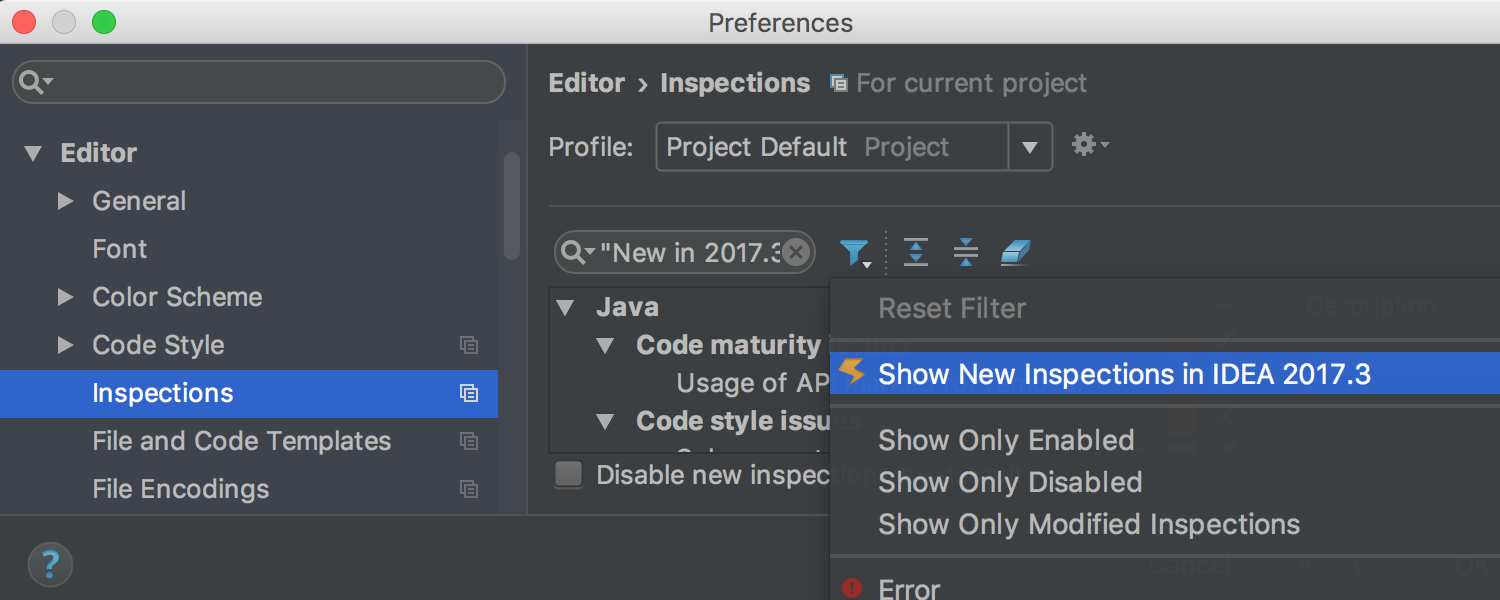
Note that there’s an easy way to find all the new inspections. Open the Settings/Preferences dialog select Editor | Inspections, and click on the Filter icon.
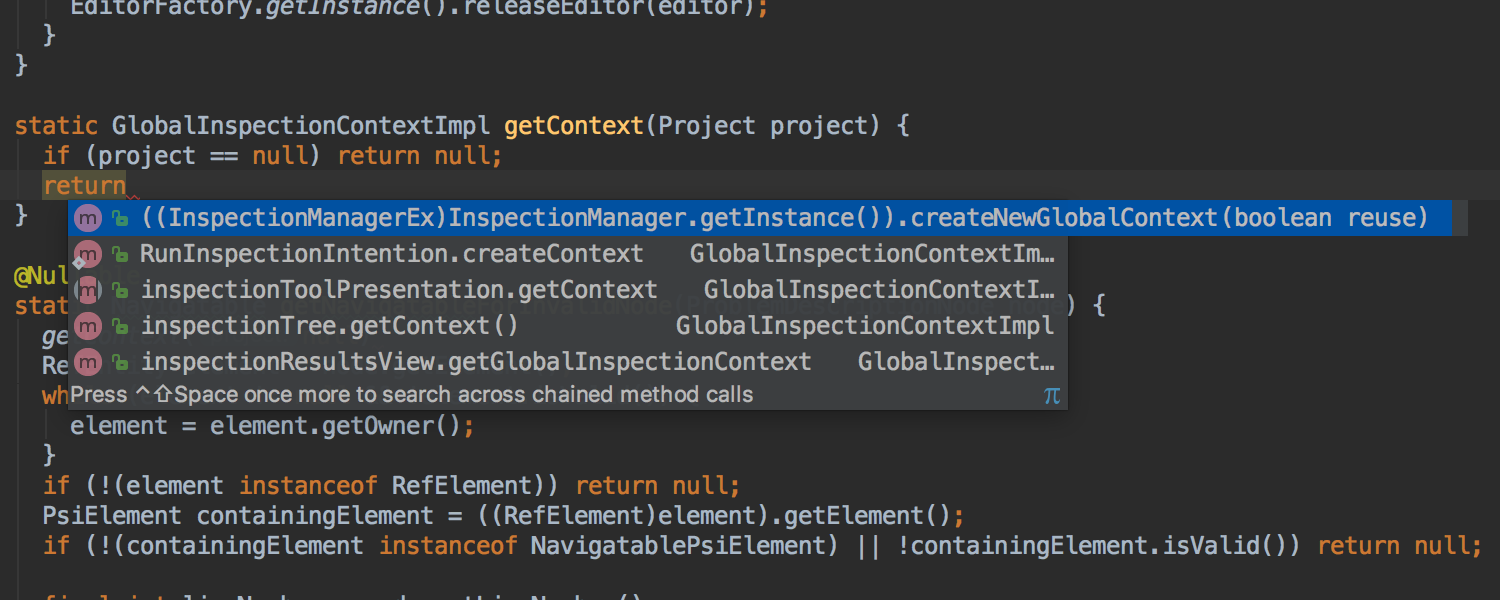
Smart Completion in IntelliJ IDEA 2017.3 is aware of type casts and uses them to suggest chains of method calls.
JVM Debugger
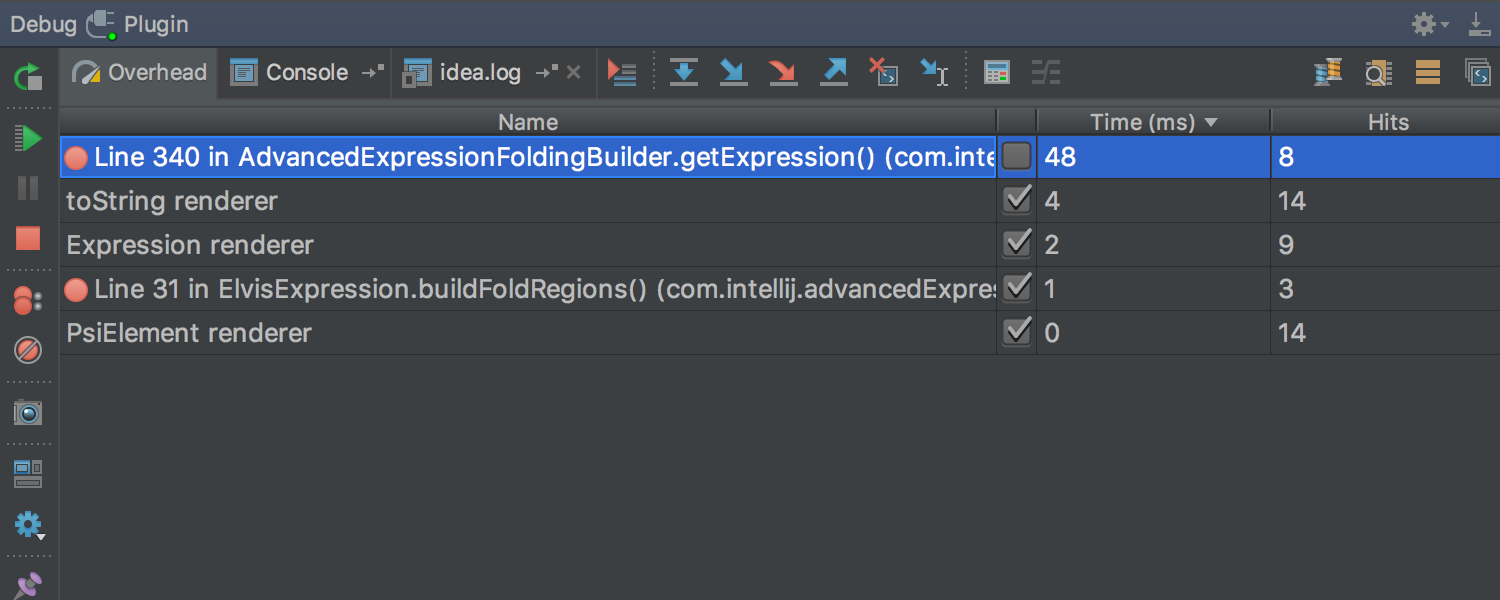
There’s a new Overhead tab in the Debugger tool window. It displays the overhead added either when stepping over the code or when Data Renderers evaluate values.
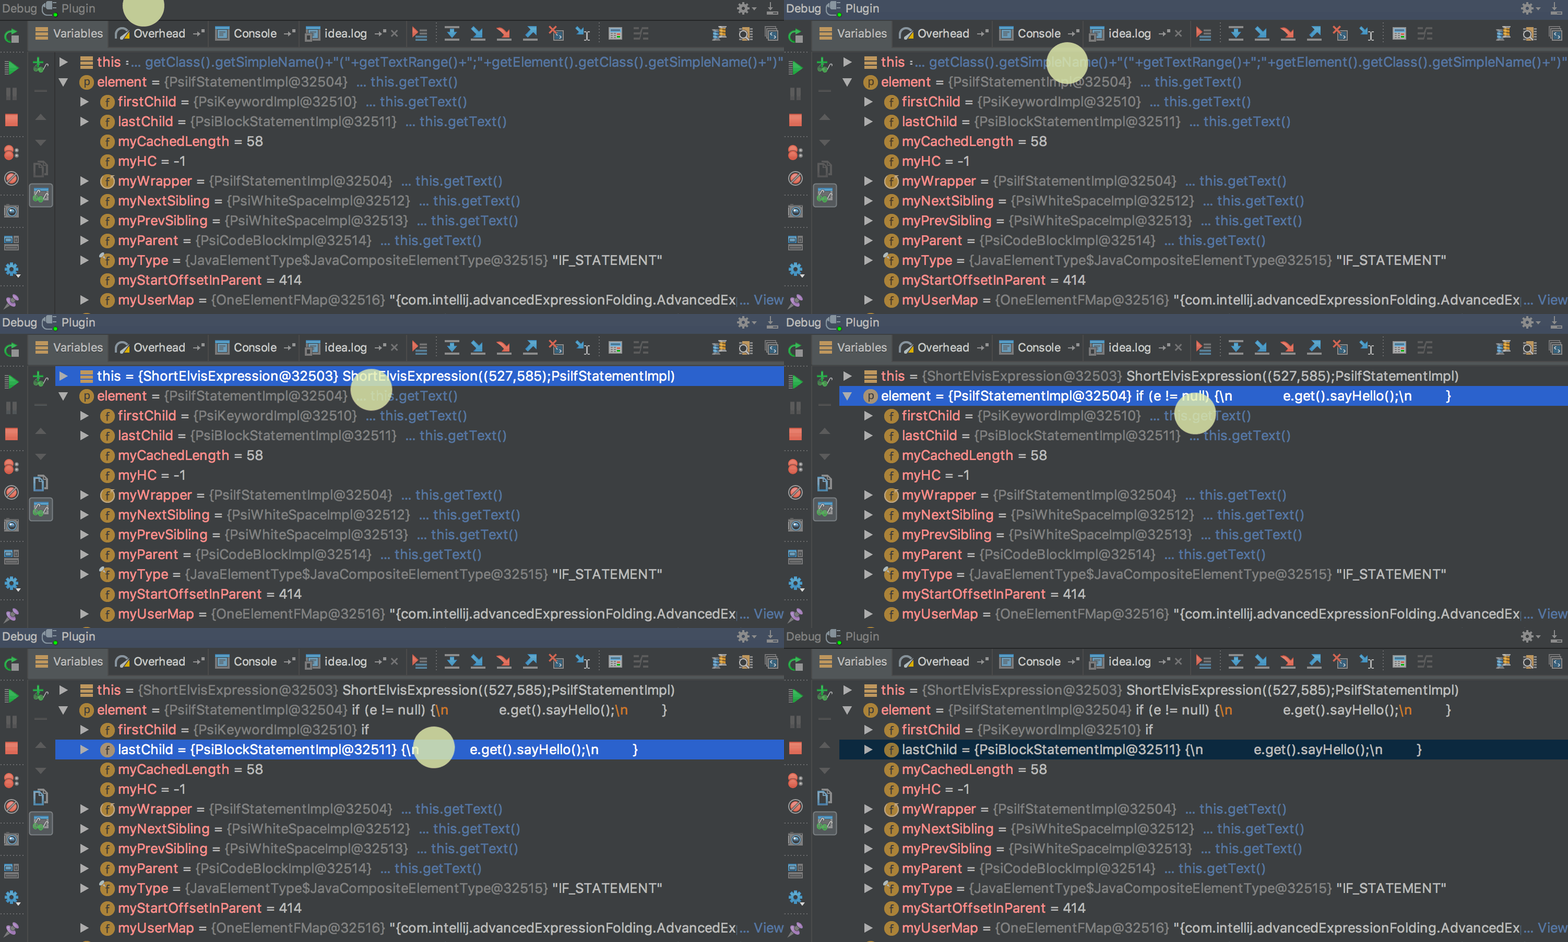
One more enhancement to the debugger is the new On-demand Data Renderers feature that helps reduce overhead. Now, the evaluation of the values in Variables, Watches, and other places can be done on demand. Simply click on them when needed, instead of having them evaluated automatically:
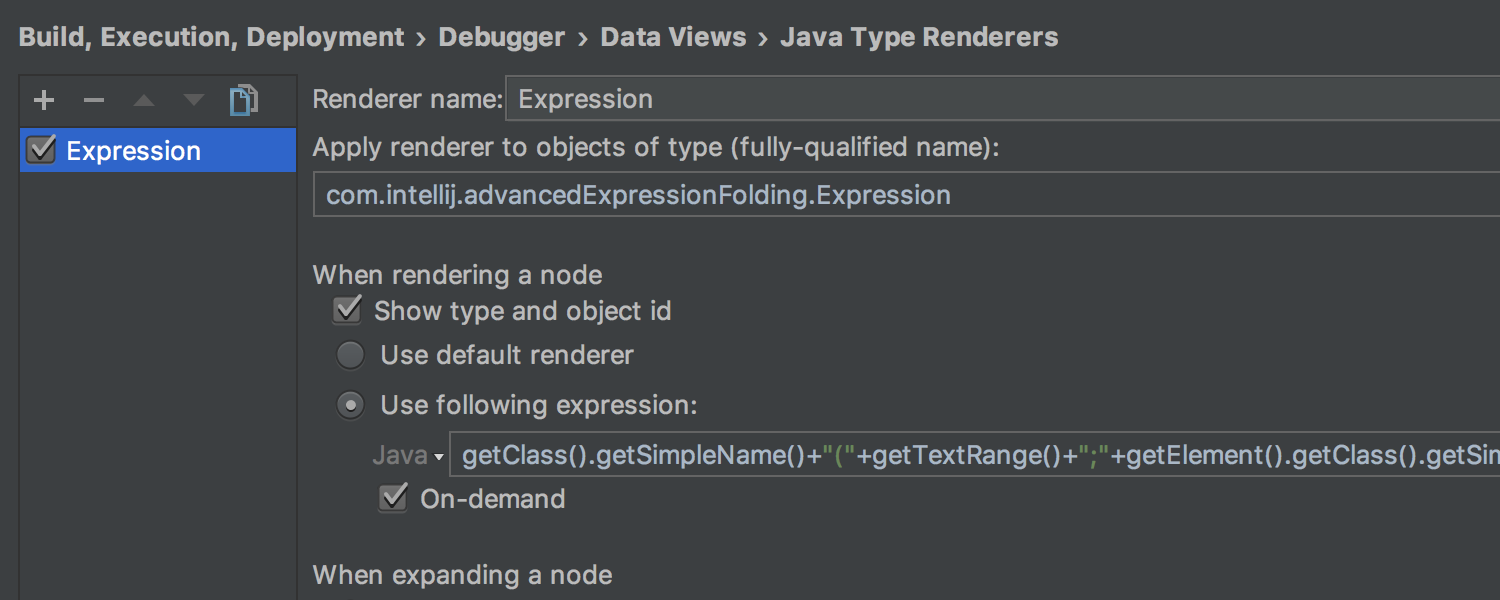
To enable On-demand Data Renderers for each renderer, go to the Data Renderers settings page.
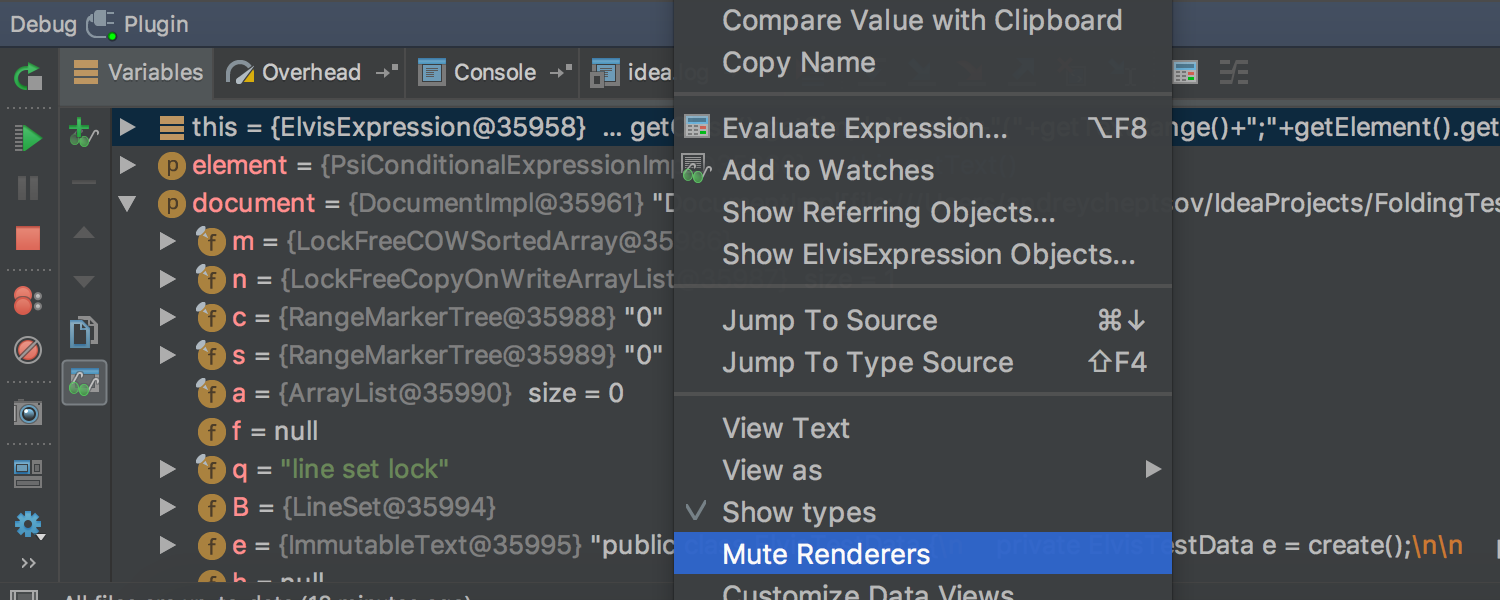
In addition, a renderer can be “muted” from the context menu.
Async stacktraces
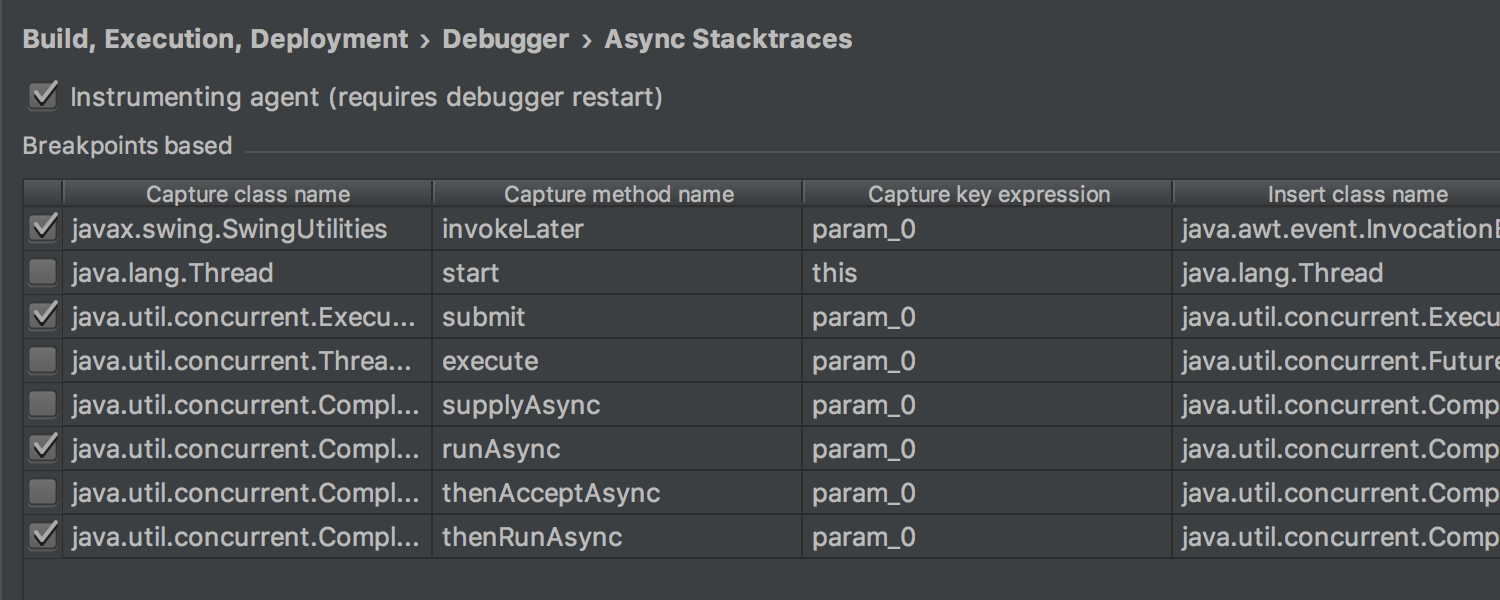
The Async Stacktraces feature shows the combined stack traces of all threads. IntelliJ IDEA 2017.3 extends the Async Stacktraces feature with a new Instrumenting agent, which provides almost the same functionality and works out of the box as common capture points are built-in. The new Instrumenting agent causes very low overhead. The Instrumenting agent option is enabled by default.
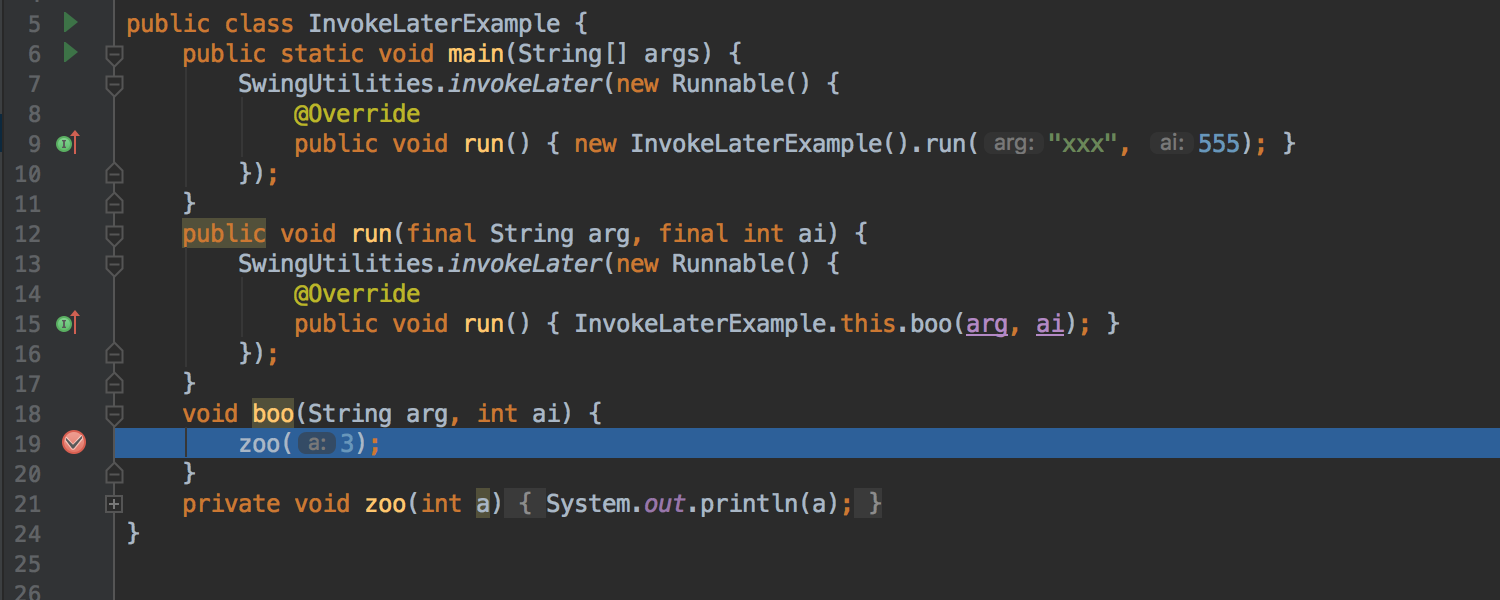
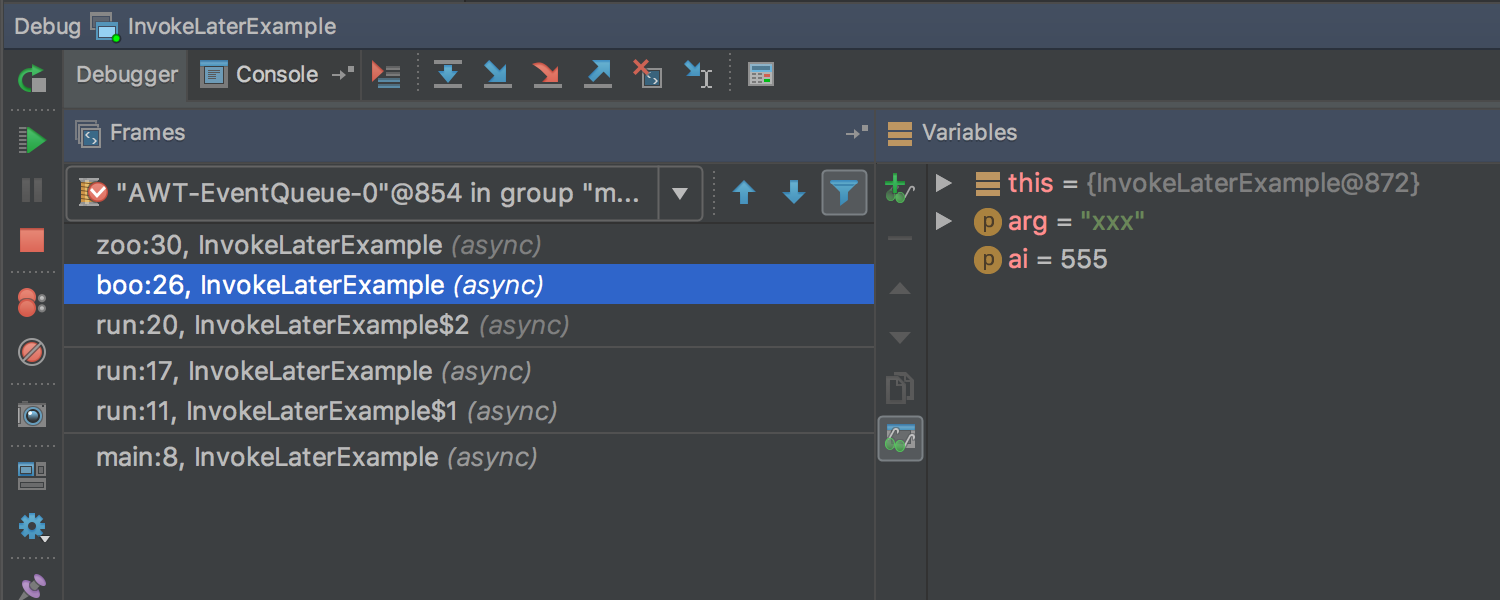
For this code example, we’ll have the following stack trace:
Java Stream Debugger
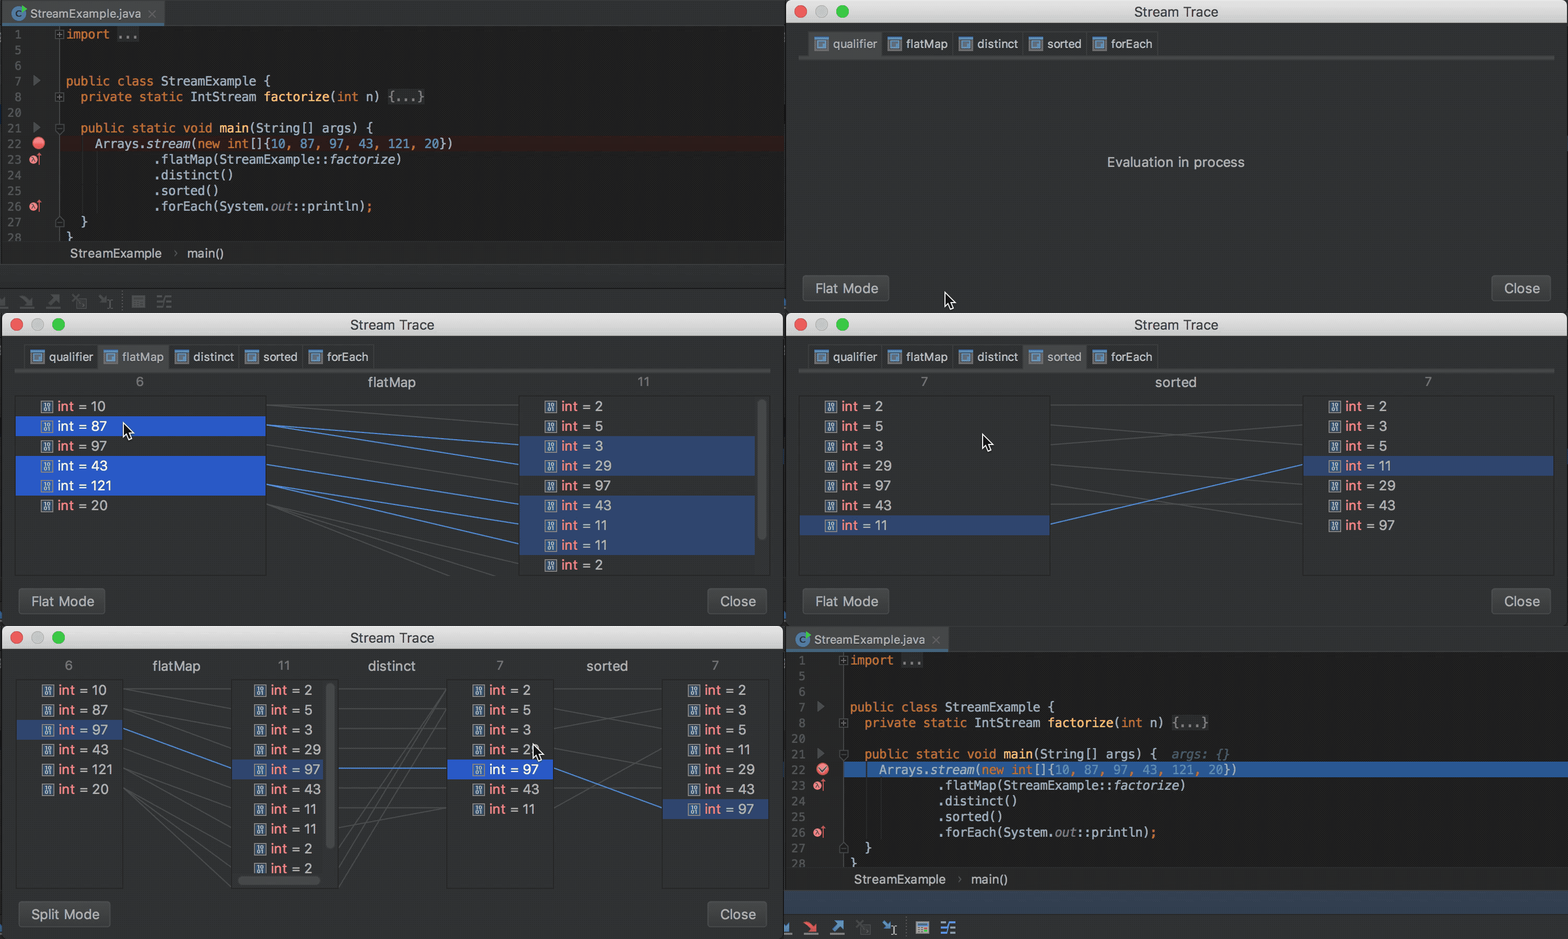
The Java Stream Debugger plugin, which visualizes Java Stream operations, is built into IntelliJ IDEA 2017.3. The new functionality is available inside the Debugger tool window (click the Trace Current Stream Chain button). This plugin evaluates the current data stream and presents a visual representation of what exactly happens to each element, from the first call to the last.
Use the Split Mode / Flat Mode button to toggle the way operations are displayed: all at once or individually.
Gradle
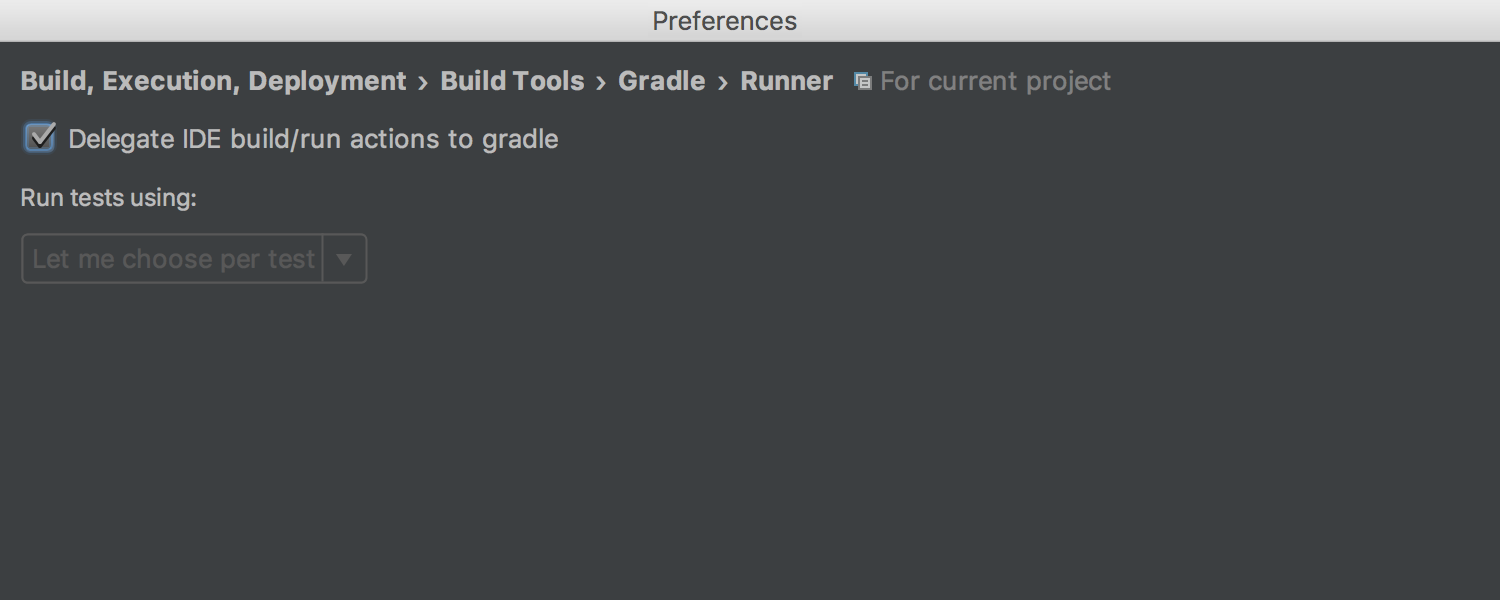
IntelliJ IDEA 2017.3 lets you run tests with coverage with Gradle Test Runner. You can run tests with coverage even if you select the option Delegate IDE build/run action to gradle.
In the Preferences window, you can enable the option Let me choose per test to choose how to run your tests with coverage per test: with the platform test runner, or with the gradle test runner. You can select the test runner type from the editor.
You can also run tests with coverage from the editor, even if you delegate a test to Gradle.
Build tool window
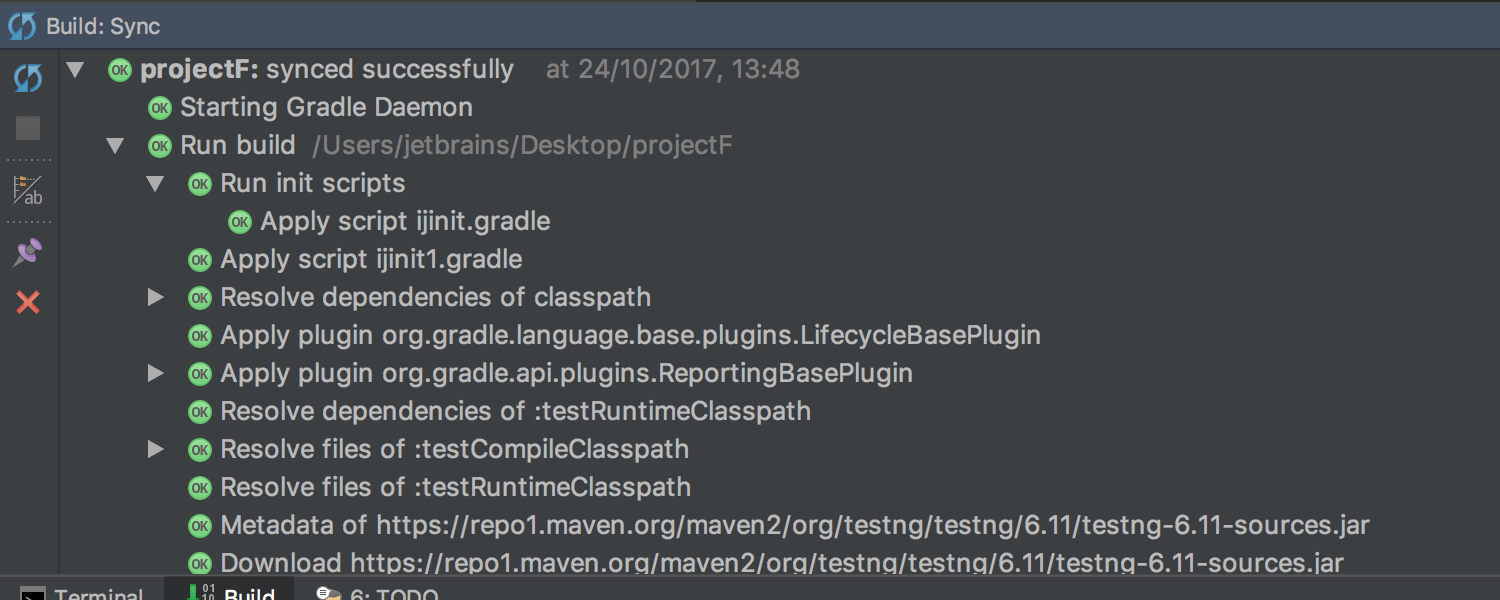
IntelliJ IDEA 2017.3 introduces a new Build tool window as a single place to view all of the output related to a Gradle build. Previously, the output of a Gradle build was displayed in different places depending on the context, including the Run or Messages windows. In some cases, it was even hidden as a background process.
If a project is set to auto-import, it will be automatically rebuilt when there are changes that affect a Gradle build. The new Build tool window shows the progress of this process as well.
Even when you enable Delegate IDE build/run actions to gradle, the build output will still be displayed in the Build tool window.
Run Dashboard
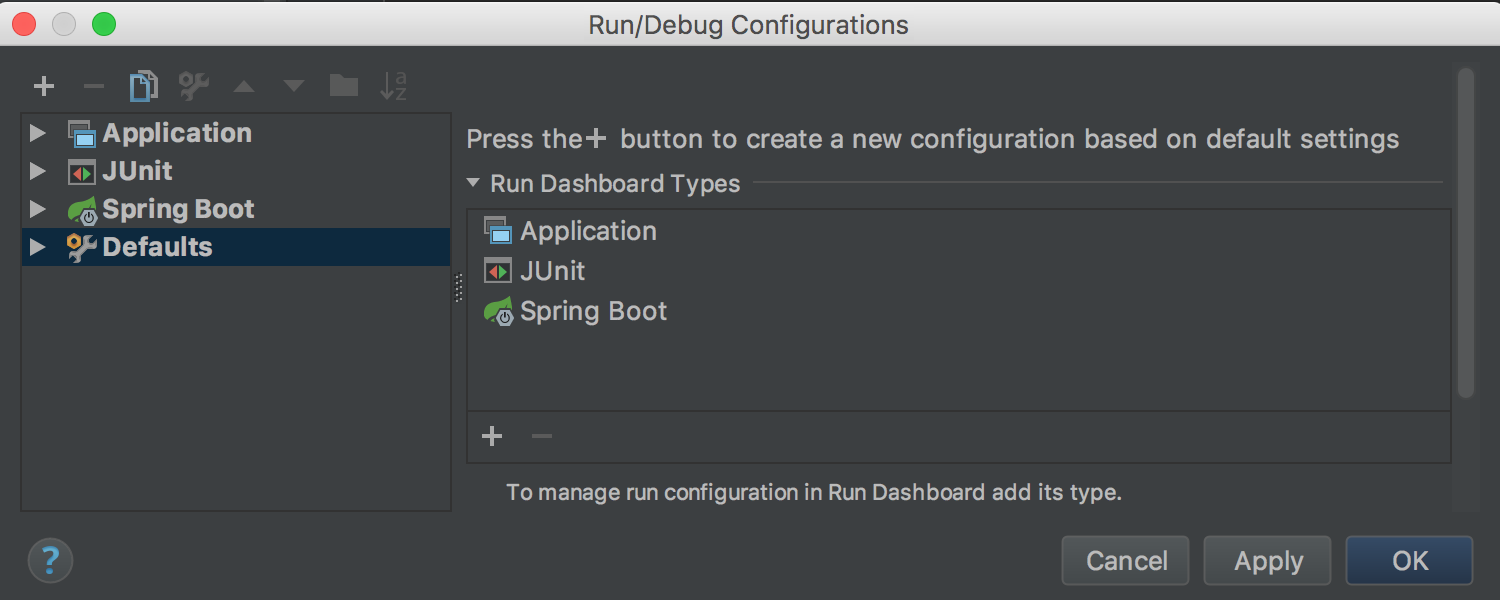
In IntelliJ IDEA 2017.2, we introduced the Run Dashboard for Spring Boot applications. We are extending this functionality in v2017.3, so that the IDE now lets you add different types of run configurations to the Run Dashboard. In the Run/Debug Configurations window, you can add the required run configuration to the Run Dashboard.
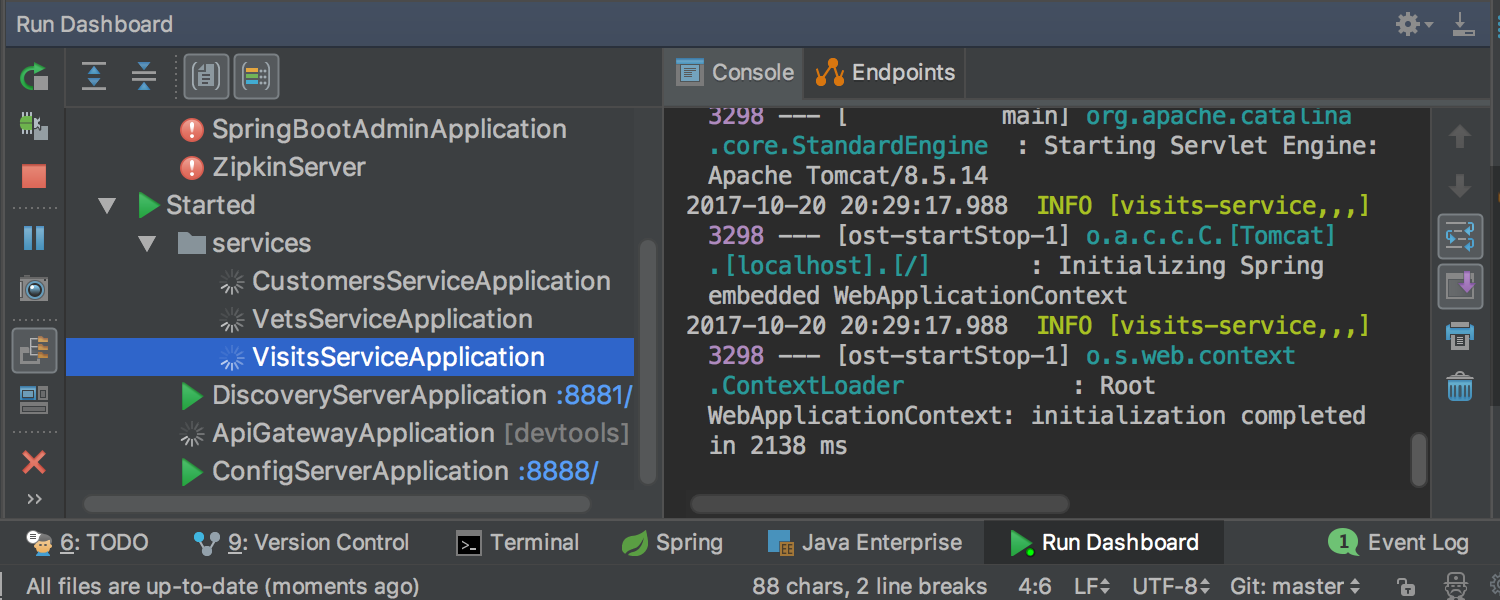
You can manage multiple run configurations at once by using the Run Dashboard.
The Run Dashboard toolbar lets you rerun, stop, pause, or terminate an application. The right-hand side shows application-specific information.
Command line shortener
IntelliJ IDEA 2017.3 introduces a configurable command line shortener – a convenient new way to specify a method used to shorten the command line for each configuration.
Look in the Run/Debug Configuration dialog for a new field called Shorten command line.
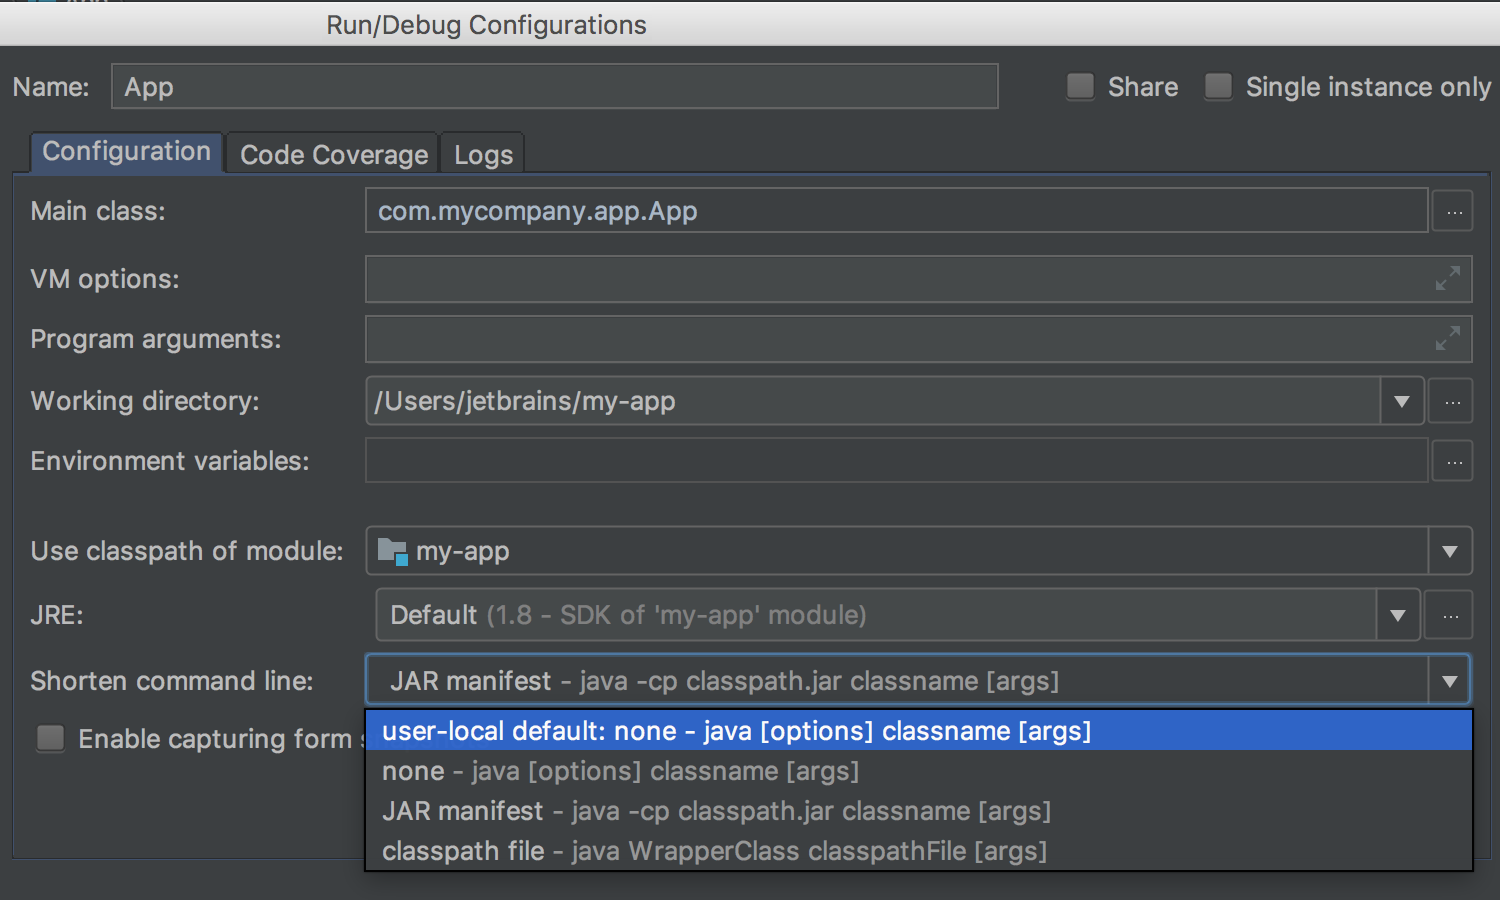
You can set the default way to shorten the command line and use it as a template for future configurations. IntelliJ IDEA 2017.3 also enables you to share your configuration with your colleagues.
You can also preview the full command line if a long classpath was shortened via a temporary classpath.jar (the JAR Manifest option in the Run/Debug Configuration dialog).
Project configuration
There are also new improvements for unloaded modules. When you update a project that has unloaded modules via a VCS, the IDE will analyze all the dependencies between the modules. If newly added modules depend on the existing ones, they will be marked as loaded; otherwise, as unloaded.
Also, the IDE now checks that unloaded modules compile successfully before a commit.
In IntelliJ IDEA 2017.3, grouping by qualified module names is enabled by default (if there are no module groups configured in your current project).
Java EE 8
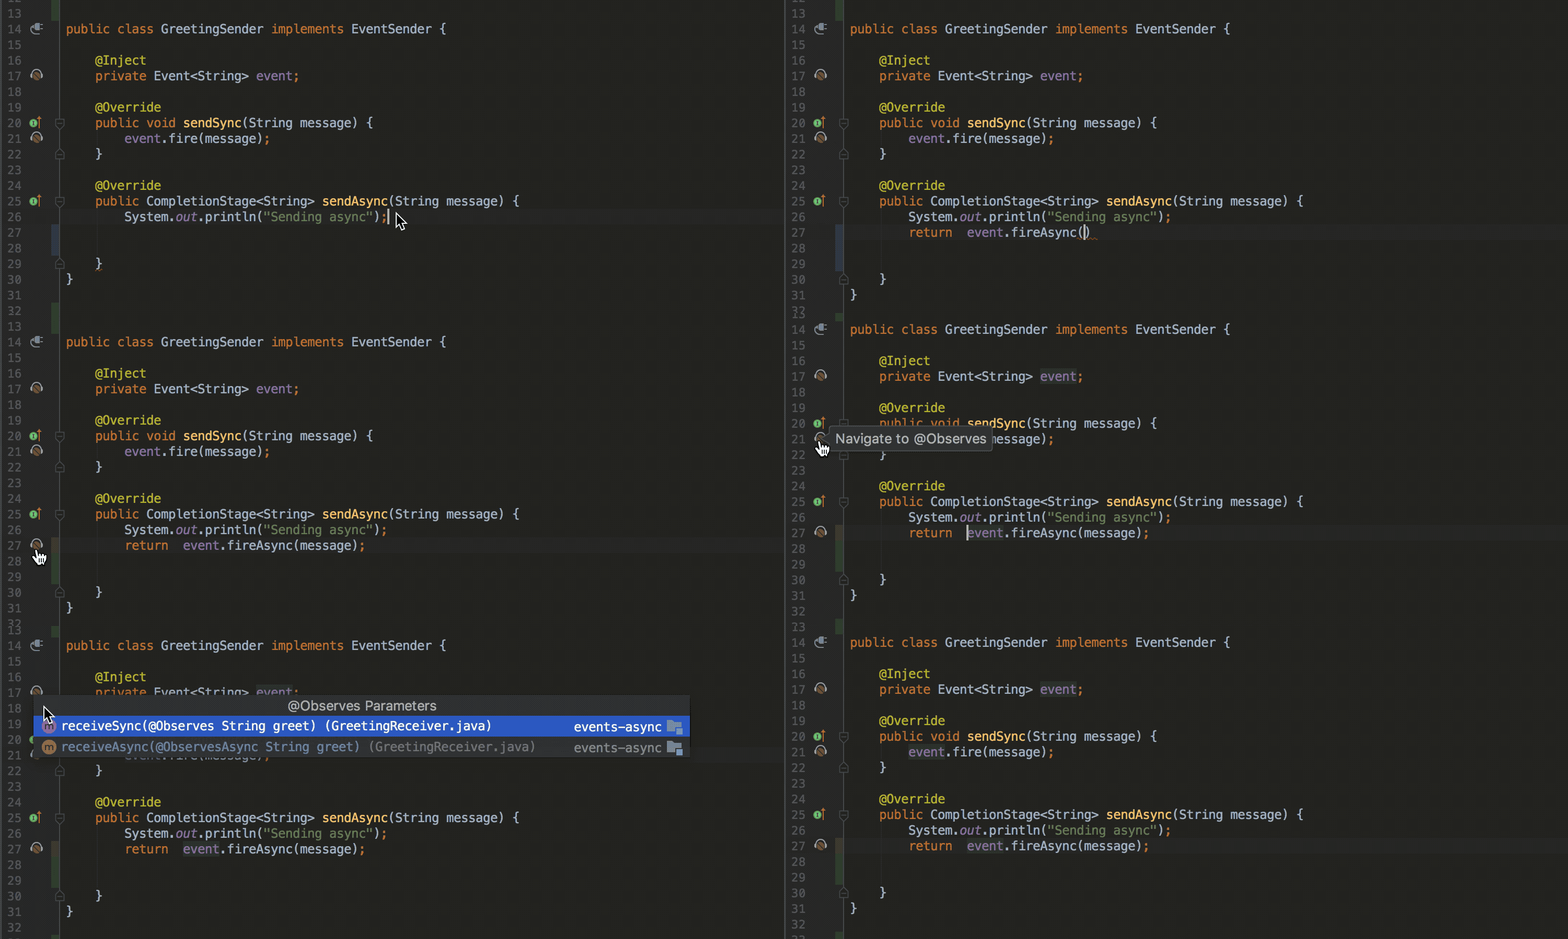
IntelliJ IDEA 2017.3 expands its support for the key features in Java EE 8. The IDE now supports Asynchronous CDI Events, and allows you to easily navigate between the place where the event was fired and where this event was received. This is done by using icons in the gutter.
Spring and Spring Boot
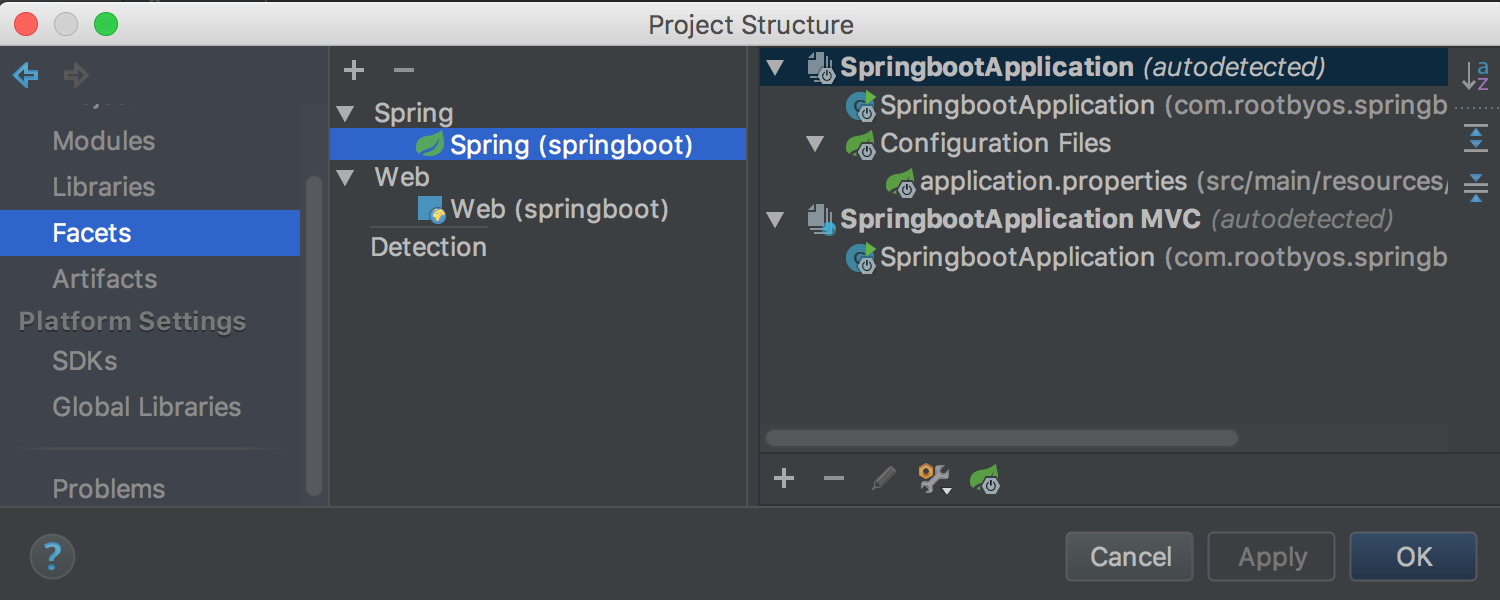
The IDE now automatically detects the Spring configuration in your code. It will automatically create a Spring facet for your project, or will alert you if any configuration is missing.
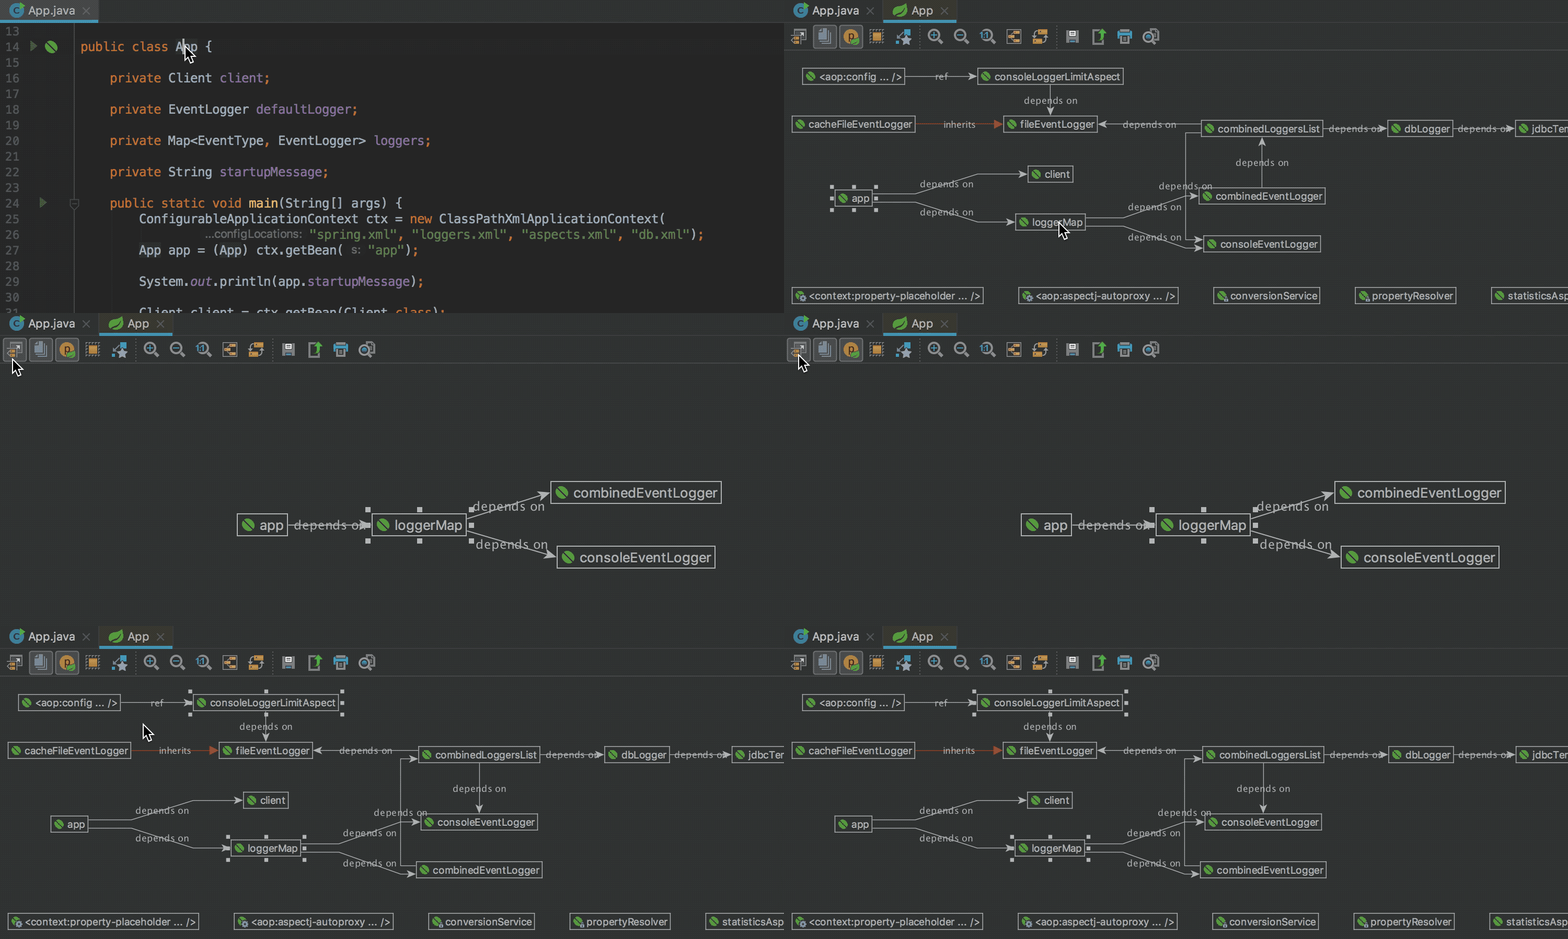
Also, the Spring Beans Dependencies diagram has been extended with a new Neighborhood Mode feature, which lets you choose only the necessary beans and only view their dependencies.
For better readability, you can easily switch to the Borderless View.
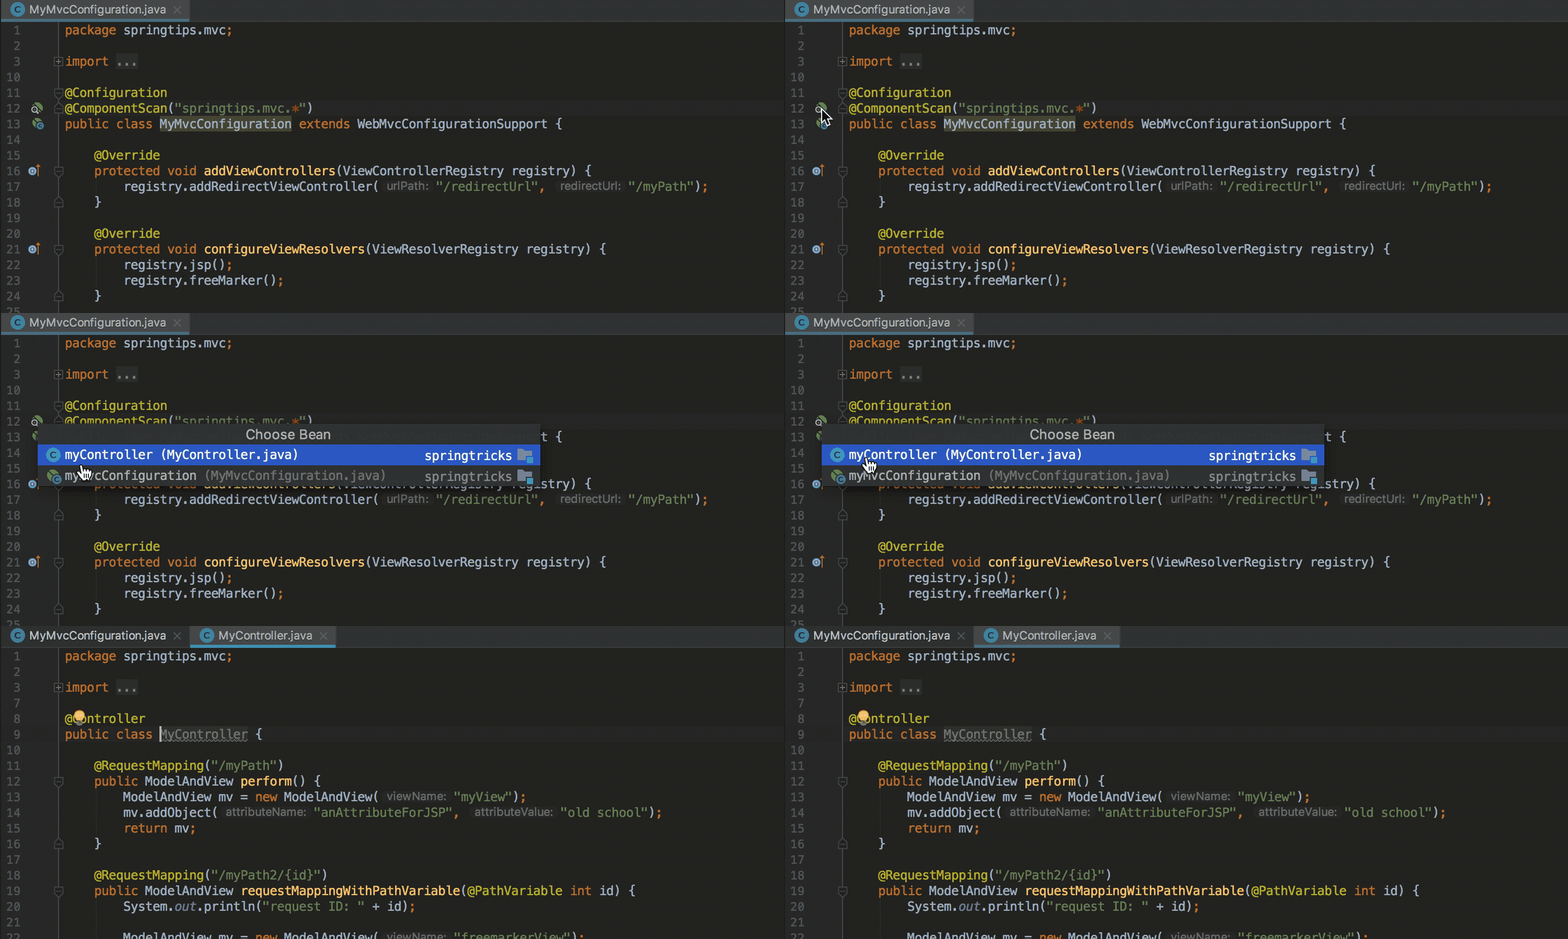
For Spring Boot MVC web applications, the IDE now automatically detects an MVC context. A Web Facet and a Spring Boot MVC Context will be set up automatically.
For Spring Boot MVC web applications, the IDE now fully supports all the major features including auto-completion, syntax highlighting, and navigation to related views.
Support for Spring Boot 2 is now available.
REST client
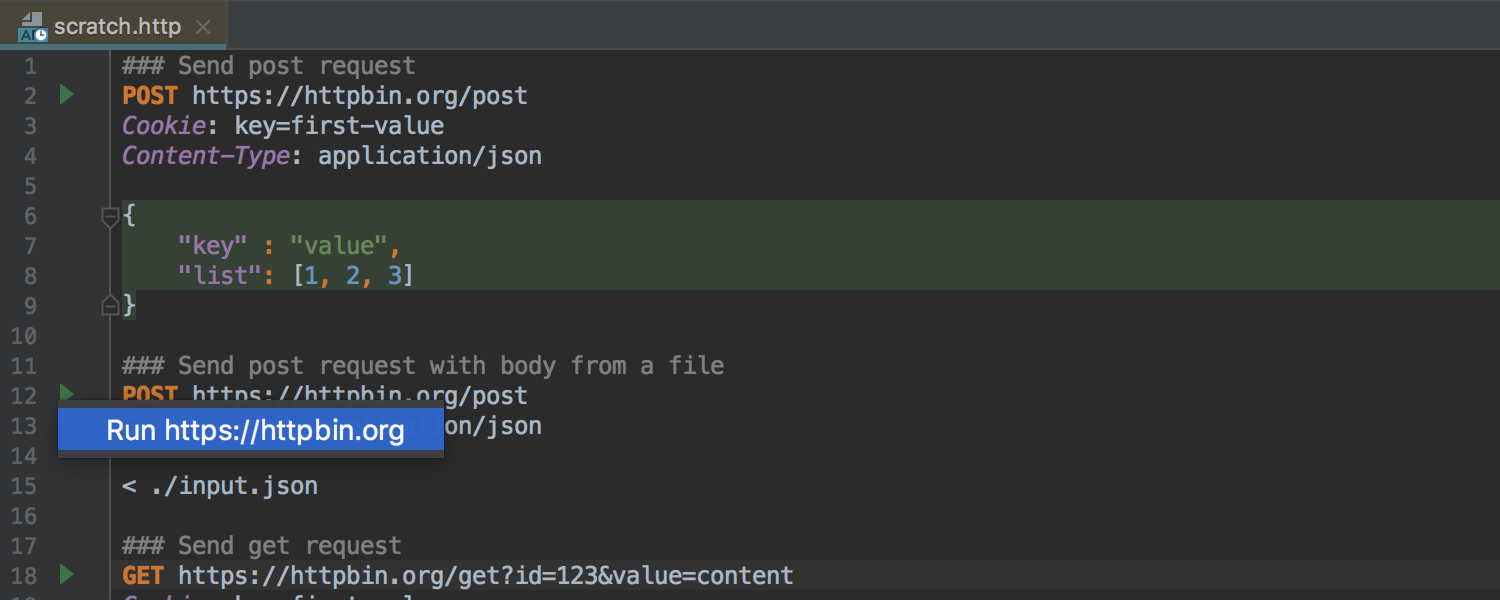
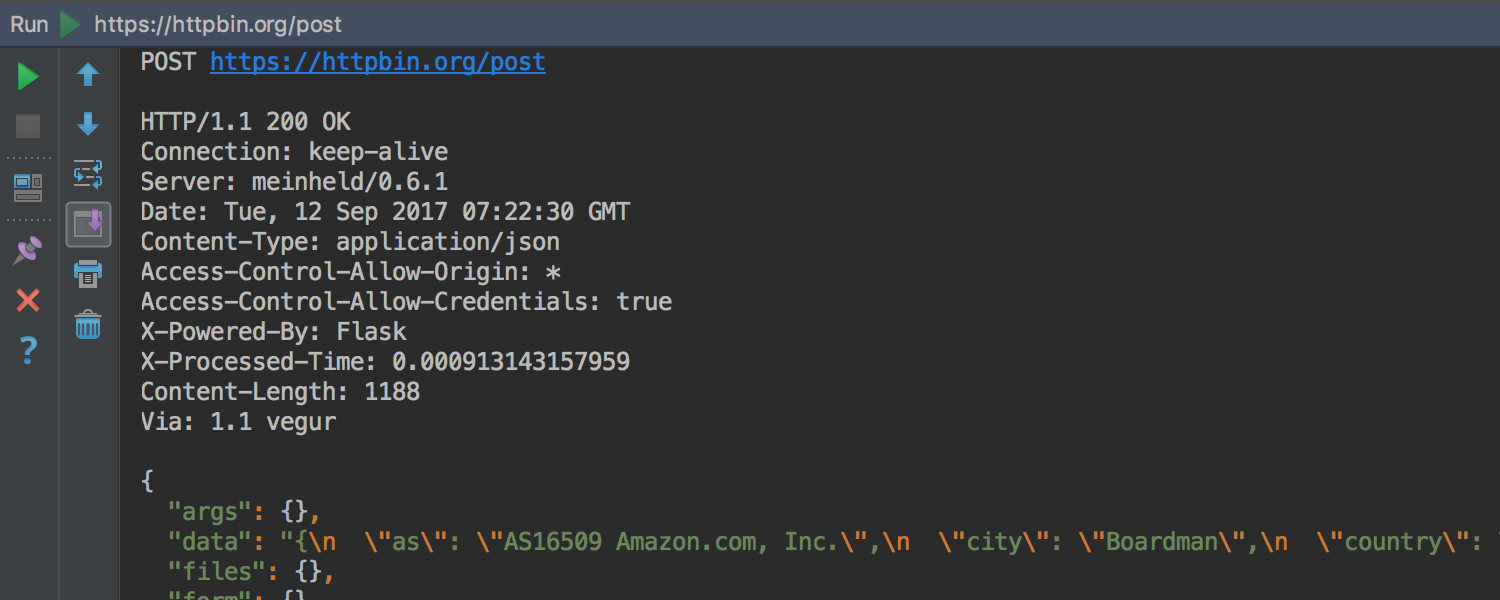
IntelliJ IDEA 2017.3 introduces a brand new editor-based REST client. To start using the new REST client, create a scratch file with the .http extension.
Use the icon on the left-hand panel of the editor to run a request:
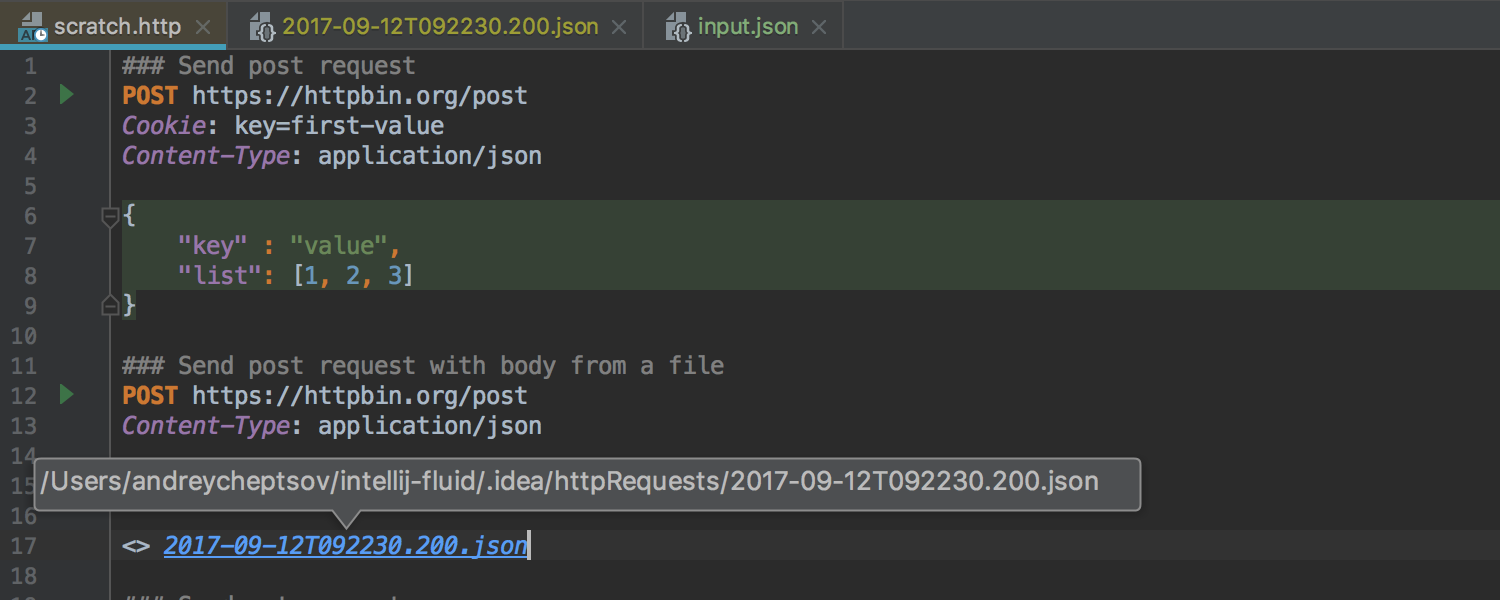
For easier navigation, the IDE will add a link to the request results.
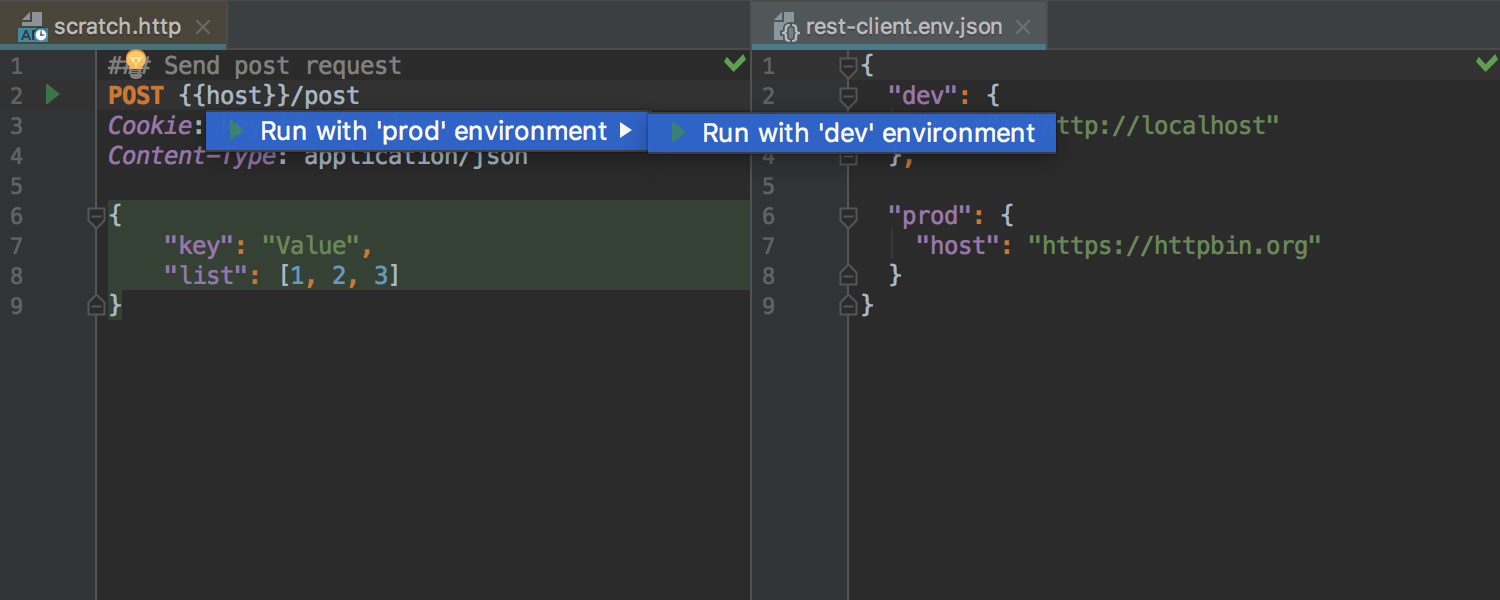
In the new editor-based REST client, you can define the context for executing a request. Create a rest-client.env.json file inside your project and define an environment with variables. Once the environment variables are defined, you can easily switch between different environments such as production, testing, and development.
VCS
For Git integration, IntelliJ IDEA 2017.3 provides faster branch operations, especially for big projects.
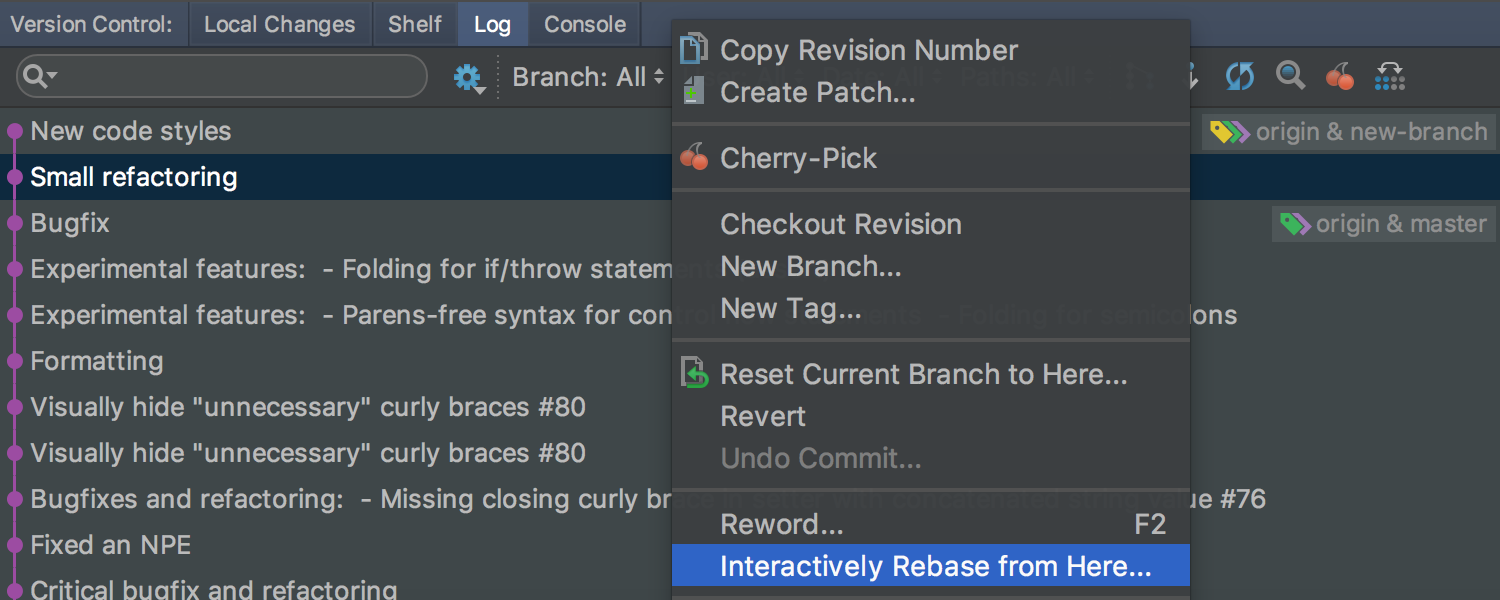
The Log viewer now offers a new action called Interactively Rebase from Here.
To learn more about all the exciting new features that v2017.3 offers for version control tools, click here.
Settings synchronization
IntelliJ IDEA 2017.3 ensures better synchronization of your settings across different installations. It provides a more convenient method for storing your settings, utilizing a JetBrains repository to store items such as the UI theme, colors, and fonts settings, and so on. You can apply these settings to all of your IDE instances using your JetBrains Account (JBA).
You can also synchronize the list of installed and enabled and disabled plugins.
The settings you can sync include:
- Look And Feel (Preferences | Appearance & Behavior | Appearance | Theme)
- Keymap (Preferences | Keymap)
- Color Scheme (Preferences | Editor | Color Scheme)
- General Settings (Preferences | Appearance & Behavior | System Settings)
- UI Settings (Preferences | Appearance & Behavior | Appearance)
- Menus and Toolbars (Preferences | Appearance & Behavior | Menus and Toolbars)
- ProjectView Settings (Project Tool Window – syncs only IDE settings, all other settings are automatically saved in a project)
- Editor Settings (Preferences | Editor | General)
- Code Completion (Preferences | Editor | General | Code Completion)
- Parameter Name Hints (Preferences | Editor | General)
- Live Templates (Preferences | Editor | Live Templates)
- Code Style Schemes (Preferences | Editor | Code Style)Plugins (Preferences | Plugins)
In order to test the new settings synchronization functionality before its release, you need to activate the IDE Settings Sync plugin. You can learn how to activate it in this blog post.
To learn about the enhancements for JavaScript and TypeScript, please take a look at the Webstorm blog. Make sure to check the improvements affecting database tools and SQL support in the DataGrip blog.
Last but not least, here’s a list of some notable bugfixes in IntelliJ IDEA 2017.3:
JRE-509 JDK was updated to 1.8.0_152-release-1024-b06 x86_64: the HiDPI mode fallback logic was removed
IDEA-26988 the IDEA Coverage ignores empty private Constructors of Utility Classes
Two new options added in the Coverage settings:
to exclude implicit constructors from the coverage
to exclude empty private constructors coverage data in classes when all of the other methods are static
IDEA-101502 Dir diff: Files with different line separators are shown as different, but they are actually the same.
IDEA-178764 The pull request fails after the pull request creation
IDEA-170103 The Find in Path dialog don’t close (2017.1 version, Ubuntu 16.04)
IDEA-121059 JPA2.1: Error “Element entity-mapping must be declared” in the mapping file in case of standard schema location.
IDEA-138029 Cannot index custom maven repositories provided by Bintray
IDEA-134885 Gradle plugin incorrectly adds Maven artifact dependencies when they should resolve to module dependencies.
And many more check this link
Whew, that was quite a list! To get started and discover these new features, download the preview build! Share your feedback with us via the comments below, our issue tracker or twitter.
Happy developing!

