JetBrains 3rd Annual Hackathon: New-Generation Debugger Grabs 1st Place

JetBrains 2015 Hackathon took place July 9-11 at our offices in St. Petersburg and Munich, with additional team members joining remotely. The basic idea was to have some fun and build something viable from scratch in a short time frame.
Over the designated 48 hours of the Hackathon, 57 participants worked feverishly on 21 projects; eating, talking and dreaming code. Let’s get right to the meat and potatoes and tell you about this year’s projects.
Judging
Teams were granted an extra day to prepare a 5-minute presentation of their achievements, to be shown at the big JetBrains gathering a few days later, for selecting the top projects and the winner. Winners are chosen by popular vote among JetBrainers themselves, plus a jury built up from within the company. This year, a total of $15,000 in prize money was awarded to the winning teams.
So, without further ado, here are the prize-winning projects of the 2015 JetBrains Hackathon.
Winning Hackathon Projects and Team Members
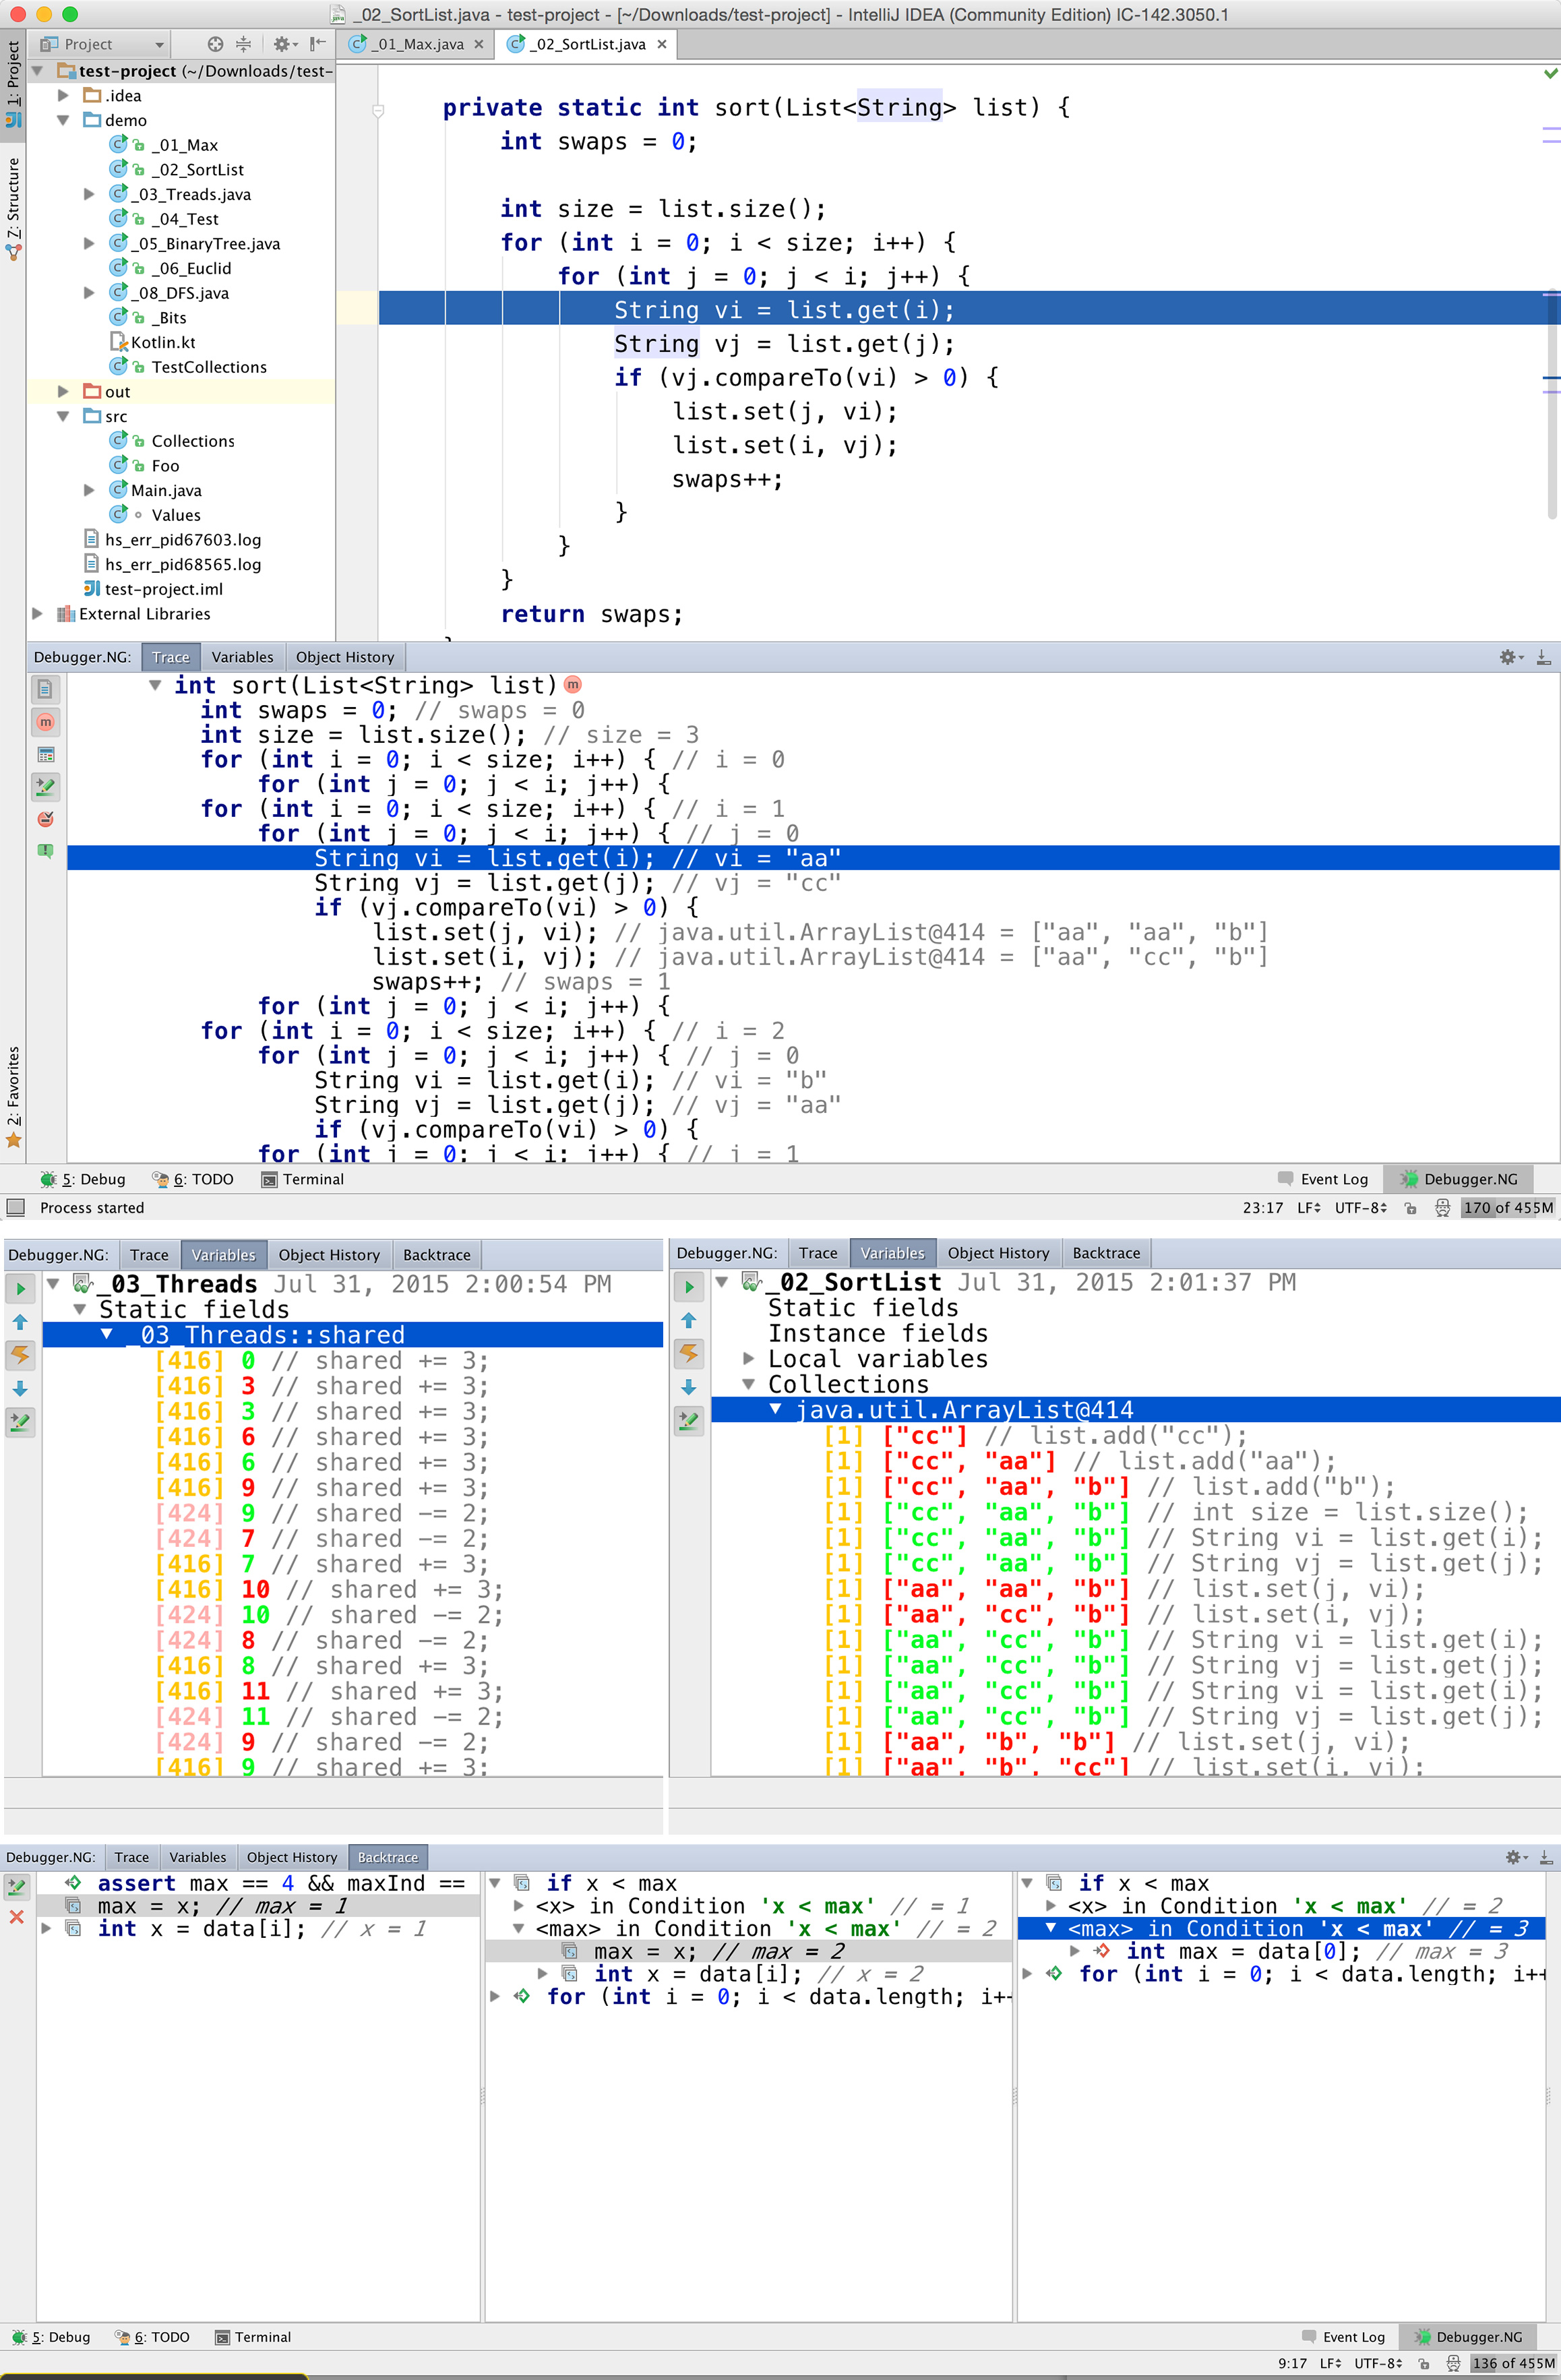
1st Place: New-Generation Debugger
Team: Andrey Breslav, Andrey Starovoyt, Nikolay Chashnikov, Pavel Talanov,
Sergey Kuks.
The main goal for “New-Generation Debugger” was to prototype a user experience that would take debugging to the next level. Debuggers have been around before many of us were born, and nothing essential has changed in this area since 1980s. The team tried to envision some significant innovation in this area by putting together the ideas of “back-in-time debugging,” static code analysis, and adding rich UI.
The purpose of the project was to inspire the product team to do something like this in production.
The prototype they built can step in forward and backward directions through code, show variable names, keep track of changes to fields and collections. On top of that, they use static code analysis to automatically answer questions like, “Where does this value come from and why?” The field tracker can also show what threads accessed a given field, which may help in detecting races and contention.
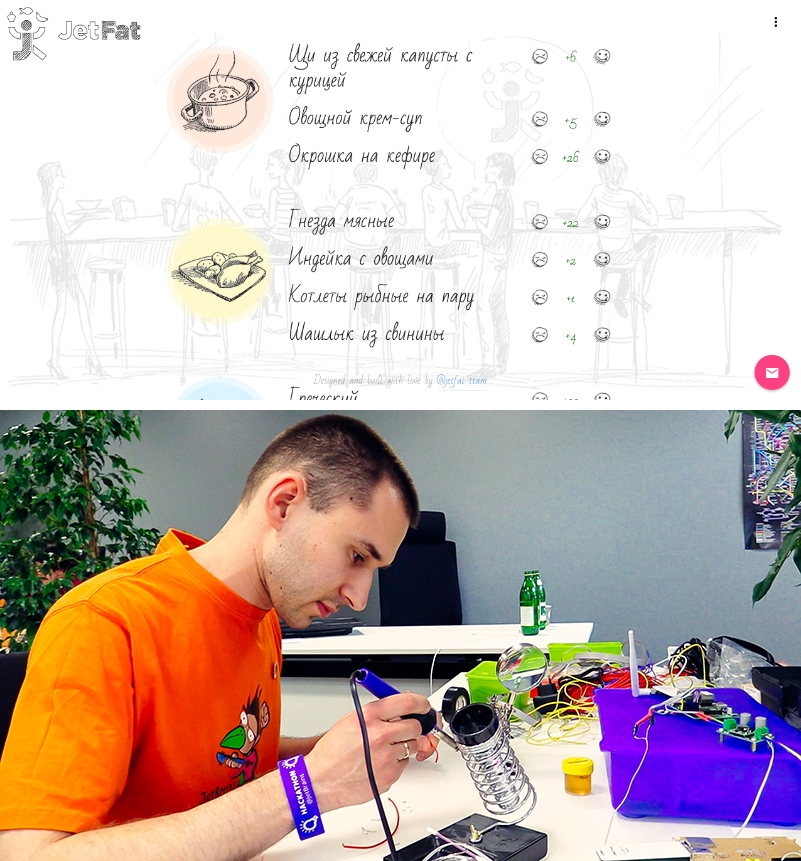
2nd Place: JetFat – An internal project to make life easier for employees.
Team: Maxim Erekhinskiy, Maxim Ryzhikov, Oleg Bahirev and Svetlana Belozerova
Our St.Petersburg office has its own cafeteria where the cooking staff prepares a variety of meals every day. A couple of issues, like difficulties in tracking visitors, sharing feedback and indicating dish preferences, inspired the idea of automating and visualizing the interaction between the employees and the kitchen. So the team set the following goals:
- Develop a web interface to create, edit and view menus. Let users like and dislike meals, comment on them and even send anonymous confessions of love to our cooks.
- Create a hardware device that will allow tracking visitors by their personal magnetic cards. The card reader would welcome employees by name, recognize who went to lunch, when and to which dining hall, and send the data to the server.
The hardware part proved rather challenging. The device had to perform fast enough to catch every bit from the card reader. The readers worked with the Wiegand protocol, which has no Flow Control. Because the team used RaspberryPi, they had two sets of libraries to work with interrupts, so that the device was able to correctly receive the number of the card. In the end, the Pies got Ubuntu with a compiled Pigpio library and a Python script that sends requests to the server.
The server part was more obvious. The team used Ubuntu and a node.js application that handles static client-side, processes API requests and works with the database (mongodb). The client was written in AngularJS + Angular Material + webpack to simplify the assembly.
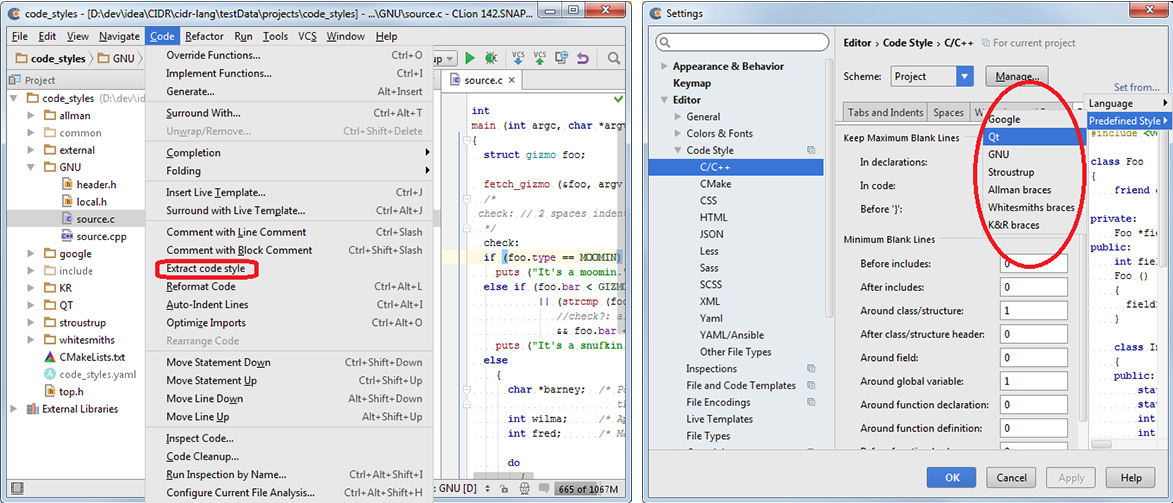
3rd Place: Applying Genetic Algorithm for Automatic Code Formatting
Team: Alexey Utkin and Roman Shein
The team set out to implement functionality similar to that described in the IntelliJ IDEA 15 EAP blog post, “Code Formatter: Adjusting Settings via a Quick-Fix“, but without human participation. They needed to choose formatting options and the combination that best fits the formatting in the current file. The problem could not be solved via a full search through all combinations of parameters because there were just too many possible combinations.
The team noticed some signs indicating that genetic algorithms could be applied, and they ran with that approach. As a result, code styles extracted from examples and available formatting options are now used in CLion and AppCode (e.g. Google Code Style and GNU Code Style).
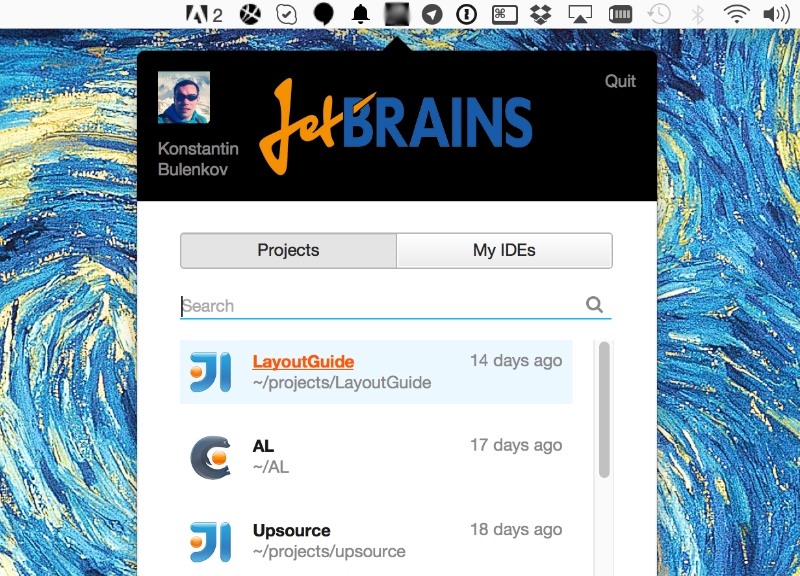
CEOs’ Choice: JetBrains App Launcher
Team: Konstantin Bulenkov, Eugene Datsky, Eugene Petrenko, Artem Tiunov, Leonid Shalupov, Victor Kropp
JetBrains App Launcher is a small system tray application that helps 3rd party services to connect with JetBrains tools. Open a new project directly from GitHub? Not a problem with App Launcher! The application also helps you update installed IDEs and install new ones. It has a list of all projects opened by any IDE. With JetBrains App Launcher, you can run an IDE, set up the environment (install the necessary plugins), check out project from a VCS, and open it—all in just one click on a special jetbrains:// link.
“Went To Production” Hackathon Award in 2015
Creators: Ekaterina Solovova, Ed Pavlov and Ruslan Isakiev
You may wonder what happens to Hackathon projects after the event is over. Well, mTest, a project from last year’s Hackathon, received an award this year too as it went to production.
Memory profilers can hardly be called an “everyday tool.” Typically, developers start thinking about profiling their product closer to its release. This approach may work fine until some last-minute issue like a leak or huge memory traffic crushes all your deadlines. The proactive approach would be to profile your app’s functionality on a daily basis, but who’s got the resources to do that? Well, we think there may be a solution.
If you employ unit testing in your development process, it is likely that you regularly run a number of tests on app logic. Now imagine that you can write some special “memory profiling” tests, e.g. a test that identifies leaks by checking memory for objects of particular type, or a test that tracks memory traffic and fails in case the traffic exceeds some threshold. This is exactly what dotMemory Unit framework allows you to do.
Participating Hackathon 2015 Projects
The Guided Code Review (screenshot) — The Guided Review plugin for IntelliJ IDEA is a tool for intelligent code reviews which understands the code being reviewed and can show the changes in a meaningful view, and automatically hide irrelevant changes.
Interactive IDE Voice-Control (download IntelliJ IDEA plugin) — This plugin is Voice User Interface for IntelliJ IDEA. Not only does it support trivial usage patterns such as navigation, running/debugging, inspecting code, goto, etc., but also complex context-aware features like:
- “find usages of the field ‘X'” – it’s capable of recognizing the context as an inside-class one and seek for usages of the particular field ‘X’.
- “introduce field ‘X'” – tries to seek for the class-context and introduce absent member as its field.
YouTrack Mobile (screenshot) — A mobile client for YouTrack that allows users to see the list of their issues and be able to search them. It can display attachments, comments, and other issue details.
WhitePad Board IDE (screenshot) — ReSharper shouldn’t be limited by the Visual Studio shell and WPF UI. The team chose the most controversial UI framework – WHITEBOARD. Yes, real whiteboard where you can ‘type’ JavaScript programs using markers and what you ‘type’ is highlighted, on the fly, by a projector controlled by ReSharper! The team used Kinect to control the cursor, and implemented automatic code completion suggestions after dot. They ran the program on the fly in the browser and implemented REPL so that you can see evaluation results of your JavaScript as you ‘type’. They even taught the interactive board to play tic-tac-toe so that you can relax and have some fun.
Testing Environment Manager (screenshot) — A web console where testers and developers can launch virtual machines, and where fresh builds of JetBrains products are installed and configured automatically. It uses Vagrant and Ansible tools on the backend, but hides its complexity from users not familiar with these technologies.
CareerFlow (screenshot) — The project provides statistics about the high schools and universities in St. Petersburg that students attend and which companies they choose to work for afterwards. You can check the average salary based on position, schools, companies and university ratings. The app should help students choose schools/universities, and help graduates choose a company. Follow a CareerFlow diagram all the way — from school to company.
Continuous Tests for JVM (screenshot) — The team developed part of nCrunch functionality for the JVM. A special agent is attached to junit/testng test runs (debug, coverage etc. that is not supported yet) and collects information about the tests passed. After that, you can run ‘Test Discovery’ configurations from a popup menu in your source code, or create ‘Test Discovery’ configuration to run all tests over changed files. This functionality is already used internally and accessible in latest IntelliJ IDEA 15 EAP builds.
JetChat (screenshot) — JetChat is a team chat tool with support for multiple topics within one group. A perfect replacement for Slack: no noise, only relevant messages.
JetPeople Analytics (screenshot) — JetPeople Analytics is a service where you can get any (public) information about JetBrains’ employees. For example, get answers to questions like, “How many software developers work at JetBrains?” and “What’s the gender ratio at each office?”.
Go to Anything (screenshot) — The idea of this project is to make available the navigation functionality of ReSharper/IntelliJ IDEA outside of the IDE, and to use it to navigate through the file system and external resources like YouTrack and Yahoo Finance. There are also built-in query functions like calculator.
WebKit Graphics for OpenJDK Rendering (screenshot) – This WebKit renderer for OpenJDK uses the internal graphics subsystem of WebKit for anti-aliased rendering of geometry primitives in Java.
Who Broke the Build (get TeamCity WBB plugin) — On large project teams, developers push hundreds of commits every day. So when a build breaks, there are a lot of changes from many committers after the last successful one. The WBB plugin starts one or several “historical” builds to split the whole group of changes into several subgroups and finds which one is causing problems. The plugin assigns “investigation” of the problem to the committer of that change, and TeamCity sends them a message.
Jetgregator (screenshot) — Jetgregator is a search engine for reviews about anything like electronics, music, people or even products like IntelliJ IDEA.
Snake Plug-in (screenshot) — A snake game inside your code structure in IntelliJ IDEA. Make your code more Python-like by helping the snake eat all the curly braces and semicolons! Install the Snake plug-in from our plugins repository and play. To start the game, type ‘snake’ in the editor or select “Tools | Run Snake”.
Reversi@Kotlin (screenshot) — The author developed his first implementation of the Reversi game on BASIC 20 years ago. He has since ported it to each programming language he has studied. When he decided to study Kotlin, he knew what to do. Two days were enough to implement basic functionality, including pluggable algorithms to play.
CPython Native Statistical Profiler (screenshot) – A basic sampling profiling of CPython interpreter was implemented in Rust programming language during the Hackathon. This includes measuring the approximate count of function calls and their duration. It works for Mac and Linux versions of Python 2.7. Future plans include supporting profiling on Windows and Python 3. There is also the possibility to see the detailed call tree view in a nice-looking user interface integrated into the PyCharm IDE.
Text Ads Performance Prediction (screenshot) — Uses a Google Spreadsheet to predict the success of newly created Search Ads in Google (based on historical data for other ads). The Google Prediction API was used and the results are somewhat mixed: the model works, though accuracy of prediction is low (due to limitations in historical data).
If you would like to learn more about the Hackathon setup, process, nuts and bolts, please revisit the coverage from our 1st Annual Hackathon.
Thank you for sharing our Hackathon with us!