CLion 2020.3: Core Dumps Debug and Debug as Root, CTest Support, MISRA Guideline Integration, and a Better Qt Project Experience

The time has come for CLion’s final release of this year, v2020.3!
This version is focused on the debugging experience and on the flexibility of the unit testing integration. Embedded developers will find support for the first collection of MISRA checks. CLion 2020.3 also introduces a variety of IDE functions tuned specifically for working with Qt code.
To update to this version, you can use the Toolbox App, a snap package (on Ubuntu), download the installer from our website, or apply the patch update to upgrade from the last 2020.2 build.
Here is a quick overview of the main highlights. If you are interested in the specific details, please read on:
-
An enhanced debugging experience
- Debugging with Core Dumps
- Run and Debug with Root/Administrator privileges
- Set execution point to an arbitrary line
- Interactive hints and inline watches
- Debugger demo
- A few more improvements to Run/Debug configurations
- Unit testing: new CTest and Google Test enhancements
- MISRA C 2012 and MISRA C++ 2008
- Code analysis, completion, and refactoring
-
Project models:
- Enable/Disable CMake Profiles
- Better Makefile project experience
- Better Qt project experience
- Demo: Updates for Build/Run and enhancements for Qt projects
- Enhancements to VCS and Remote mode, and some news updates from Code With Me and Rust plugins.
A more profound debugging experience
The debugging experience is one of the most powerful benefits of integrated environments. CLion enhances the debugging process by adding breakpoint options, shortcut-bound stepping abilities, watches and evaluations, inline variable views, disassembly, and memory views. This all works for local and remote toolchains, and also with microcontrollers. CLion 2020.3 helps you debug like a pro with the new abilities to open and inspect the core dumps of a crashed process, to launch applications with root privileges, and to move the execution point back and forth though your program while debugging. We’ll briefly discuss these new improvements and then watch them in action in a video demo from Phil Nash.
Debugging with core dumps
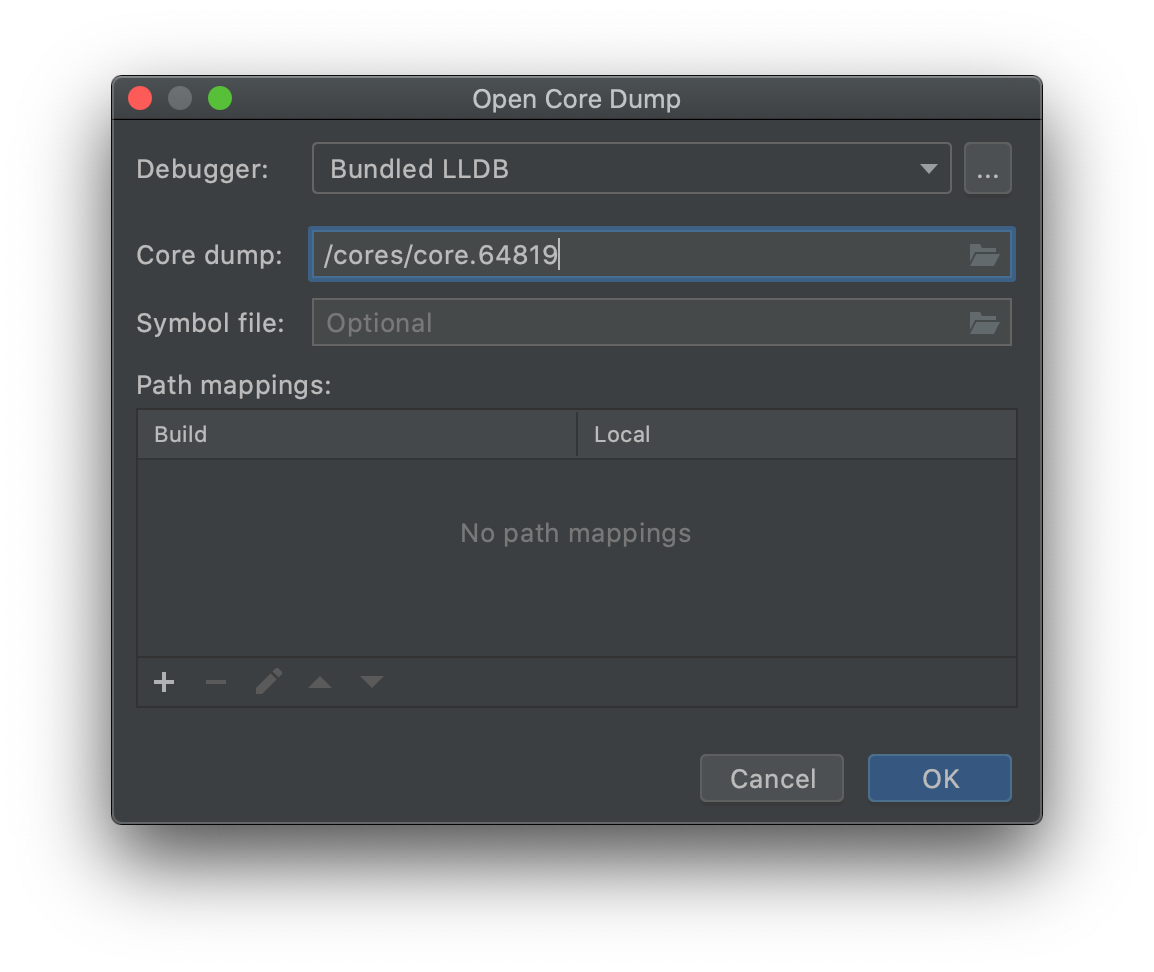
If a process crashes and you manage to collect a crash dump, a new Run | Open Core Dump… action available for Linux and macOS allows you to open this dump in CLion and debug it. You can select a new core dump or open one from a list of those previously opened in CLion. For a new one, the action will automatically create a new Core Dump Debug run configuration for you and launch it (you can also create or update this configuration manually):
If the binary is built with debug info, you probably won’t need to do much configuration for simple cases. Otherwise, a symbol file may be useful for pointing CLion to debug symbols. These will help CLion identify the program symbols correctly and navigate to the proper source code locations. However, for now the symbol file only works for GDB.
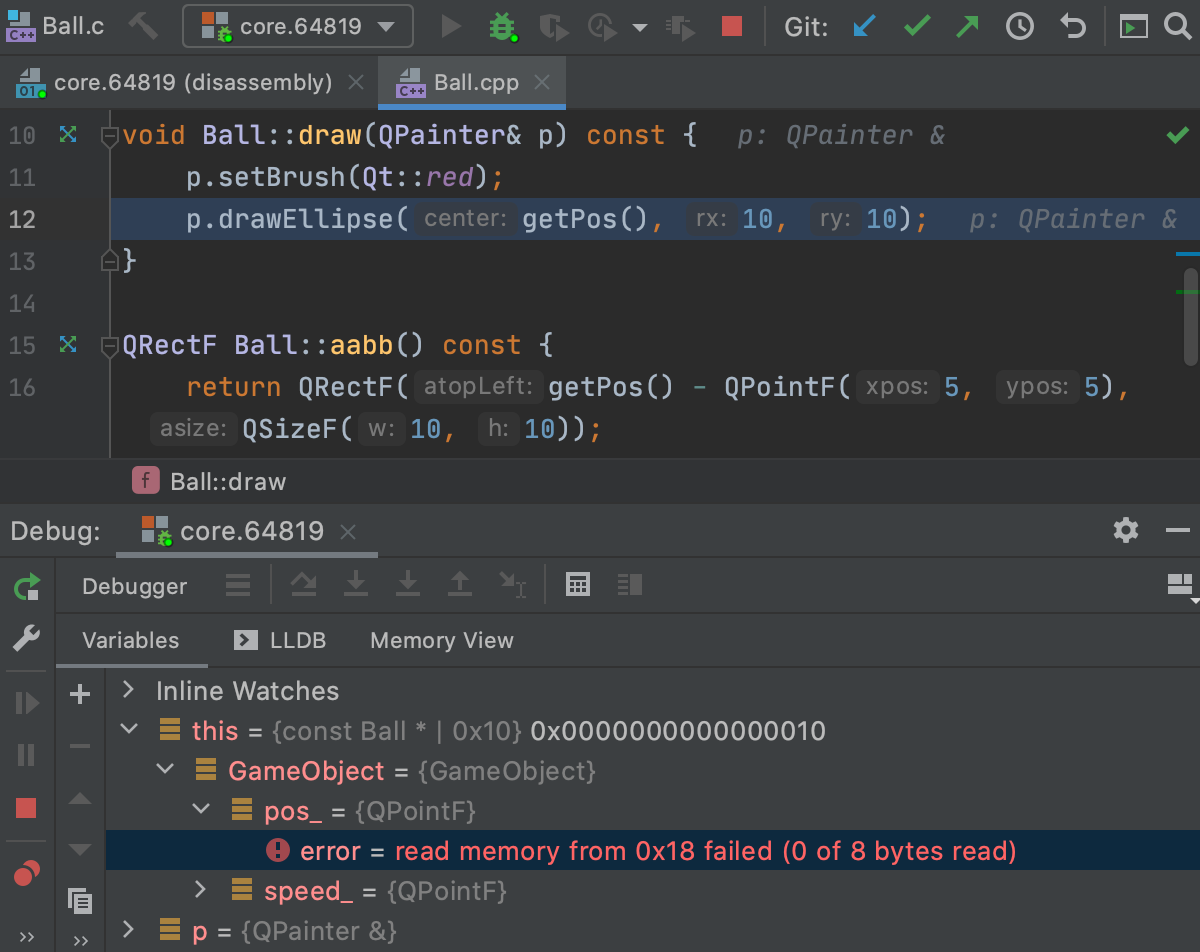
After launching core dump debug, you can inspect the frames and variables values, check the memory and disassembly view, evaluate expressions, and run debugger commands from the debugger console:
To learn more about configuration details and known limitations, please check out this blog post.
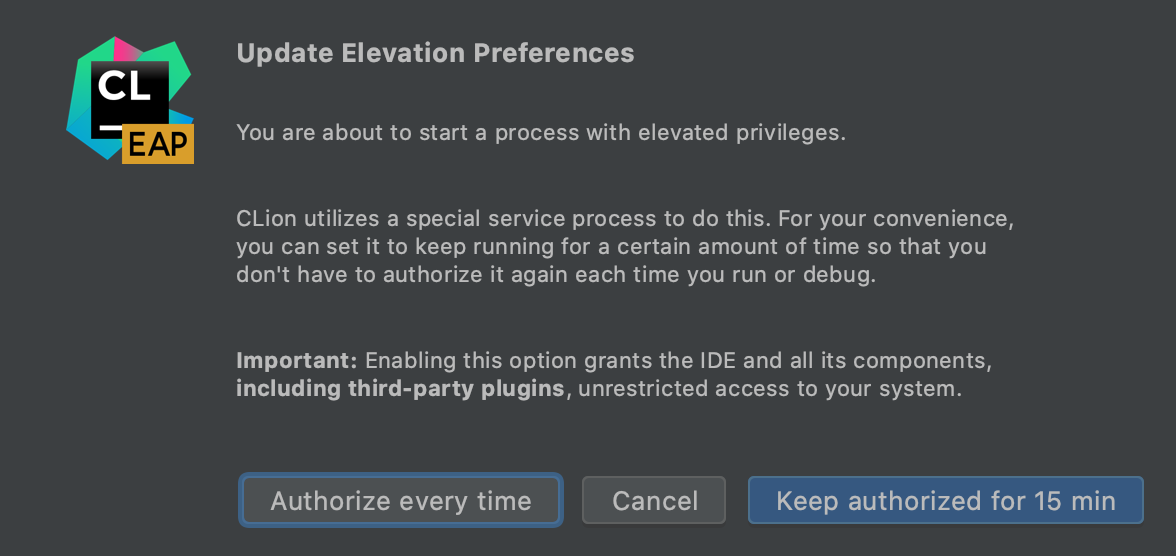
Run and Debug with Root/Administrator privileges
A new Run with Administrator privileges/Run with root privileges setting is available to run and debug configurations for CMake, Makefile, Gradle Native, Custom Build, and all supported unit test applications. This works on all platforms and for all toolchains (including WSL and Remote mode).
To save you time, CLion offers a new elevation service that can keep the authorization for a configured amount of time. This means you don’t have to repeatedly confirm root access if you are investigating an issue in your app that requires relaunching the debugger, for example.
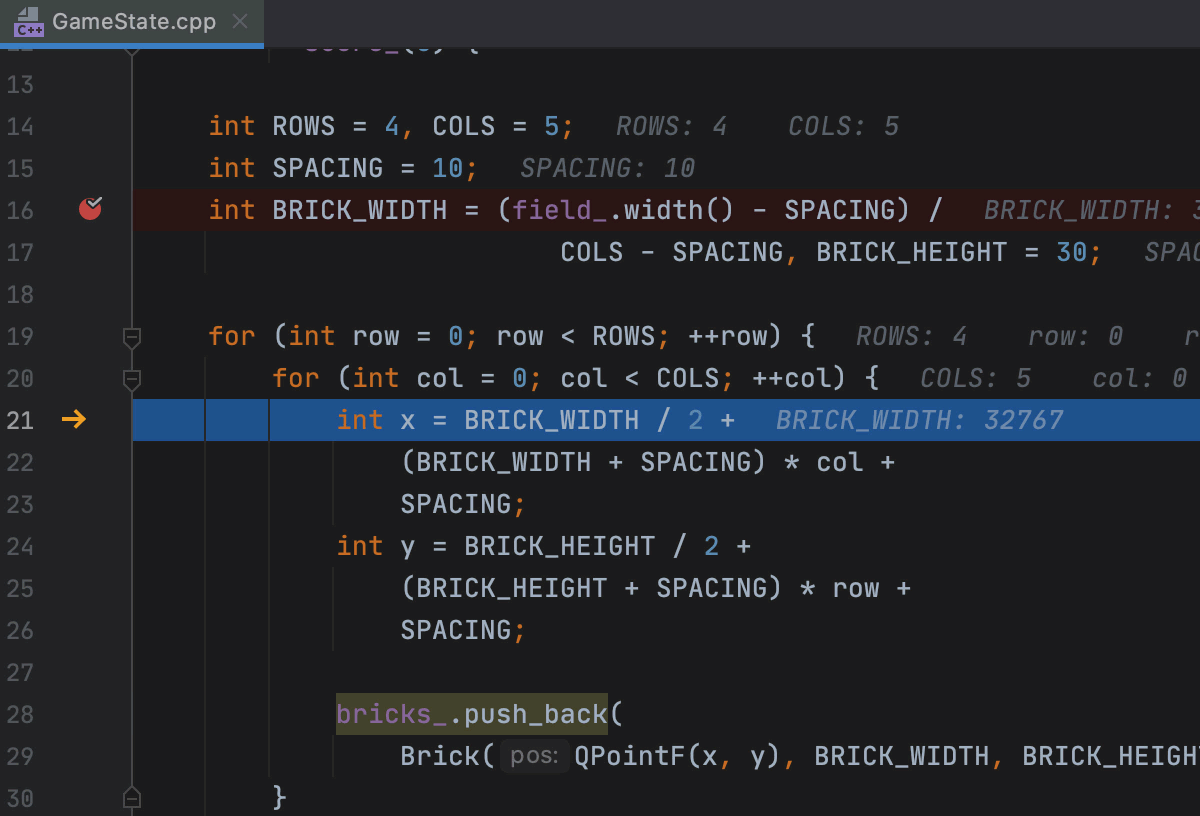
Set execution point to an arbitrary line
What if you want to change the conditional branch during the debug session and check another execution path? Or maybe you want to skip some code completely, or jump back? With the new Set Execution Point to Cursor action, you can move back and forth though your program’s execution while debugging. Simply drag-and-drop the yellow arrow in the editor:
The feature is indeed that simple. Nevertheless, it significantly enhances your debugging experience. Just be careful and don’t skip the variables initialization ;) For more details, read this blog post.
Interactive hints, inline watches, and more
Inline variable views have already been in the CLion debugger for a long time. These views display the variable values right in the editor during the debug session. However, for complex structures or class objects, the renderer might be not particularly helpful. With CLion 2020.3, you can now expand it to see all the fields that belong to a given variable. We call them interactive hints!
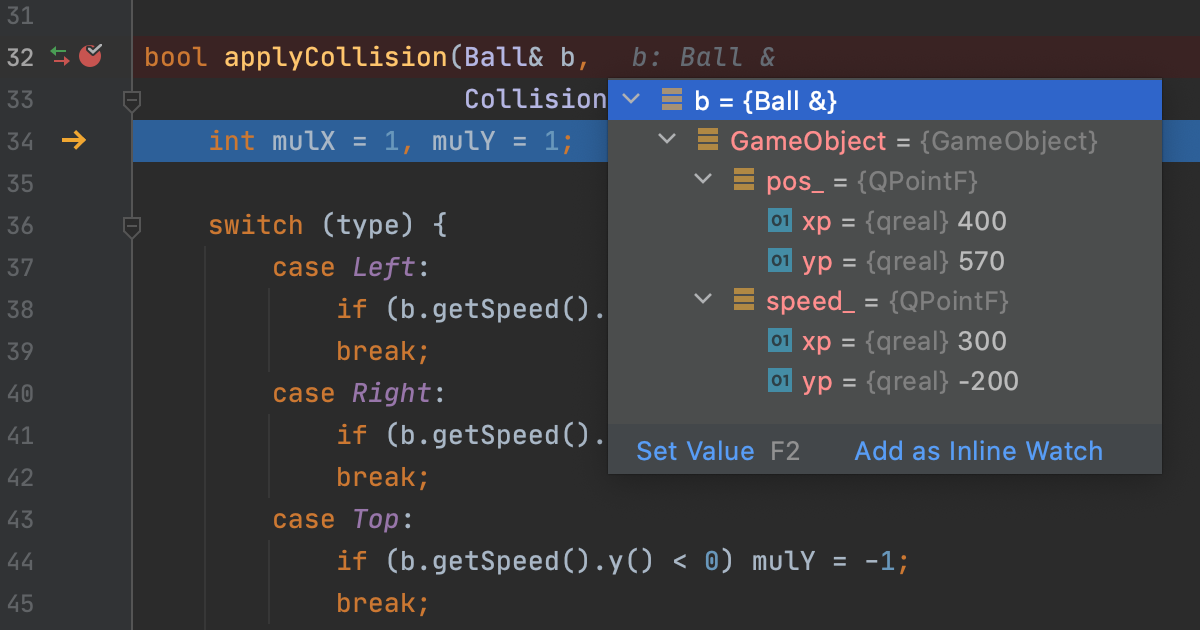
Sometimes you may want to follow a complex expression in the editor rather than in the Watches panel. This is often because the expression only makes sense in that particular code location (for example, it uses local variables that are only available in the scope). It could even become invalid in any other context or at any other moment in time. For such cases you now have Add as Inline Watch, which causes the expression to be shown right in the editor, exactly where you added it.
Finally, we’ve added the option to select any custom GDB binary in the Remote GDB Server configuration.
Debugger demo
Watch this short demo from Phil Nash to see all these features in action:
A few other improvements to run/debug configurations
In addition to being able to launch run/debug configurations with root/administrator privileges, you can now also point CLion to a script that configures the environment. This script takes precedence over the variable values provided in the Environment Variables dialog and is run each time the corresponding configuration is launched, after all the Before launch steps have finished.
For embedded developers, the OpenOCD run configuration now works with Custom Build Application targets.
And finally, all run/debug configurations can now be edited while project indexing is running!
Unit testing: new CTest and Google Test enhancements
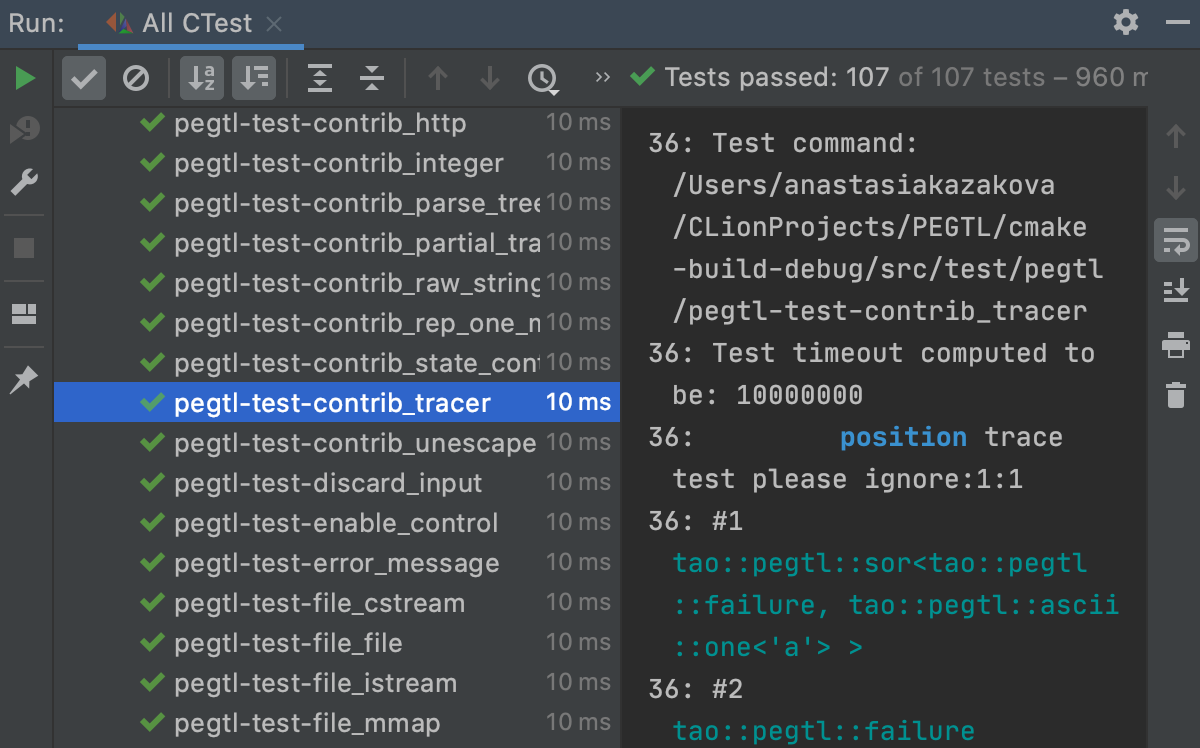
CTest, a testing tool distributed as part of CMake that is used to automate unit testing, is now supported in CLion. This means the IDE detects the list of tests that are run with CTest and automatically creates run/debug configurations for them. The gutter icons appear in CMake files so you can click and launch the tests from there. When tests are launched, the results are presented in the built-in test runner, from which you can debug tests, rerun all or only failed tests, and much more.
It’s important to note that CLion relies on the ctest executable located in the same folder as the selected cmake executable, There is currently no way to use an arbitrary ctest executable. The minimal supported CTest version is 3.14 for now. Learn more.
For Google Test, we’ve enhanced the integration and updated the test tree representation, in addition to addressing several performance problems:
- The full test tree is displayed immediately in the built-in test runner, and then the tests are executed.
- For parameterized tests, CLion now displays test parameters right in the test tree.
-
Disabled tests (those with the
DISABLEDprefix in their names) are now also shown in the test tree with an icon representing their status. - The test scanner has received some performance optimizations.
Unit testing demo
In this demo, Phil shows off some of the CTest and GT improvements:
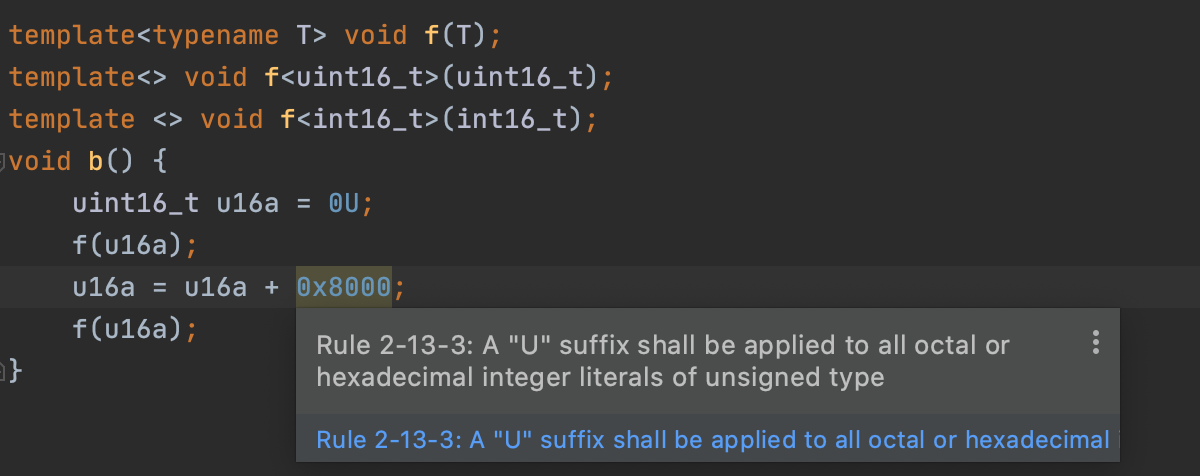
MISRA C 2012 and MISRA C++ 2008
MISRA guidelines are widely used in embedded development, especially in the automotive industry. And companies often obtain certification to confirm that they comply with these rules. CLion won’t replace the certification step for you, but starting with v2020.3 it can help reveal incompatibilities earlier in the development cycle. To achieve this we’ve started adding MISRA C 2012 and MISRA C++ 2008 checks to CLion. Here’s a list of the checks we currently support.
We plan to add more checks next year, and maybe even take a look at the AUTOSAR rules.
More on code analysis, completion, and refactoring
We are continuously working to make code analysis and refactoring in CLion more accurate and flexible. In addition to MISRA support, with this release we’ve introduced the following notable changes:
- CLion comes bundled with Clang-Tidy, and you can check which revision is bundled in Settings/Preferences | Languages & Frameworks | C/C++ | Clang-Tidy. Now there is also a notification that will tell you when Clang-Tidy has been updated to a newer version, letting you know when you might need to update the configuration files. See how it works.
- In the event that you need to extract some logic from a function, pass it as a lambda (for example, a comparison passed to a sorting function), and update all the usages automatically, you can now use the new Extract Lambda Parameter refactoring in CLion. Watch this short demo to learn more about it.
-
When you complete C++ keywords in CLion 2020.3, Clang snippets are available that help not only with the keywords, but also with placeholders and the syntax of the whole expression:
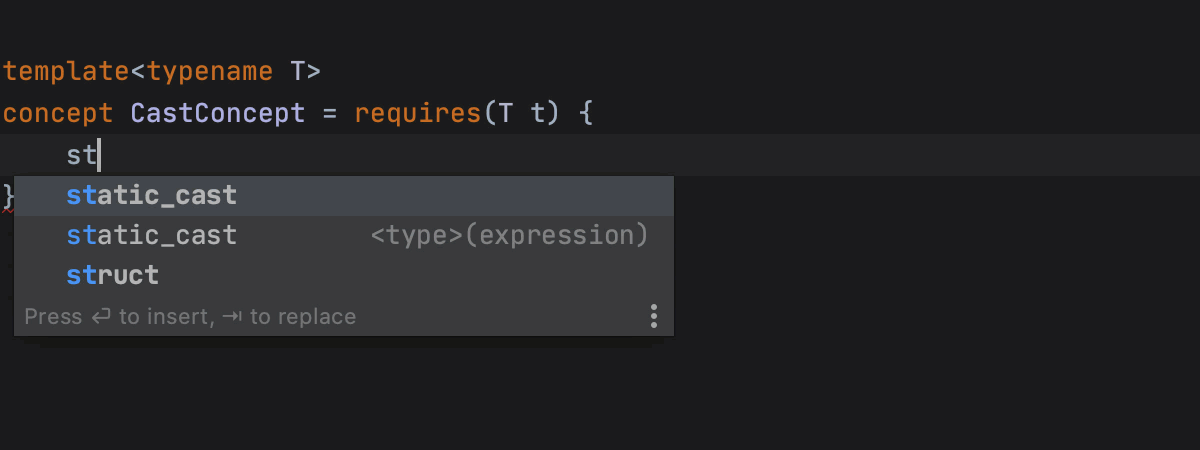
The full list of currently available snippets can be found here.
Check out another short demo from Phil Nash on updates in code analysis and completion in CLion 2020.3:
Project models
We continue to improve CLion’s support for the following project models: CMake, Makefile, Native Gradle, and compilation database. At the moment, our top priority is making sure these project models work smoothly and provide an equal experience in each case, rather than adding new options.
Enable/Disable CMake Profiles
CMake profiles are handy for cases where you need to build your application with different build types, using different toolchains, or in both local and remote environments. However, often some of the profiles you’ve already configured go unused for a while (for example, when the remote machine is not available) and you work only with a few selected profiles. Profiles can now be disabled in CLion to avoid loading them unnecessarily . When you need these configurations back, simply enable them:
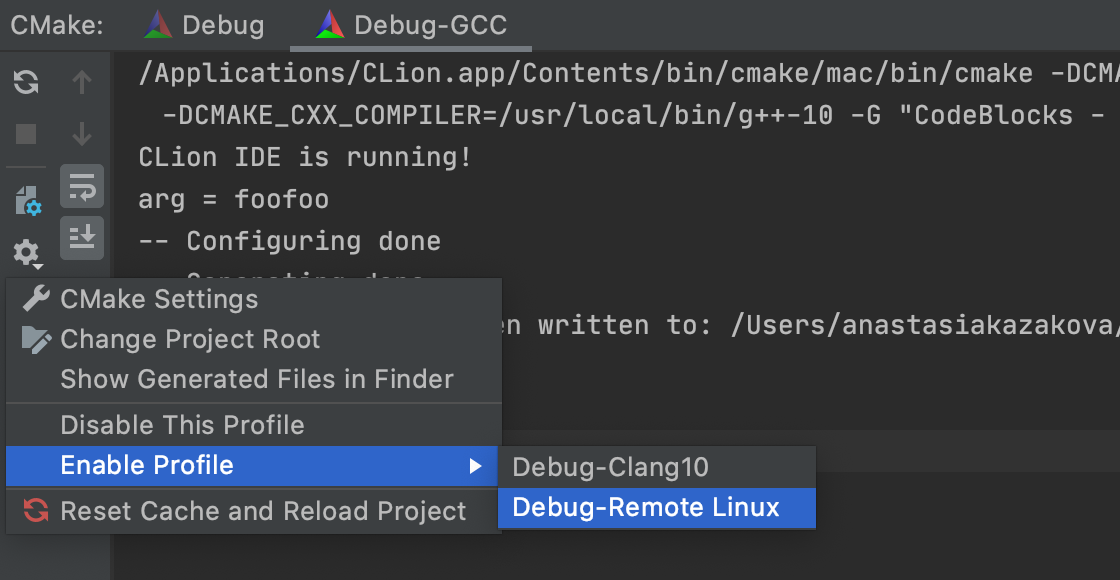
The setting is available in the CMake toolwindow or Settings/Preferences | Build, Execution, Deployment | CMake.
Better Makefile project experience
We are excited to see growth in the number of Makefile project users in CLion, and we’re grateful to everyone for sharing their feedback with our team! This helps us further improve our support for Makefile, and in v2020.3 the following enhancements are available:
-
Makefile projects using various wrappers like ccache, libtool, dolt, slibtool, and jlibtool can now be successfully loaded in CLion. Such tools made CLion’s parsing of the
makecommand’s output more difficult by hiding the compilation flags and interfering with themakeoutput. We’ve now resolved this! Check out this article to learn about other limitations that still affect how Makefile projects are loaded in CLion. -
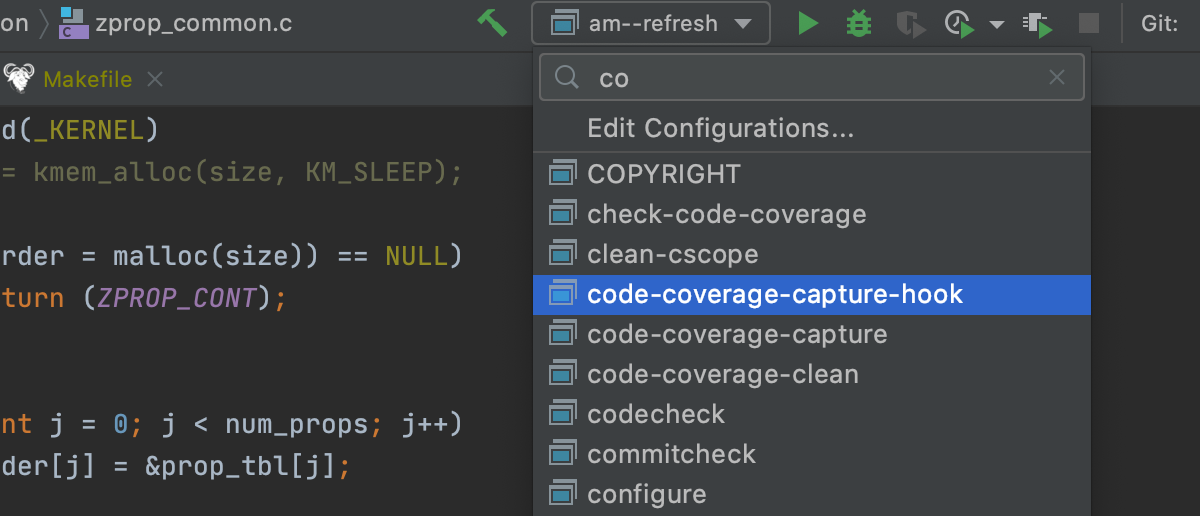
It’s now easier to start working with Makefile projects in CLion, as Run/Debug configurations are created automatically for the targets in the top-level Makefile when loading the project. To run and debug, you now just need to point the configuration to the built executable:
- And finally, the Recompile action (Ctrl+Shift+F9 on Windows/Linux, ⇧⌘F9 on macOS) is now available for Makefile projects.
Better Qt project experience
Since we often get feedback about using CLion with Qt code, we decided it’s time to improve the Qt experience for our users. In v2020.3, we’ve made it easier to start new Qt projects and create new Qt classes in CLion:
-
The New Project dialog suggests the Qt Console Executable and Qt Widgets Executable project types. Specify a few settings and get the basic project generated for you from the predefined template in CLion:

- Now you probably want to add some new Qt files to your project. A new QT UI Class item in the New menu (Alt+Insert on Windows/Linux, ⌘N on macOS) helps you simultaneously create a Qt class along with a .ui file. The templates used to generate the initial content of these files (Qt Class, Qt Class Header, and Qt Designer Form) can be configured in Settings/Preferences | Editor | File and Code Templates.
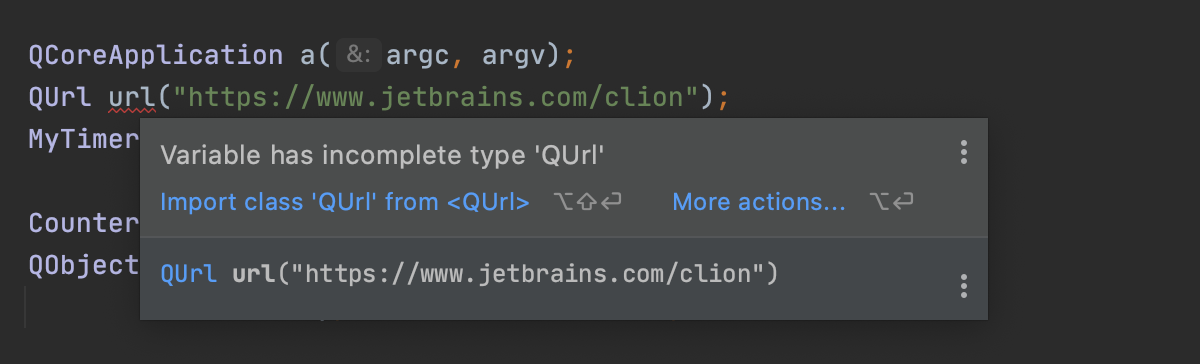
While editing Qt code in CLion, you’ll benefit from a few coding assistance improvements:
-
Auto-import will suggest the Qt style for imports:
-
And code completion will suggest slots and signals where appropriate, filtering out all other options:

Demo: Updates for Build/Run and enhancements for Qt projects
Watch these features in action in this short demo by Phil Nash:
And much more!
Among the vast assortment of improvements in CLion 2020.3, there are a few more we’d like to highlight:
- IAR build tools are now supported on Linux (previously, you could only use the IAR compiler on Windows).
-
In remote mode:
- WSL support now works with openSUSE-Leap-15-2.
- Excluded paths for remote toolchains can now be automatically updated with the directories marked as Excluded (check out the details).
- CLion contains a lot of Version Control support enhancements from the IntelliJ platform, such as the Git tab in Search Everywhere, Git staging support, and much more. Check out this page for more information.
- Another big topic is UI improvements, like the updated Welcome screen, which makes accessing previously opened projects quicker and easier, the option to sync your IDE theme with your OS settings, and the ability to split the editor by dragging and dropping tabs.
And finally we have a couple of short announcements about some valuable plugins. First there’s Code With Me (EAP), a new service from JetBrains for collaborative development and pair programming. Code With Me makes it possible for you to share the project you currently have open in your IDE with others and work on it together in real time. You can download it today from the plugin marketplace (Preferences / Settings | Plugins | Marketplace). It’s worth noting, however, that this plugin is still at the preview stage. Check out these posts to learn more about Code With Me.
There are also some updates to the Rust plugin to mention here. The most significant update is a new UI and more code insight for Cargo features. Also, the plugin now supports WASM projects and makes it possible to set Rustfmt as the default formatter. On top of that, there is a new experimental engine for resolving names. We’ll publish a separate post about the updates to IntelliJ Rust shortly.
That’s it for this release. We encourage you to give CLion 2020.3 a try. Update today if you have an active subscription, or start your free 30-day trial to evaluate the new features!
Your CLion team
JetBrains
The Drive to Develop