

.NET Tools
Essential productivity kit for .NET and game developers
ReSharper Ultimate 10 EAP 5

Last Friday saw the release of a new ReSharper Ultimate 10 EAP build. Highlights of EAP 5 include notable changes in ReSharper and dotMemory, as well as dotTrace integrating its Timeline profiling functionality right in Visual Studio.
ReSharper
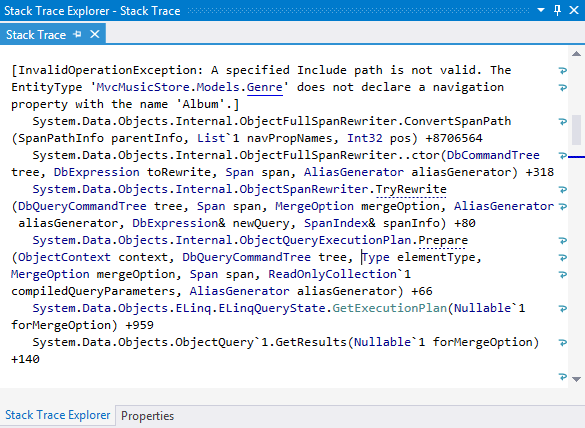
Revised Stack Trace Explorer
ReSharper’s Stack Trace Explorer tool window has been basically rewritten from scratch. Among other effects, this enabled Stack Trace Explorer to:
- Provide links to types in addition to methods.
- Parse more types of data, including WinDbg GCRoot dumps and Visual Studio’s Call Stack tool window contents.
The update to Stack Trace Explorer also affects ReSharper’s Unit Test Sessions tool window where it is used to display call stacks in unit test output and provide links to relevant source code locations.
Support for Google Protocol Buffers (Protobuf)
You don’t use Google Protobuf too often but when you do, you can now lean on ReSharper to ensure proper IDE support in .proto files. This includes syntax highlighting, code analysis, code completion and navigation.
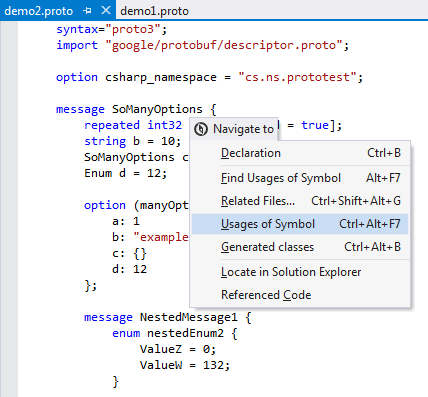
In terms of Protobuf versions, both 2.x and 3.0 syntax is supported.
Other changes
Other notable changes in ReSharper 10 EAP 5 include:
- More C# code style inspections and quick-fixes, such as those helping get rid of redundant parentheses, or add parentheses to disambiguate precedence.
- Support for different kinds of JSDoc type annotations, including symbol names, unions, parameter annotations, type definitions and callbacks.
Here’s the full list of fixes in ReSharper 10 EAP 5.
dotTrace
Timeline profiling integrated in Visual Studio
dotTrace integration in Visual Studio has traditionally been sketchy but here’s an important step to change this. From now on, when you choose to profile your startup project from Visual Studio in Timeline mode, you can view the resulting snapshot right in Visual Studio, using the Performance Snapshots Browser tool window.
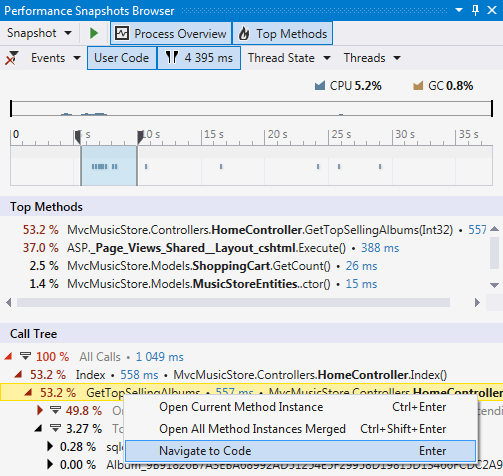
Available controls include the timeline view that you can zoom into, as well as the call tree, thread and thread state selectors, event filters, and a switch to focus on user code.
Whenever necessary, you can choose to open a particular snapshot in the standalone dotTrace Timeline Viewer.
dotMemory
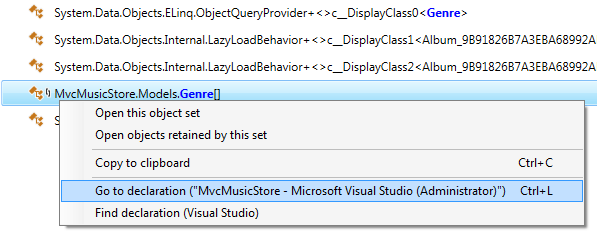
Navigate from memory snapshot to code in Visual Studio
Starting from this EAP, dotMemory introduces a new contextual option that lets you navigate from any object set to its corresponding type in an open Visual Studio instance. If the target type is a library type, this triggers ReSharper’s decompiling functionality and opens decompiled code in Visual Studio.
Wrapping it up
As usual, this is where you can download ReSharper 10 EAP from.
Experiencing issues with the EAP? Please report them to issue trackers of affected products as we’re right now trying to stabilize everything that’s inside so that the expected November 2 release is as smooth as possible.
Issue trackers are as follows: ReSharper, ReSharper C++, dotTrace, dotCover, dotMemory, dotPeek.


