

.NET Tools
Essential productivity kit for .NET and game developers
ReSharper Ultimate 2016.3 EAP 6

ReSharper Ultimate 2016.3 EAP 6 is now available to download. Let’s take a look at what’s in this latest build.
dotTrace
EAP 4 introduced support for profiling .NET Core applications, and now you can profile .NET Core unit tests directly from ReSharper’s test runner. You’ll note that currently, dotTrace hasn’t yet added folding or subsystem definitions for the xUnit.net or .NET Core modules, which can make it a little harder to read, but don’t worry, we’re working on this.
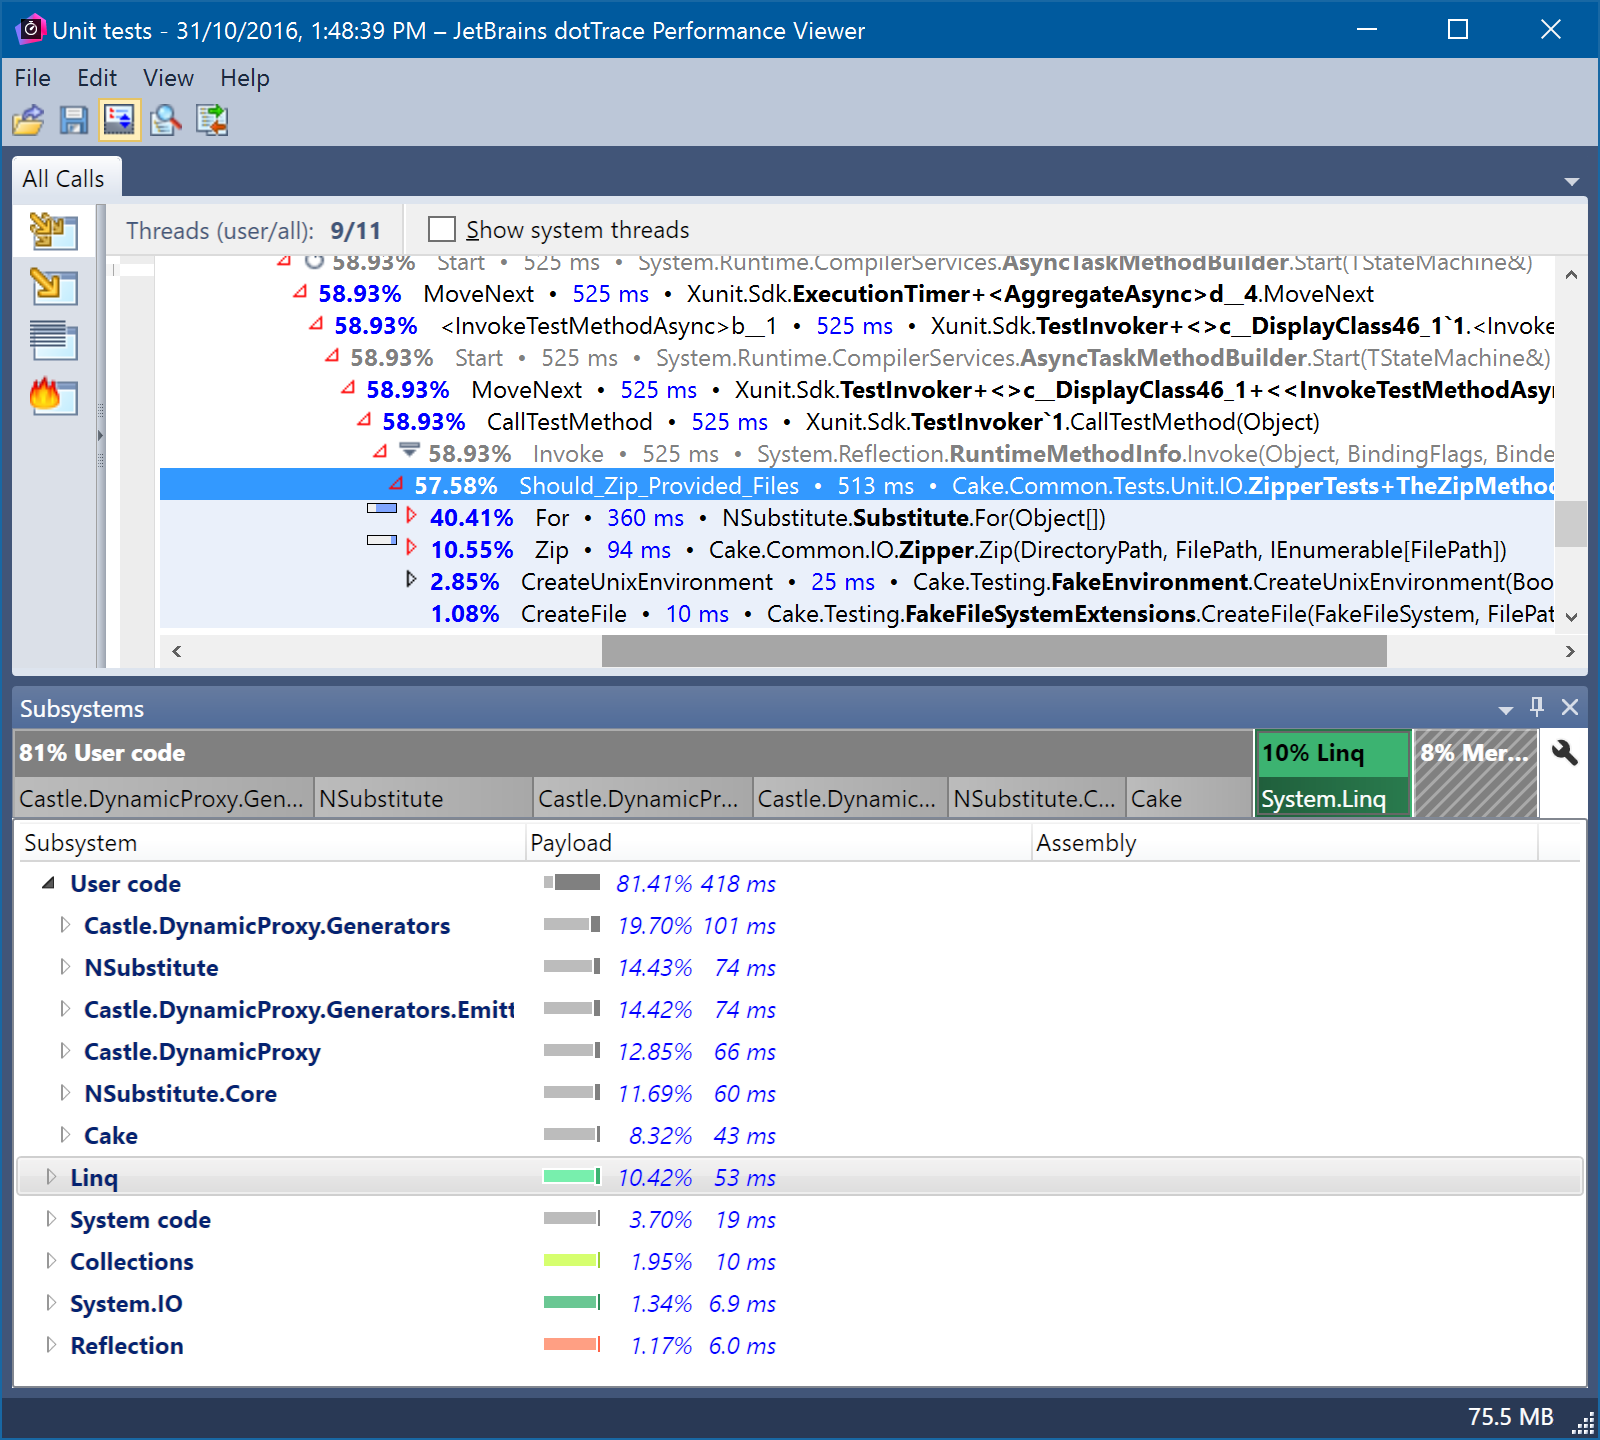
As before, there are certain restrictions – this is Windows only, right now, and targets the CoreCLR, not Mono. It also only supports Sampling mode. However, we previously suggested setting the COMPLUS_ReadyToRun environment variable. This is no longer necessary – dotTrace will do this for you.
Next up, the Timeline view in dotTrace now supports capturing native allocations. This is enabled in the Advanced view when Timeline is selected.
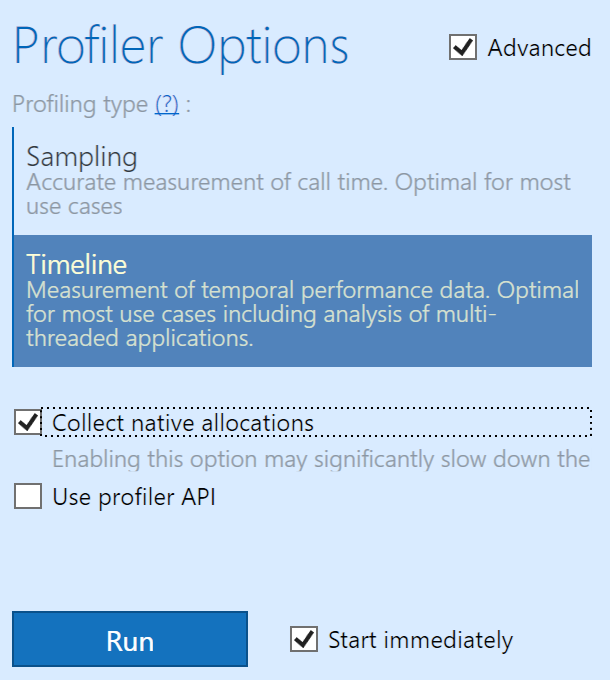
Once enabled, dotTrace will capture events whenever there is a native allocation. Note that this has an overhead, and can have a noticeable impact on the application being profiled.
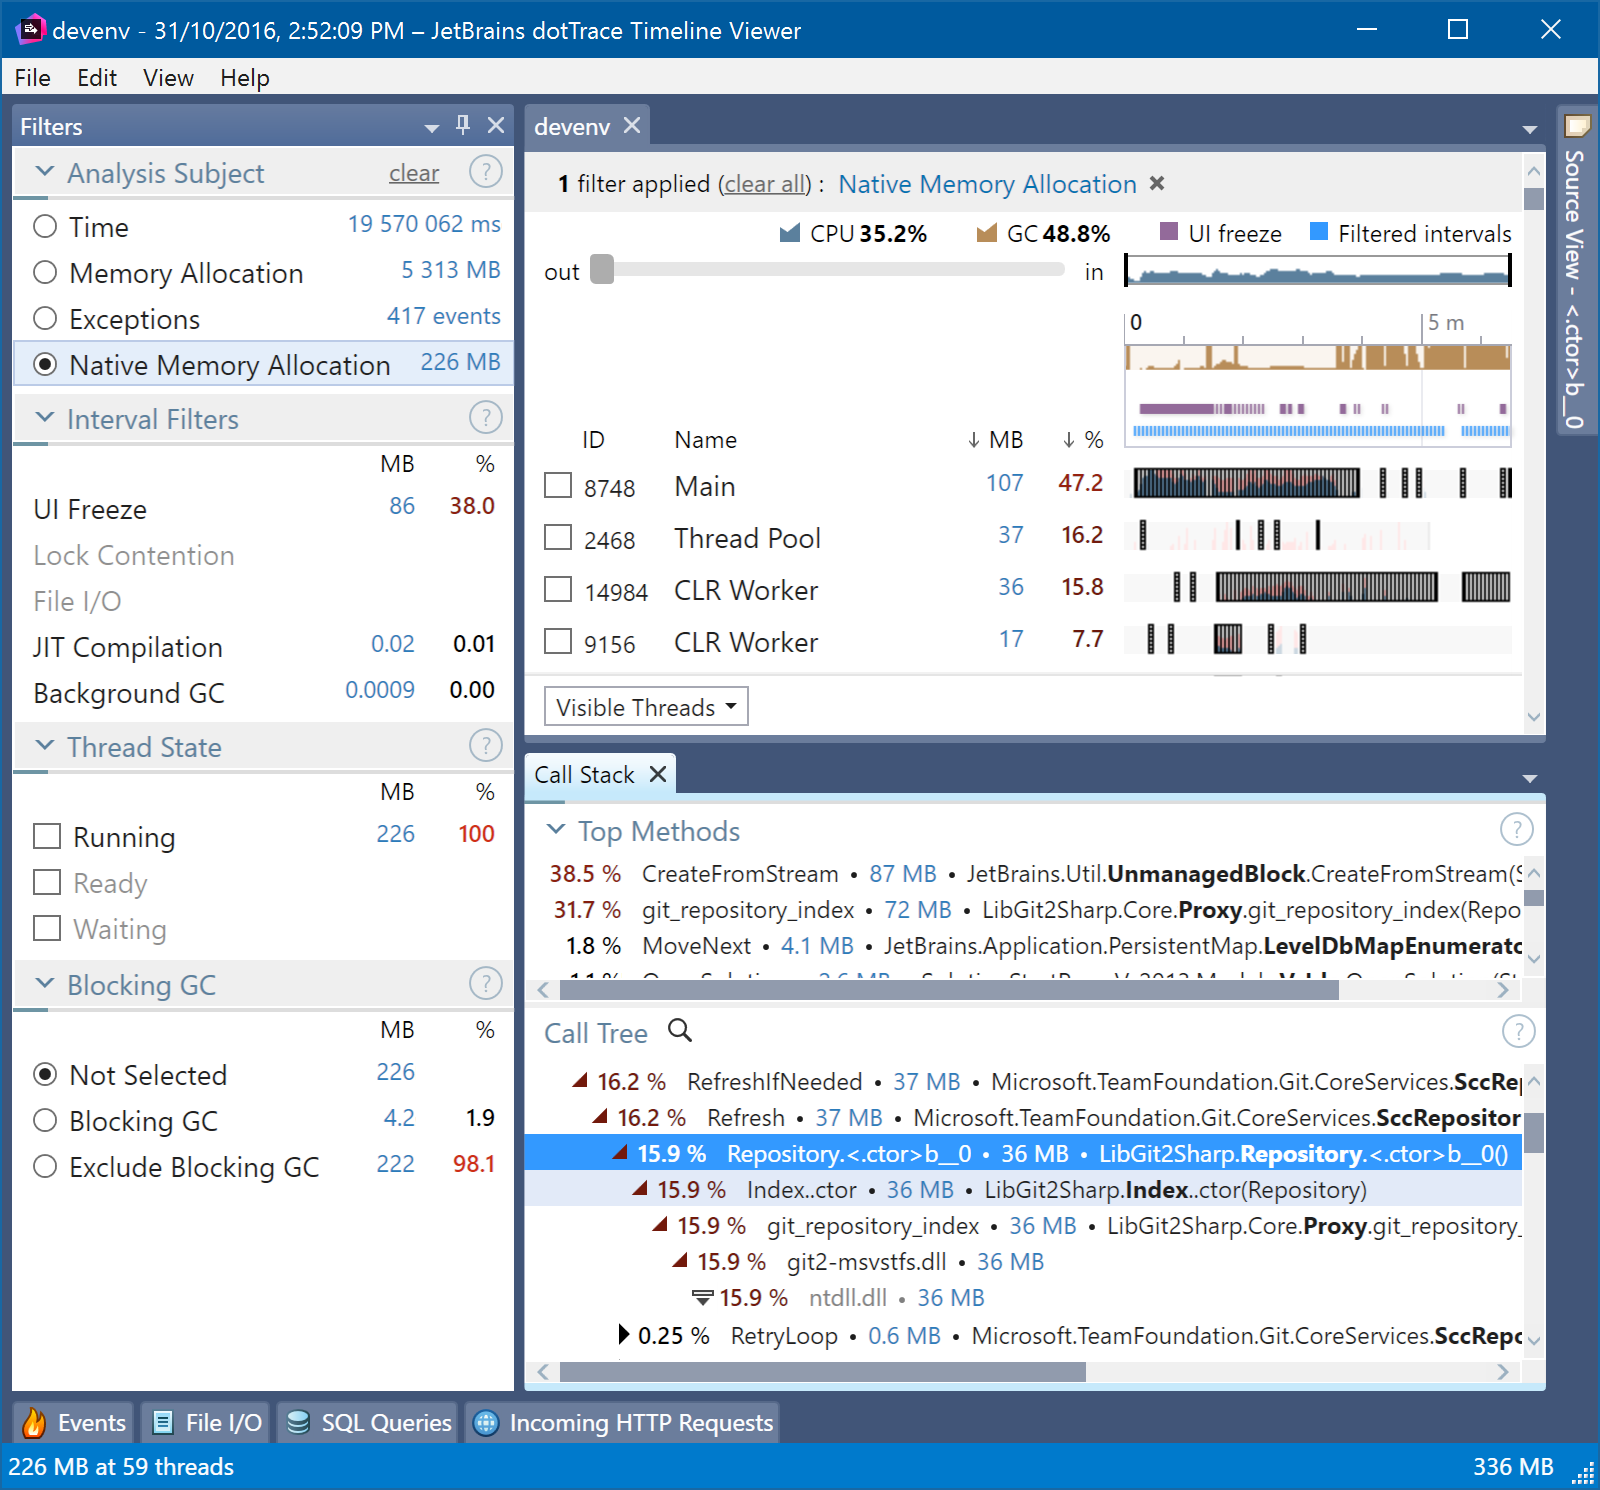
After profiling is complete, and the data is analysed, dotTrace will add a new filter of “Native Memory Allocations”. When selected, this will filter down to only the events which caused native memory allocations, selecting the time slices on the main Timeline view, and filtering the Call Stack top methods to the methods that were making the allocations.
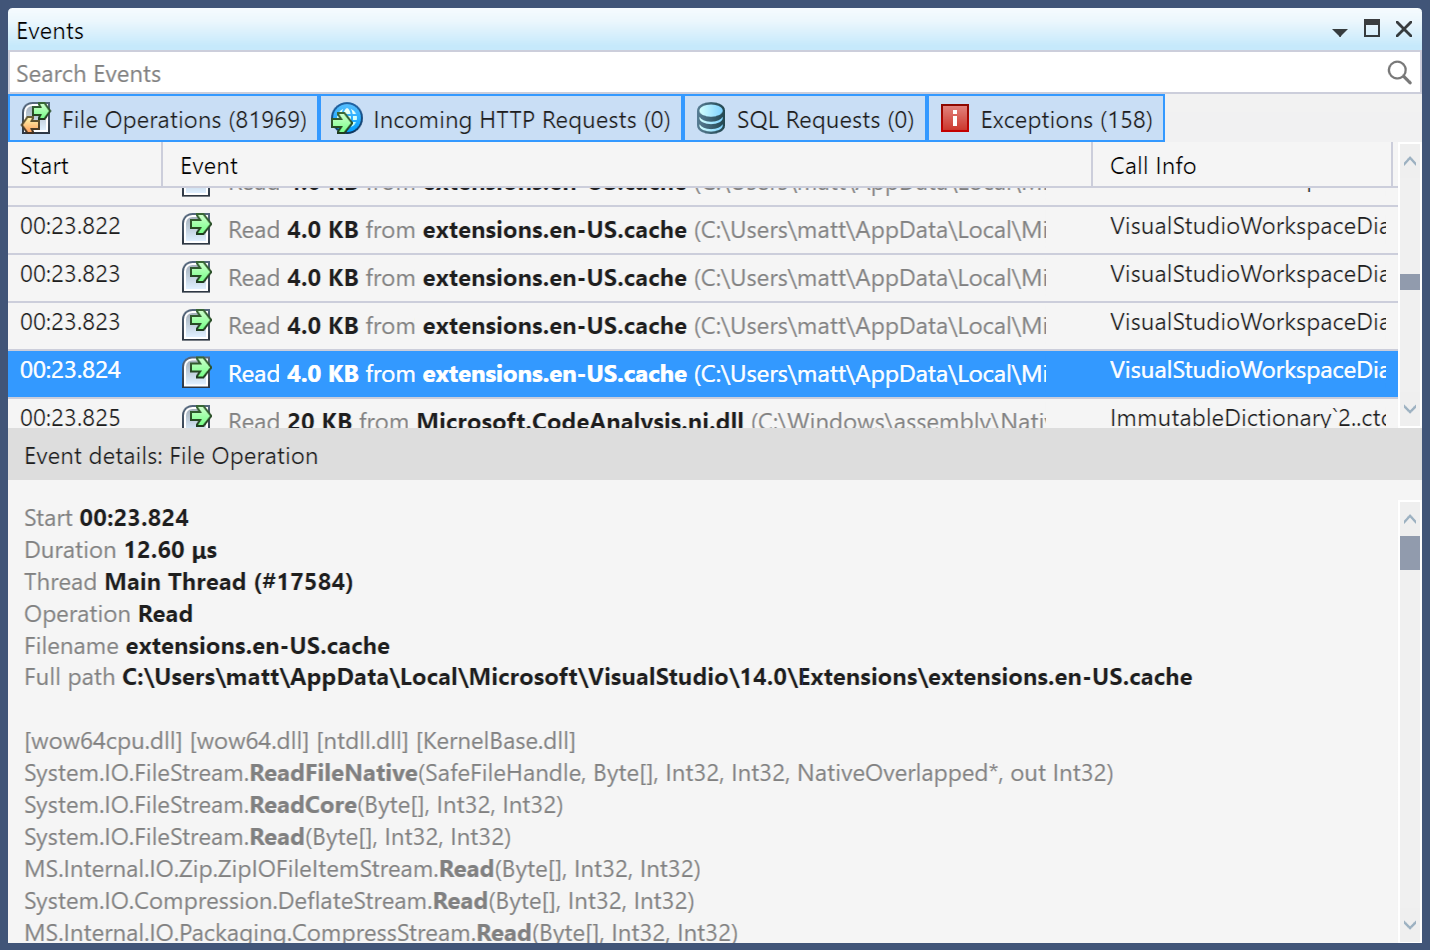
We’ve also added a new Events tool window that aggregates file, HTTP, SQL or exception events that have taken place during the currently selected set of time slices. This is similar to the filters of the same name, but is designed to allow examination of the events, rather than to use them as the filter. Selecting an event will give details of the event, including timestamp, duration and call stack.
ReSharper
This build sees initial support for C# 7.0’s pattern matching in is expressions and switch cases. This is just the start, and more support is of course coming in future builds.
The JavaScript language injections that we introduced in the last build get a little more polished, as we fix Rename and Find Usages, and syntax highlighting should work more reliably, too.
Our tool for speeding up your solution build time, ReSharper Build, is also getting a bit of an update in this EAP.
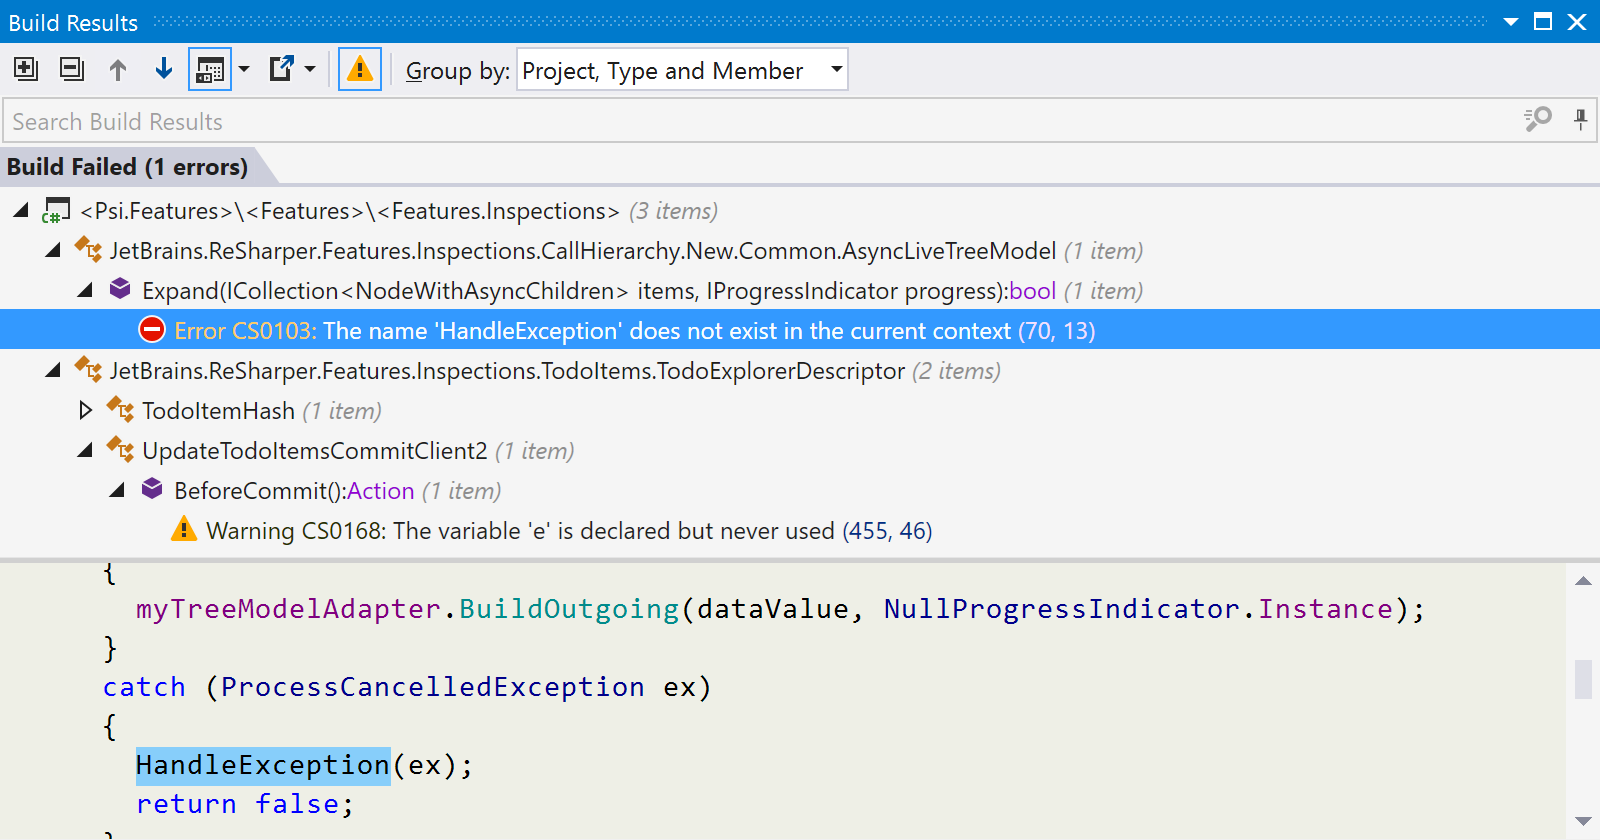
Firstly, the results of a build are now displayed in their own Build Results window, which will list build warnings and errors. Toolbar buttons allow hiding warnings, displaying a preview of the code with the error, and exporting the results to a file.
You get a lot of control over how you want to see the results, too. You can show them as a flat list, or enable grouping, to show by a mixture of project, folder and file. Or you can use ReSharper’s semantic knowledge of the file to group by namespace, type and member.
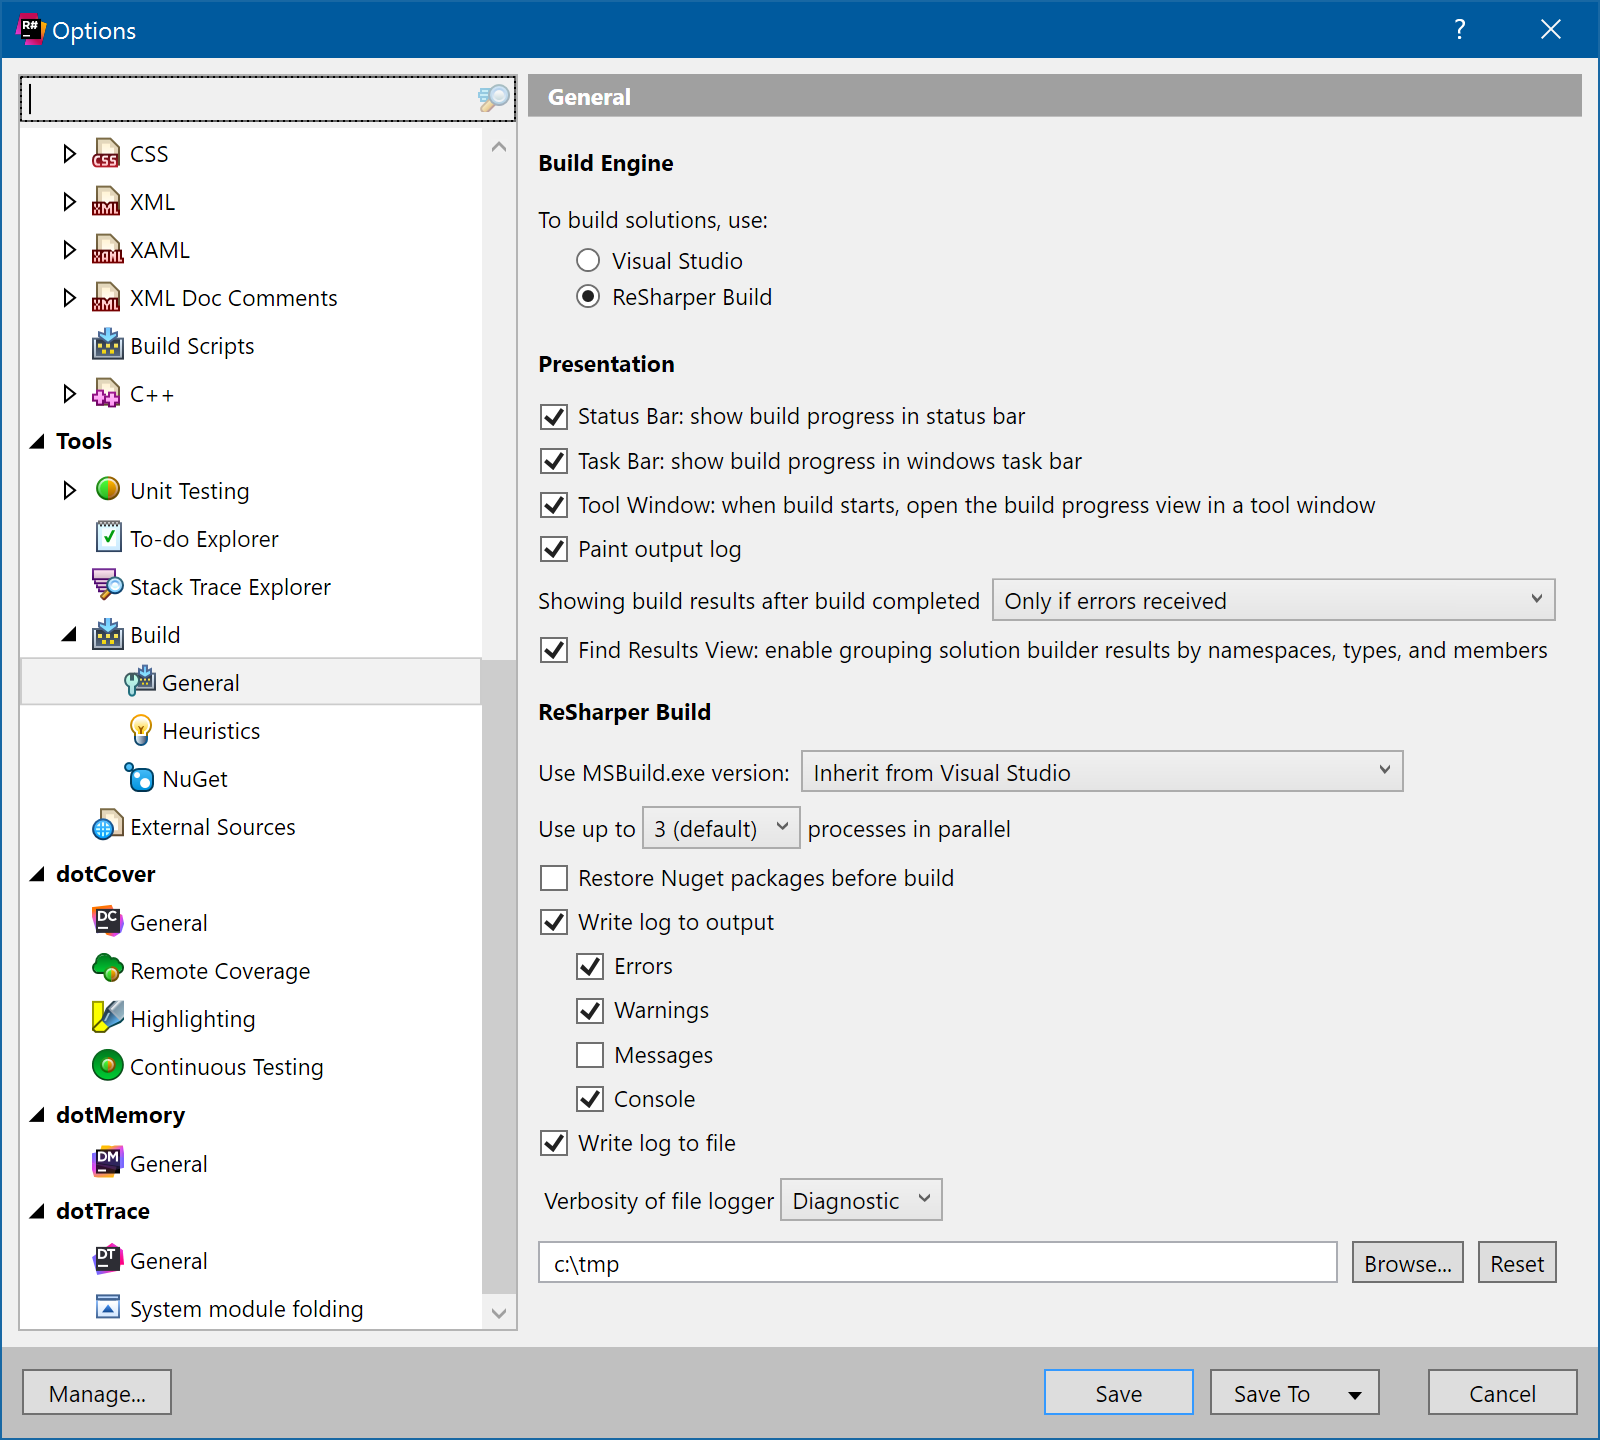
The options are currently being reworked, as well. For example, you can choose when the Build Results window is shown – always, never, only when there are errors, or when there are warnings or errors. We’ve also split the heuristics lists into their own page, and added a NuGet restore log page, to capture output from NuGet restore activities.
The other interesting new option is to log the build to either the Output window, or a file. You get to choose what kinds of messages are output – errors, warnings, messages and standard console output – and of course, the location of the log file.
And ReSharper Build now gets its own implementation of NuGet restore. Previously, we would use Visual Studio’s NuGet integration to perform the restore, but this only worked in Visual Studio 2015. We’ve rewritten this so it now works for all Visual Studio versions. The new NuGet options page allows capturing and viewing log information for restores.
ReSharper C++
The “Third Party Code” options page is proving popular! Introduced for JavaScript and TypeScript in EAP 4, updated to include CSS in EAP 5, and EAP 6 now adds C++ support. Just to recap – this page allows adding files, folders and wildcards to be treated either as “skipped” or “library”. ReSharper will completely ignore “skipped” files, and treat “library” files as read-only – indexed for navigation, but no inspections or quick fixes.
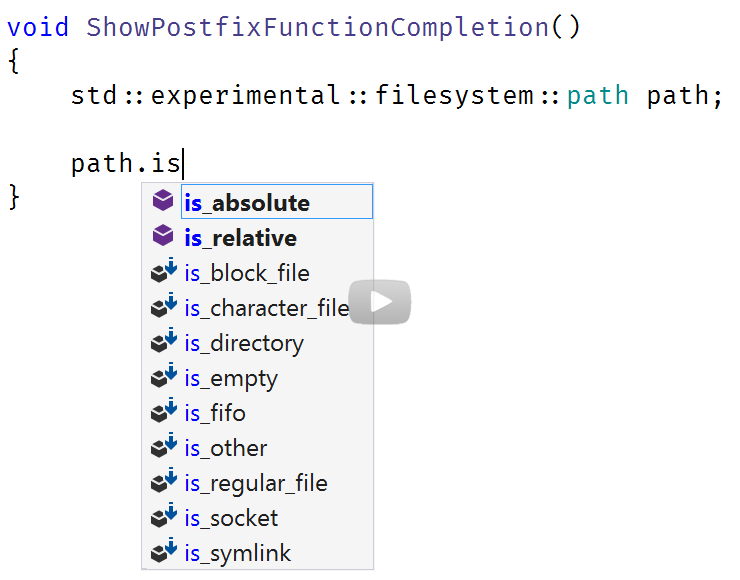
And finally, ReSharper C++ gets a form of postfix completion that is very much like C# extension methods. If you “dot” an expression, ReSharper C++ will now suggest free functions that would accept that expression as the first parameter. When you accept the suggestion, ReSharper C++ will rewrite your code so that the expression is passed as the first argument.
Please download the EAP and give it a go! As ever, if you encounter any issues, please let us know.


