

.NET Tools
Essential productivity kit for .NET and game developers
Simultaneous debugging of JavaScript and .NET code with Rider

Thanks to the concept of Run/Debug configurations, Rider makes it easy to switch between projects we want to debug in the IDE. Using compound Run/Debug configurations, we can even debug multiple projects at the same time (see our debugging series for more about compound run configurations in Rider).
Did you know Rider can also debug front-end JavaScript code that runs in the web browser? Rider makes it possible to debug front-end JavaScript and a back-end .NET project in the same debugger session! Let’s see.
Open the browser when running a web application
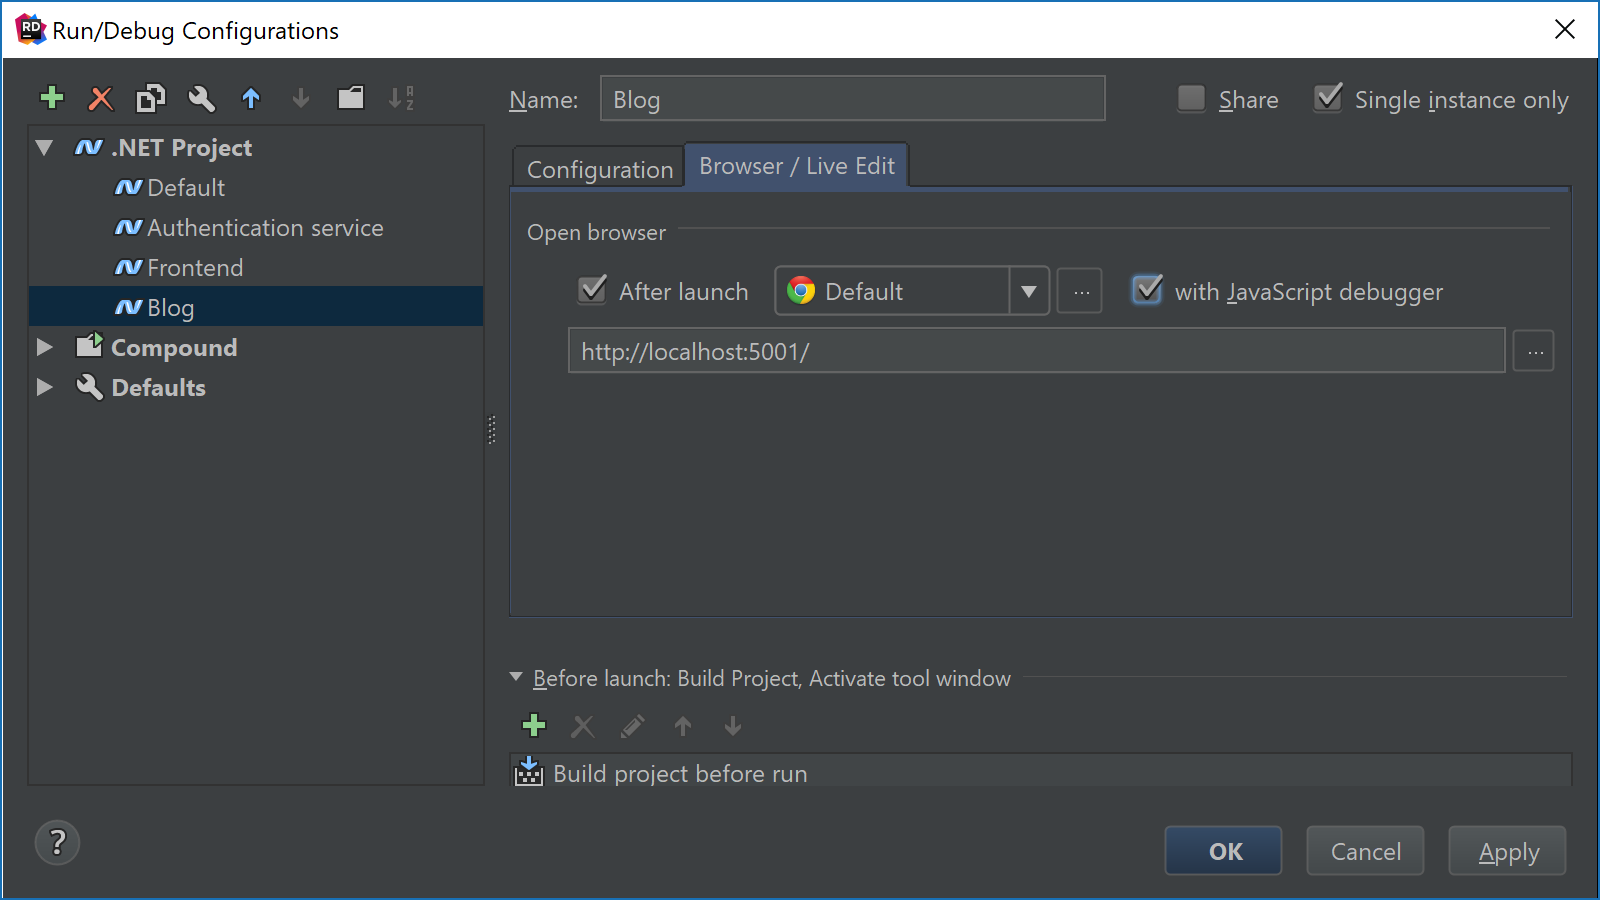
When debugging web applications, it may be useful to launch the web browser and navigate to a the URL of the application being debugged. Rider’s Run/Debug configurations now have a new Browser tab where we can enable this functionality. We can pick the browser to open and set the URL to navigate to:
When we now debug our .NET project (F5), Rider will automatically open the browser at the URL we configured.
Debugging JavaScript that runs in the browser
We can edit our Run/Debug configuration and enable the with JavaScript debugger setting. This effectively makes Rider become the Chrome debugger!
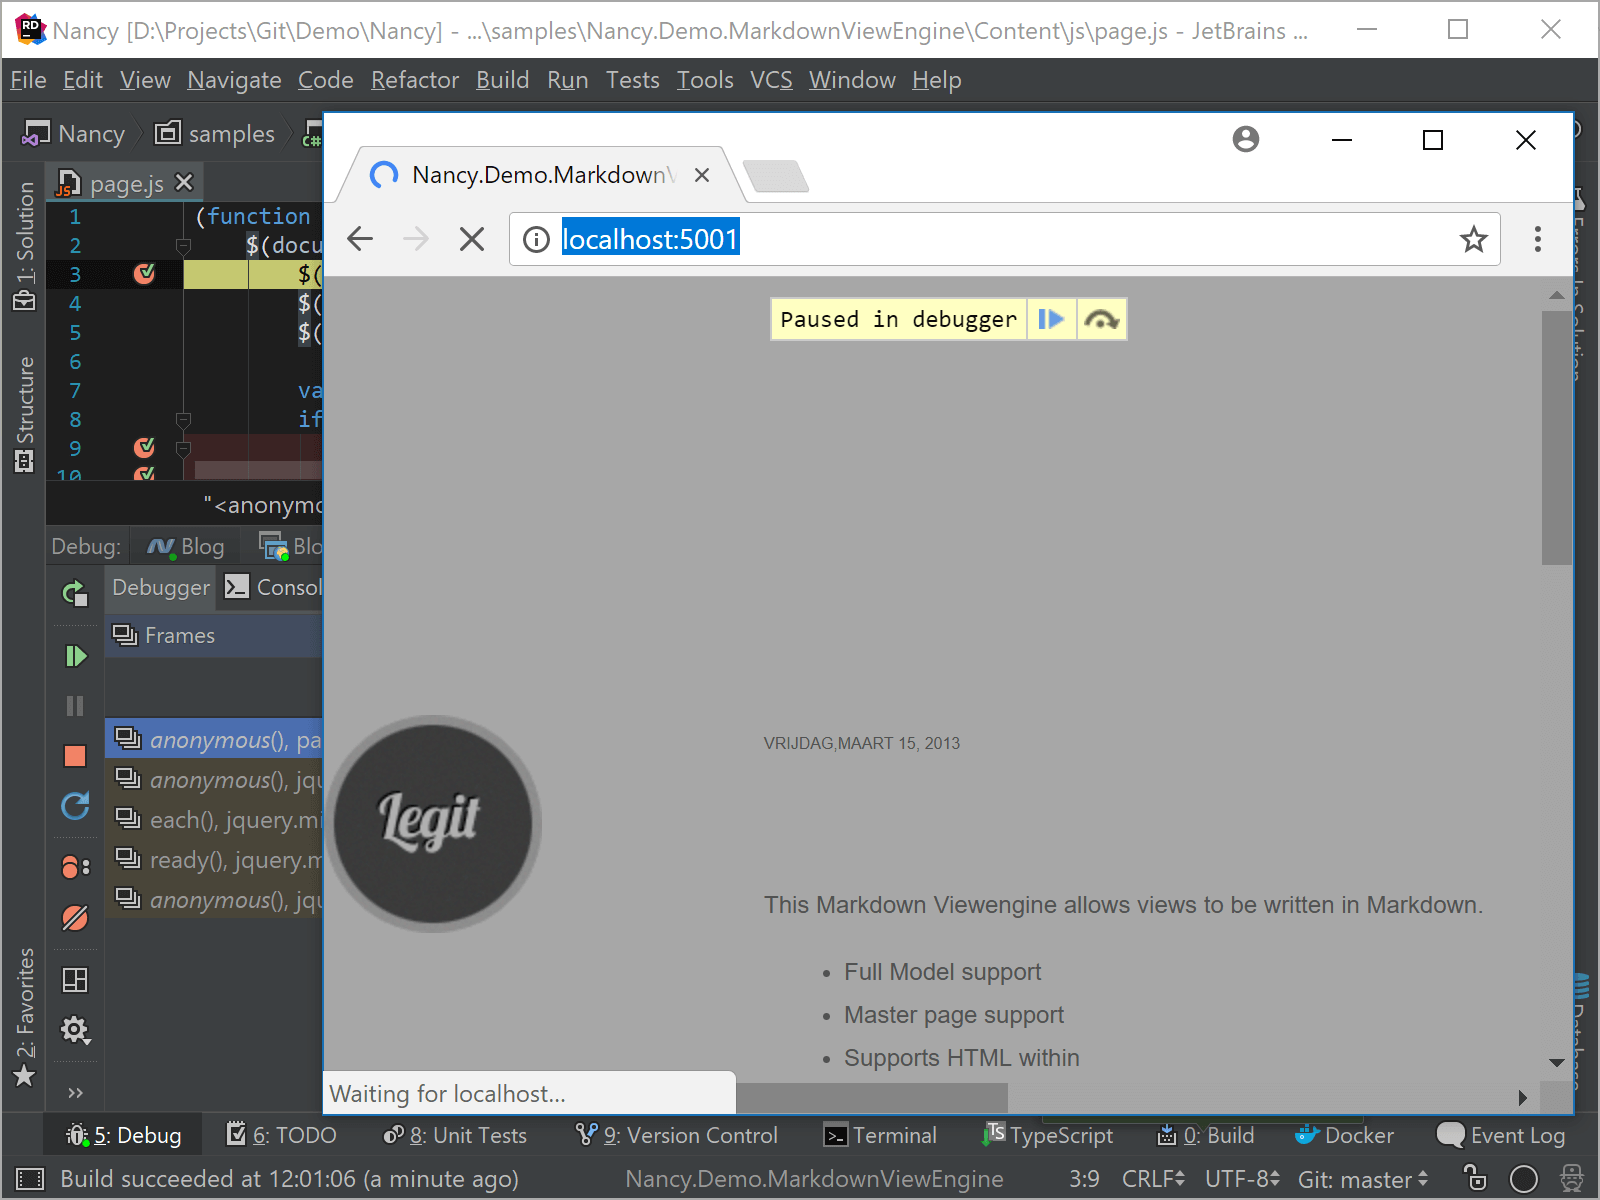
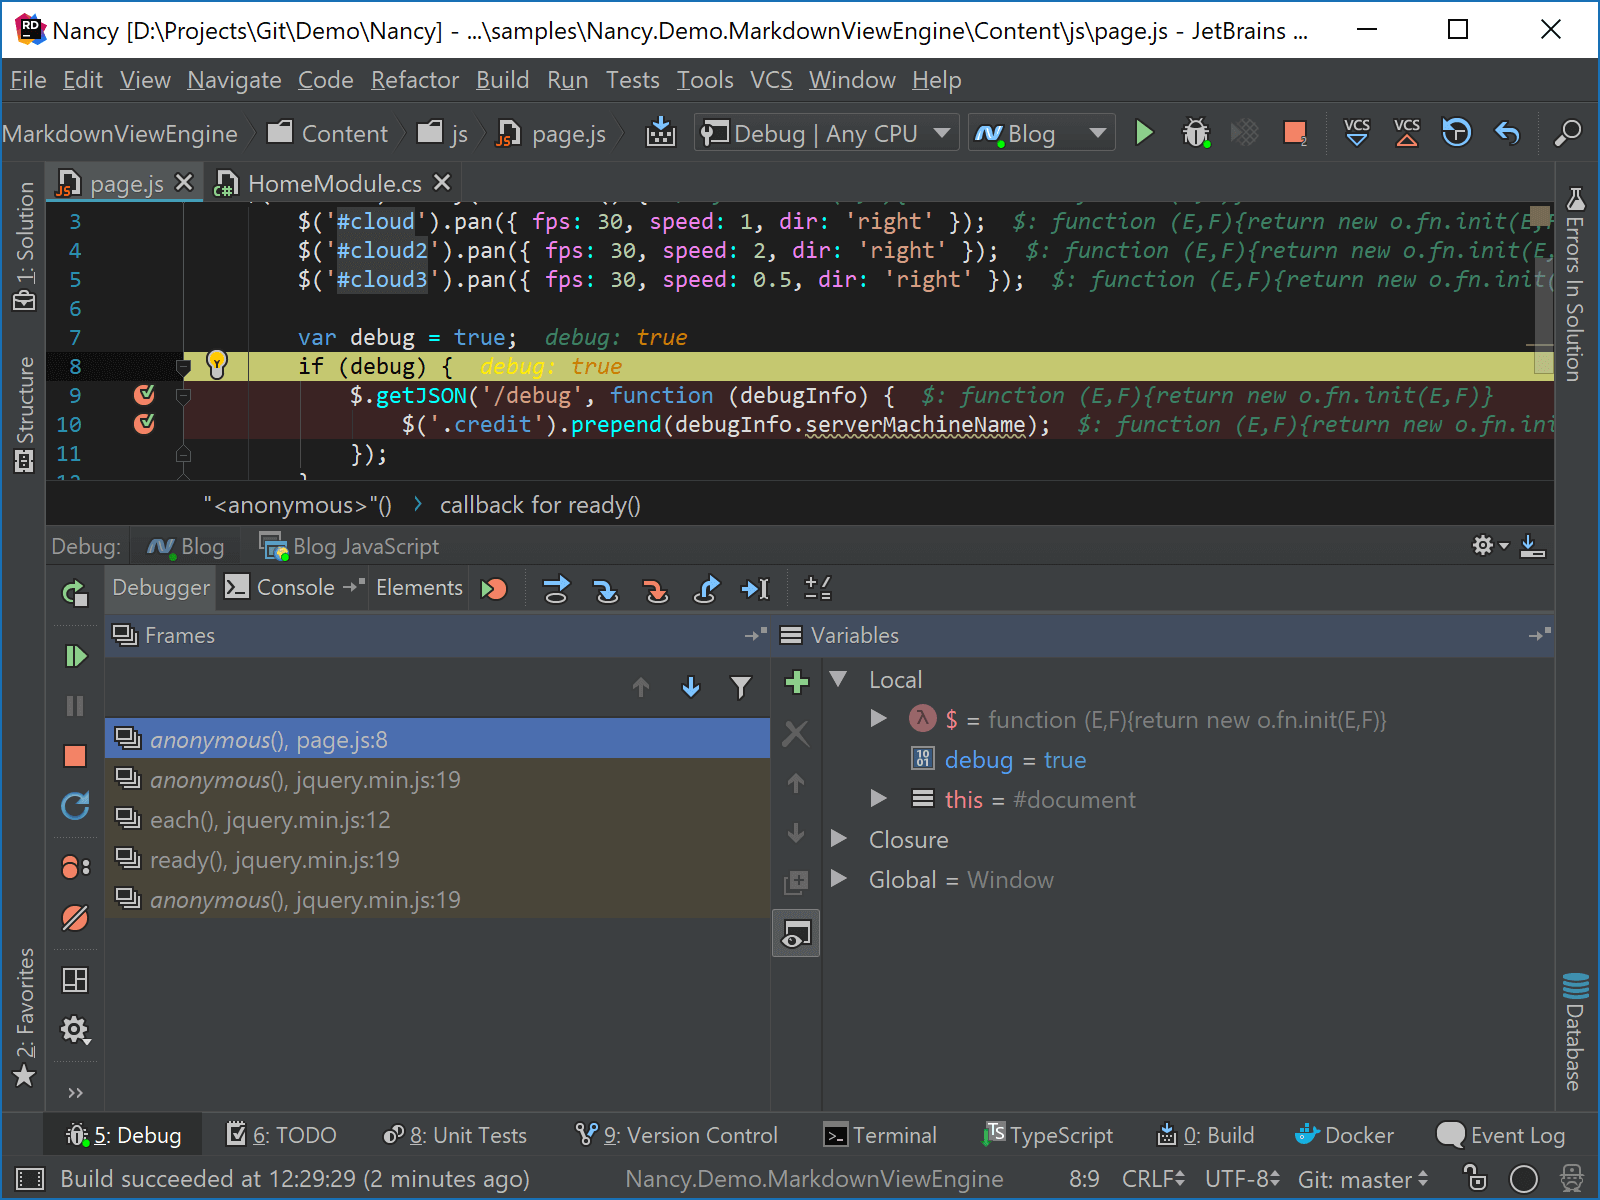
Rider now lets us place breakpoints in any JavaScript file we have in our application. It will pause execution and give us the opportunity to explore variables, look at the call stack, check loaded scripts, use the console, and so on.
Using TypeScript or minimizing JavaScript files? No worries: Rider uses source maps (when available) to grab the original code – more details are available in the WebStorm docs.
Note that debugging code that runs in the browser currently only works for JavaScript and TypeScript files. Debugging JavaScript code that is embedded in .cshtml files is not yet supported.
Debugging front-end JavaScript and back-end .NET code simultaneously
When starting the debugger for a .NET project that has JavaScript debugging enabled, Rider in fact starts two debugger sessions: one that attaches to the Chrome debugger, and one that is connected to our running .NET application.
Using that knowledge, we can place breakpoints in both front-end JavaScript code and back-end .NET code. Rider will easily jump between both and allows us to track calls coming from JavaScript into a .NET web API, and back – letting us simultaneously debug both parts of our application!
Download Rider and give it a try! We’d love to hear your feedback!


