

.NET Tools
Essential productivity kit for .NET and game developers
Run/debug configurations in Rider

Rider comes with a great debugger which allows attaching to a new or existing process and lets us place breakpoints to pause the application at a breakpoint and see what is going on while executing our code.
In this three-post series, we’ll look deeper at what we can do with Rider’s debugger and how it can help us debug our code as efficient as possible. In this series:
The table of contents will be updated as we progress. Keyboard shortcuts described in this post are based on the Visual Studio keymap.
In our previous post about debugging, we’ve seen how we can run and debug a .NET project and set a breakpoint to inspect the call stack and variables that are currently in scope and how we can step through code. All of this is possible thanks to the concept of run/debug configurations — for both normal applications as well as unit tests. A perfect topic for a blog post in our debugger series!
What are run/debug configurations?
Rider uses the concept of Run/Debug configurations to define how one or multiple projects should be run and debugged. When first creating or loading a project in Rider, a default run configuration is created based on the project type, which should provide “F5” support – run/debug the application – with minimal configuration required.
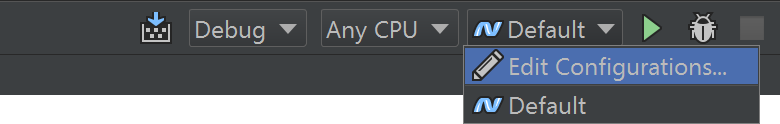
It’s useful to look at run/debug configurations in a little more detail as there are a few things that can help during debugging. Let’s start with the basics and look at the Default run/debug configuration from the Run | Edit Configurations… menu, or from the toolbar.
The window that opens lists all configured run/debug configurations. We can see the default configuration tells Rider to:
- Launch a project from our solution (in this case
Nancy.Demo.Authentication.Forms) - Target a specific framework (in this case .NET 4.5)
- Launch the project using IIS Express, with a series of arguments
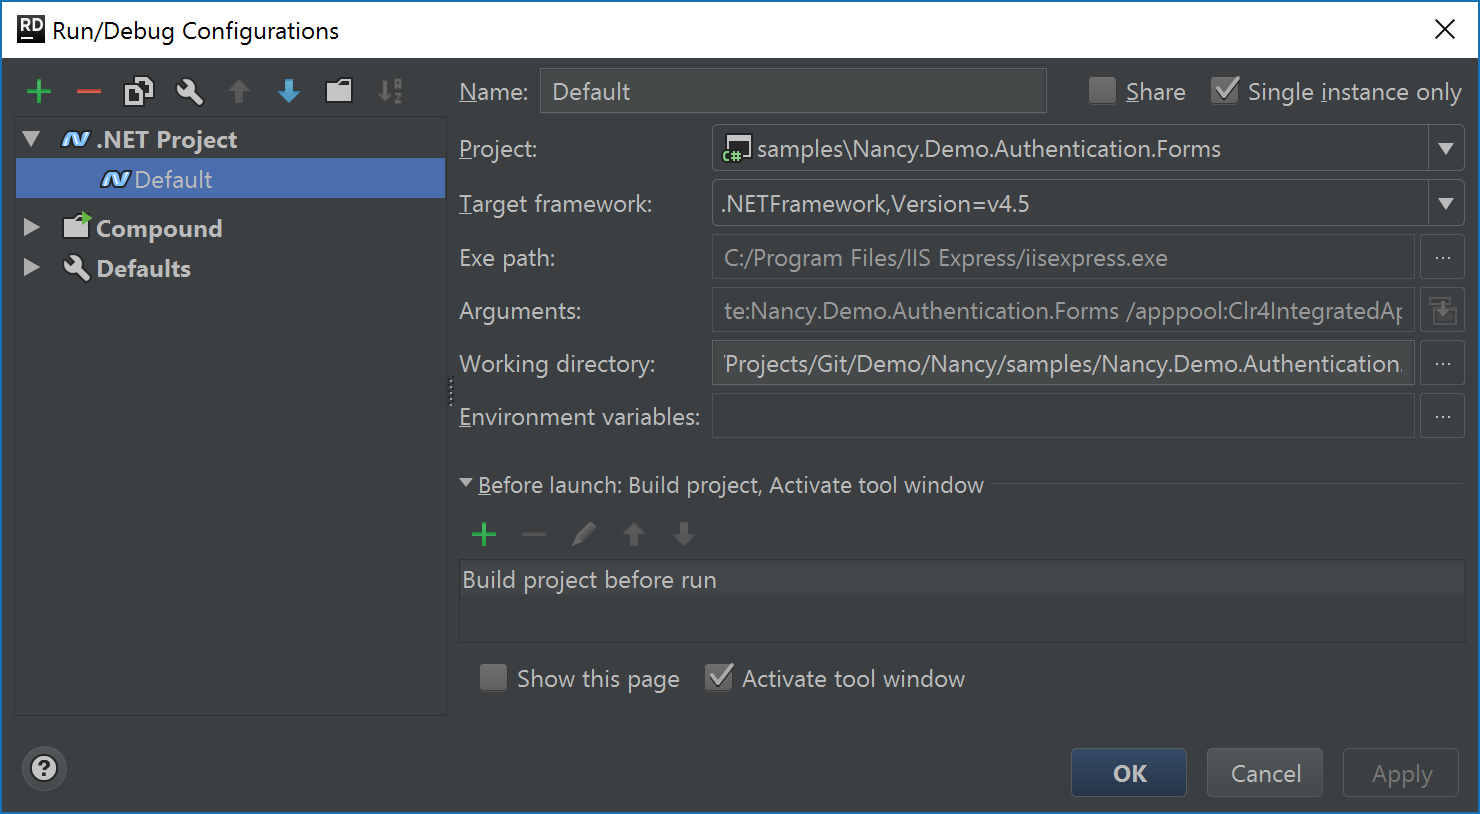
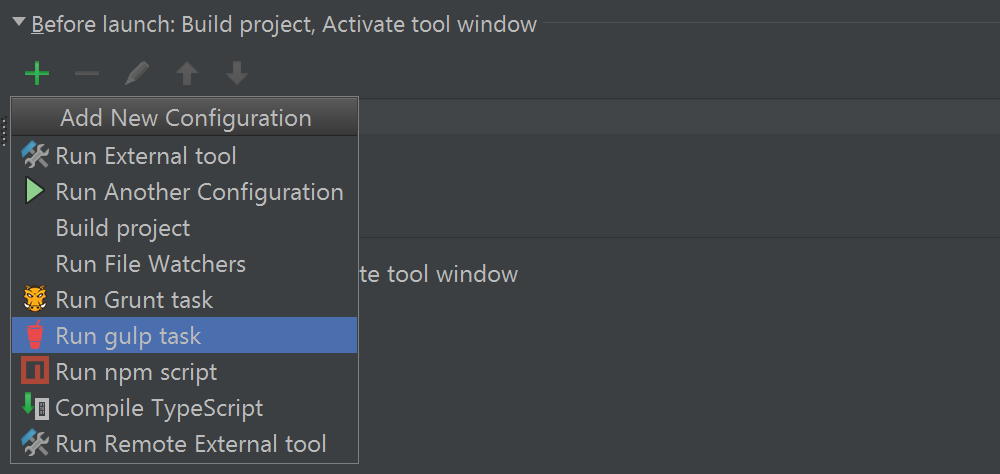
Optionally, we can set environment variables for the process that is launched, or add a “before launch” step which lets us run a given task before running or debugging our project. This task could be running an external tool, starting another run/debug configuration, running Grunt or Gulp, compiling TypeScript and more.
From the toolbar, we can add new run/debug configurations. Rider comes with many different types, depending on the project or task to perform when debugging. Obviously, running a .NET project or application is supported but other run/debug configuration types are available too, e.g. for running a JavaScript application, npm, Xamarin app, … Have a look at them, there are a couple of nice ones (like Spy-JS for JavaScript-based applications, which gives great performance and runtime insights) or performing a Docker deployment.
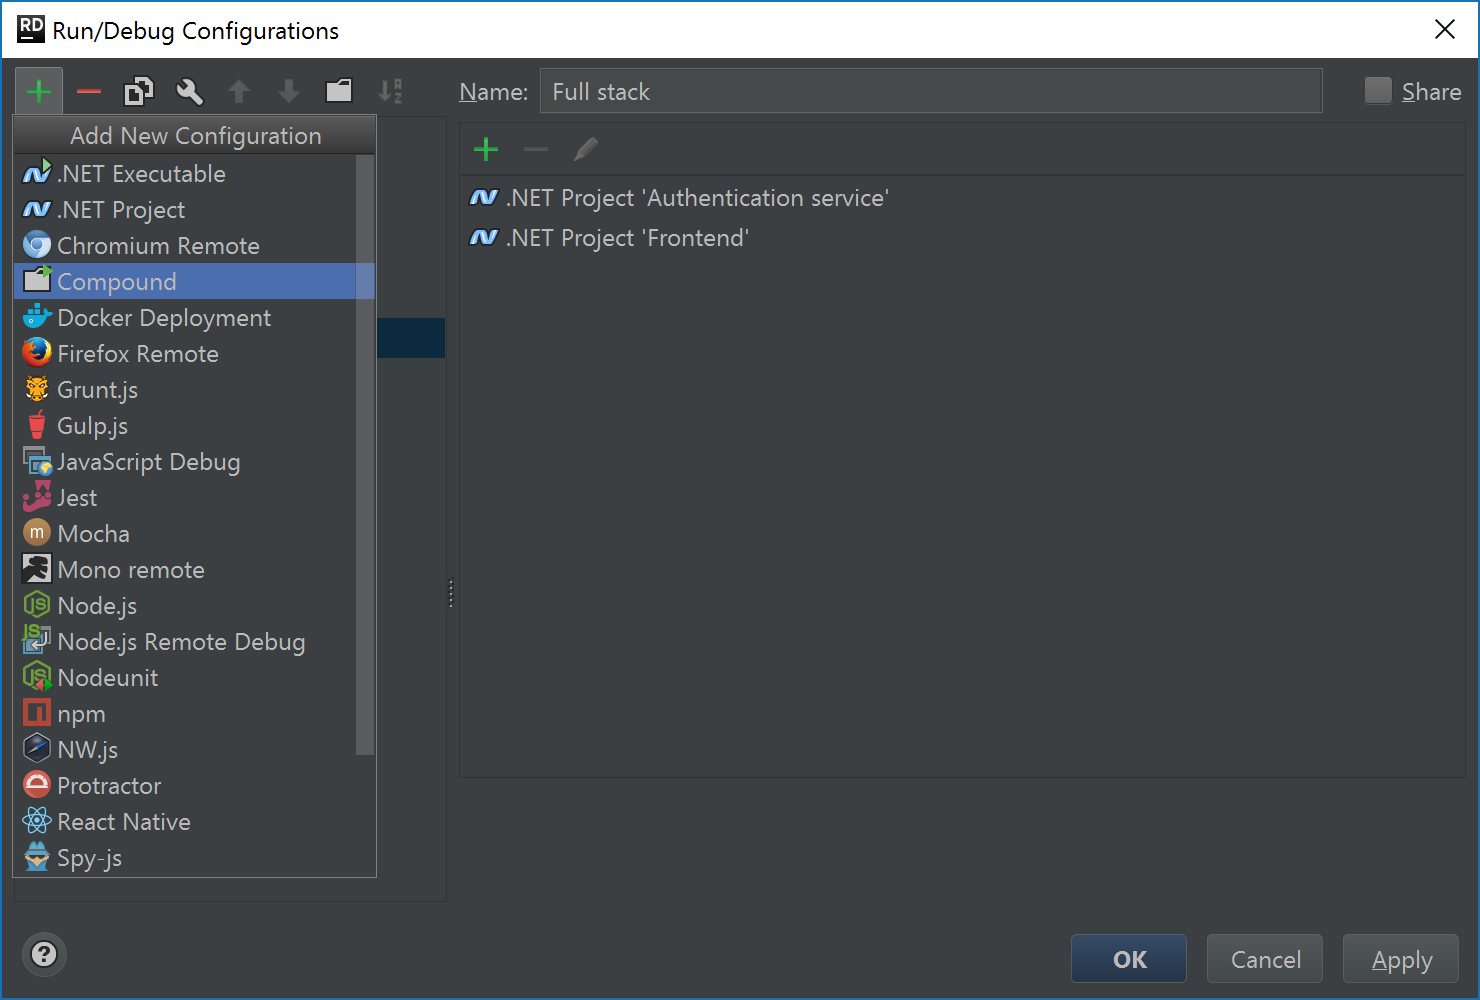
For .NET and .NET Core, there are a few specific run/debug configuration types that can be added:
- .NET Executable – runs a .NET executable based on path, working directory and optional command line arguments.
- .NET Project – runs a .NET executable project using a specified target framework. Rider figures out the project output directory from where the project should be started. Optionally, command line arguments can be specified. For .NET Core projects, Rider will automatically call the dotnet executable from the .NET Core SDK (configured in Rider’s settings).
- Compound – a run/debug configuration that can start two or more other run/debug configurations.
The Compound run configuration is very useful to run/debug e.g. a front end web application and a backend REST service at the same time. With the debugger attached, this lets us set a breakpoint in any of the projects and we can debug the entire flow of our application:
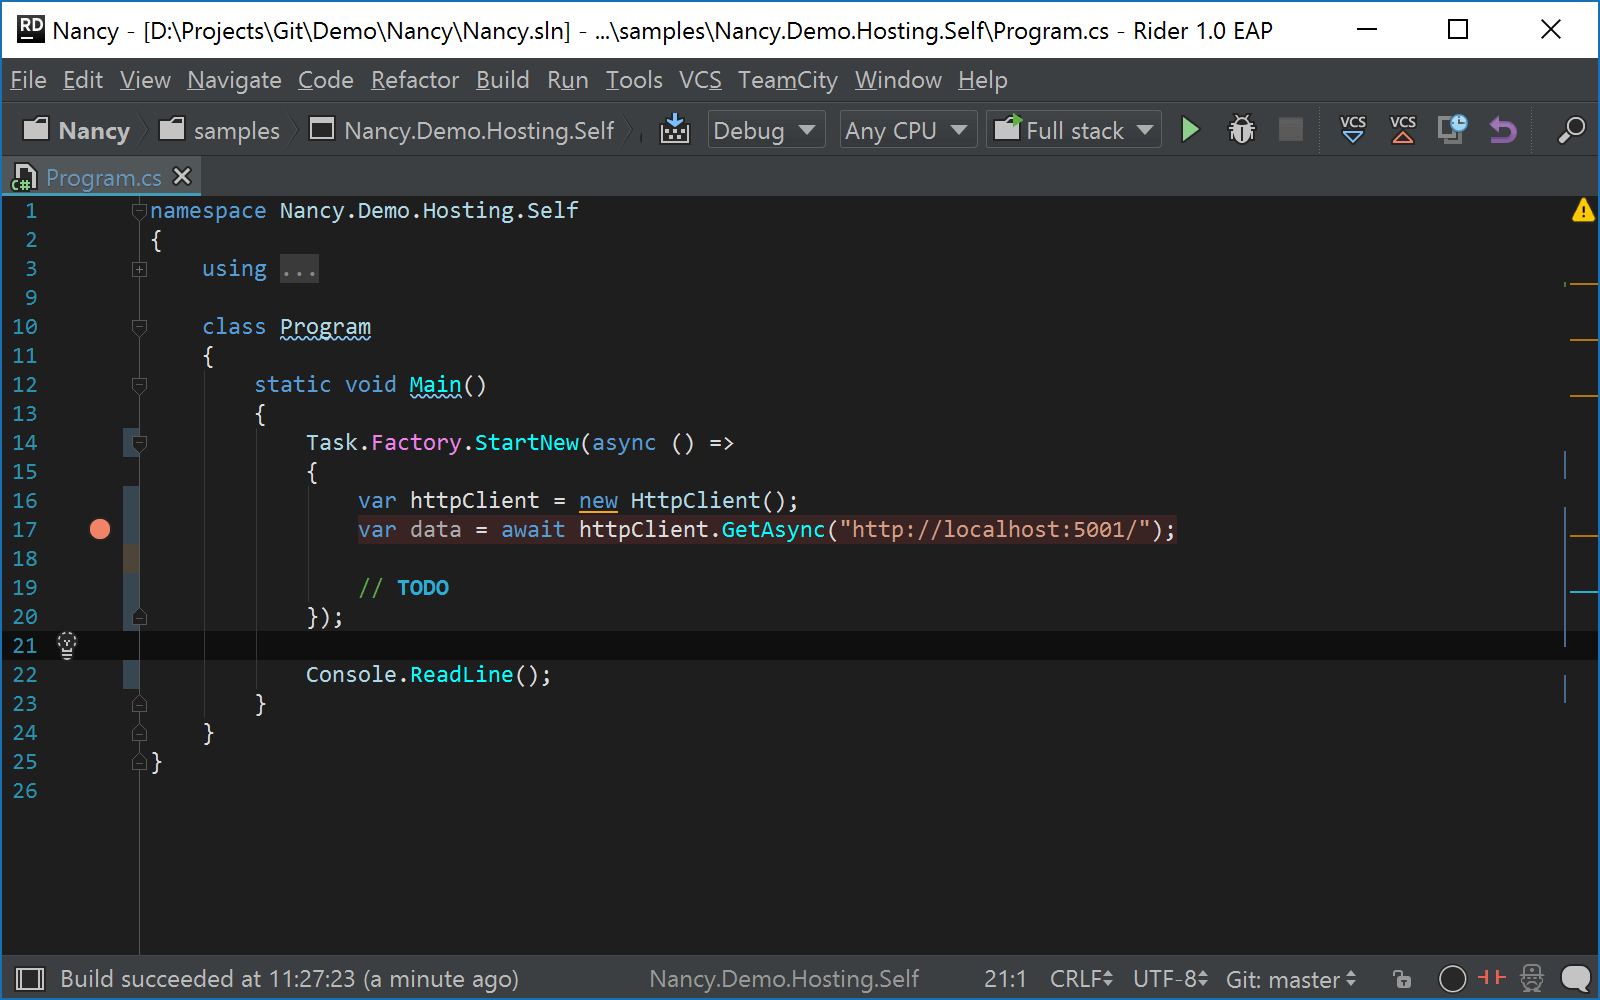
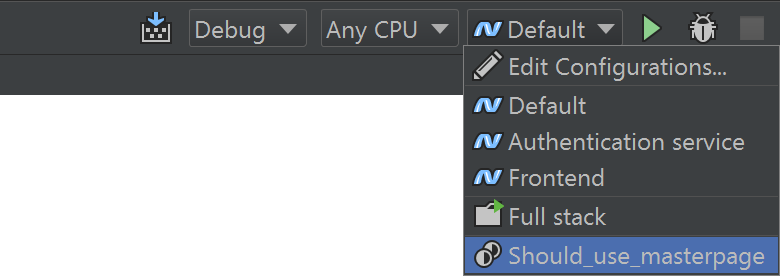
Once a configuration has been created, it is added to the toolbar at the top of the main window, and can be started from there. Either using the Run menu, the toolbar buttons, or by pressing Ctrl+F5 (Run) or F5 (Debug).
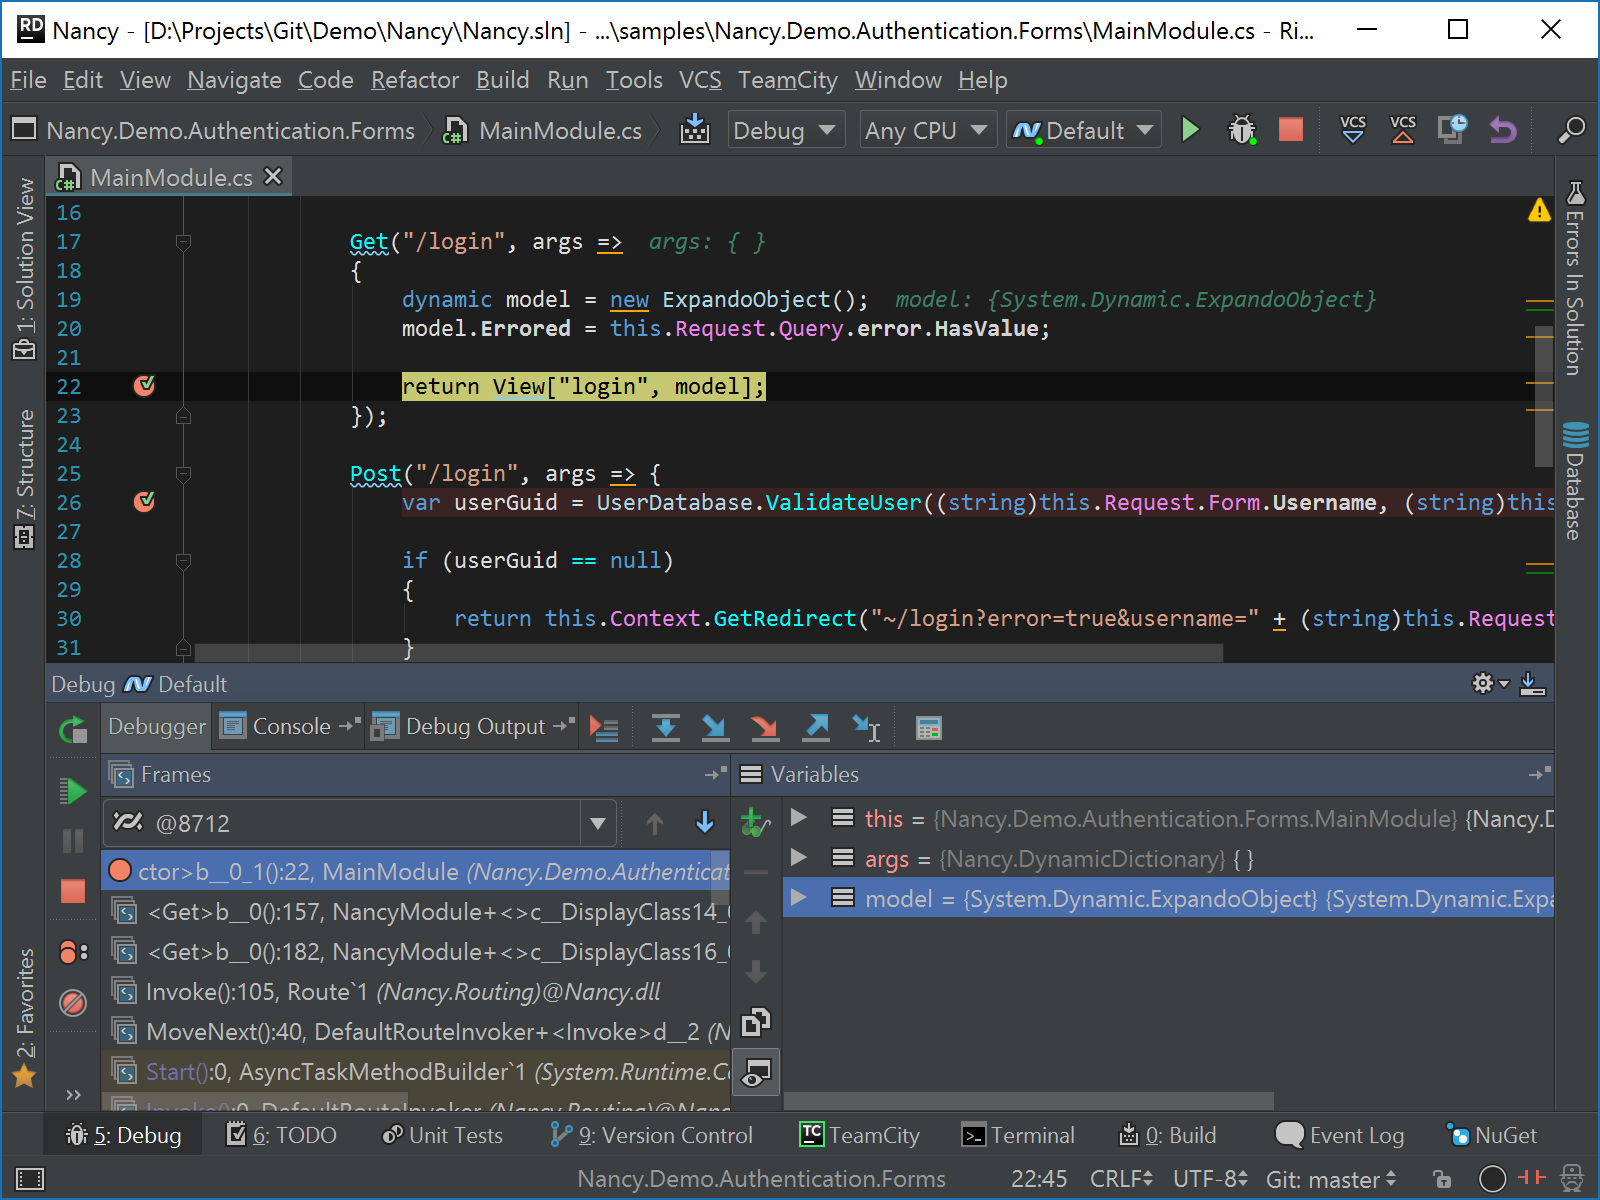
When our application is running, the Run tool window will display process output. When debugging, the Debug tool window is shown where we can inspect what our application is doing, what the values of variables in scope are, and so on.
Debugging unit tests
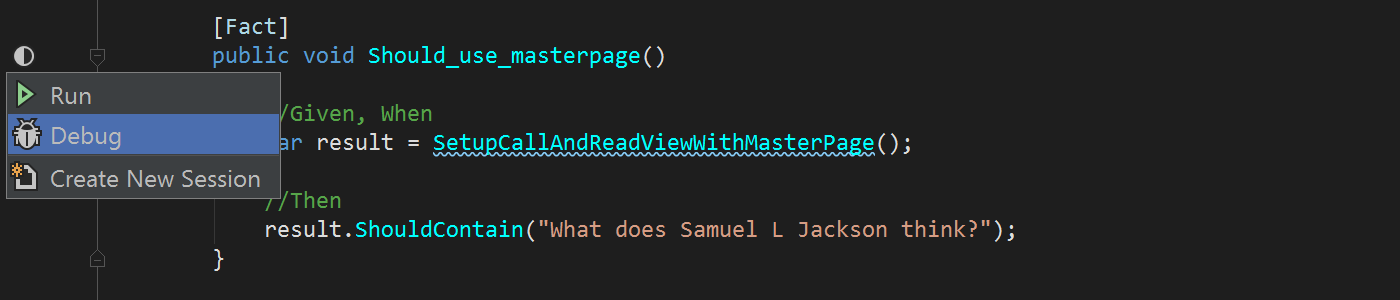
We don’t always want to start and debug our entire application. Sometimes, being able to run/debug a simple unit test is sufficient. Rider’s unit test runner supports debugging as well. For any unit test (or unit test class), the left gutter will display a little icon from where we can run or debug our test.
In our application and unit test code, we can add breakpoints just like when doing regular debugging. Rider will pause execution whenever needed by a breakpoint, and provides us with insights into call stack, variables and all that.
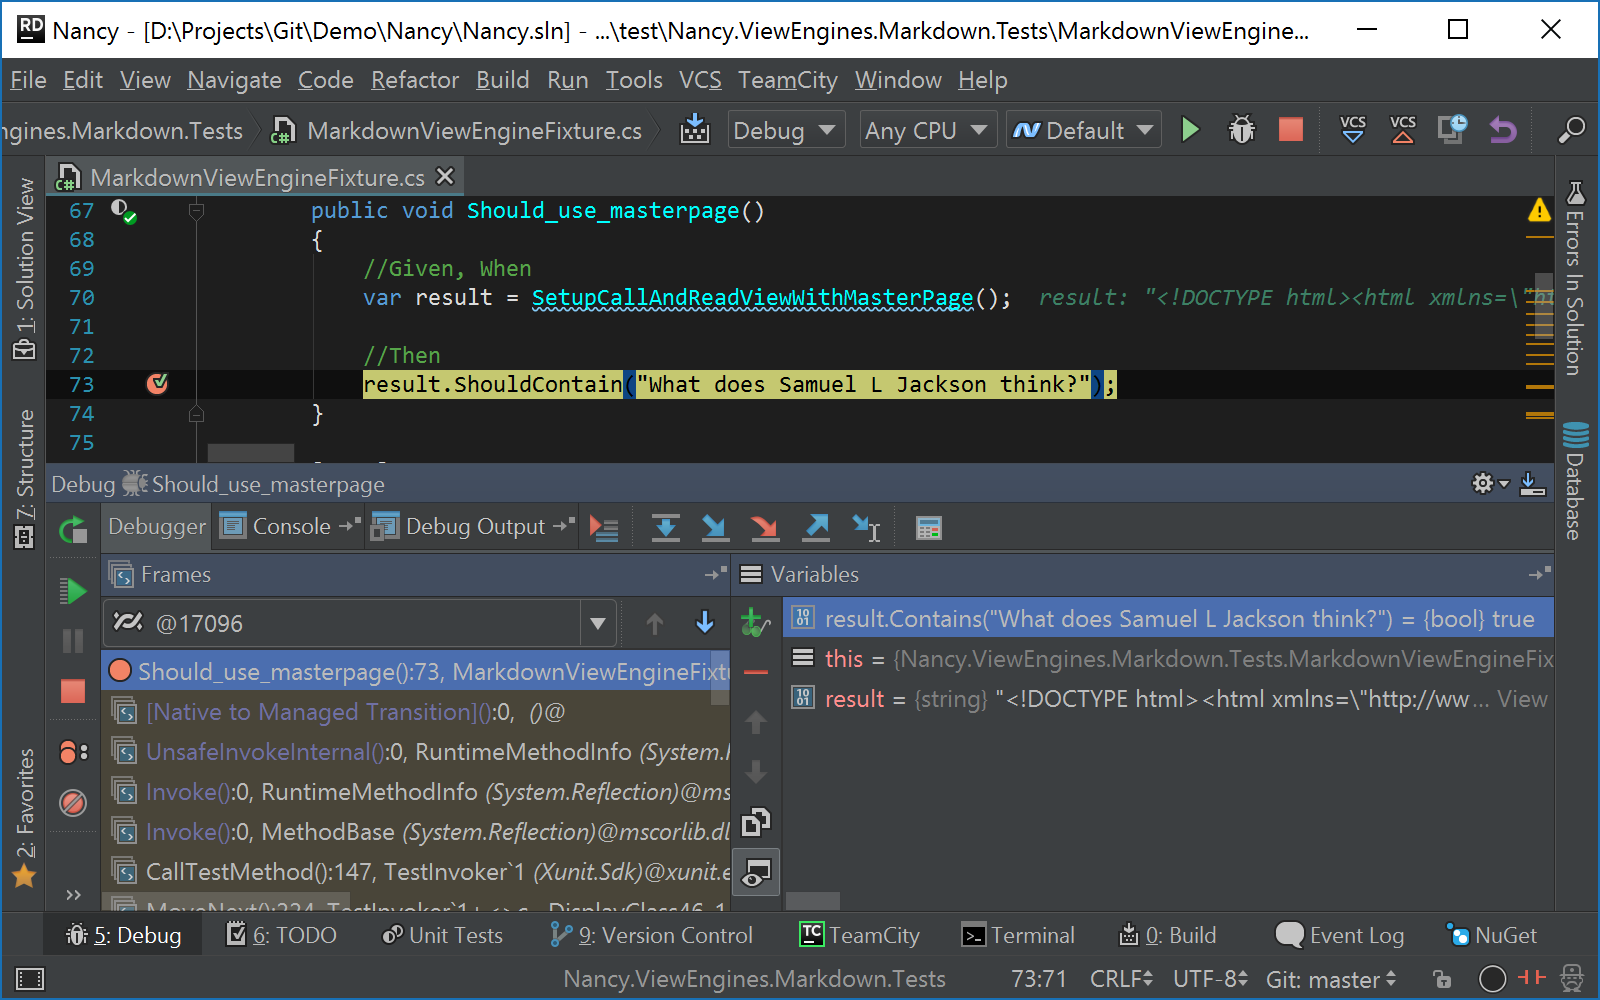
A nice touch is that when we launch tests, a run/debug configuration is also created for them. This lets us use the dropdown from the toolbar to quickly run or debug tests we’ve launched before:
Attach to process
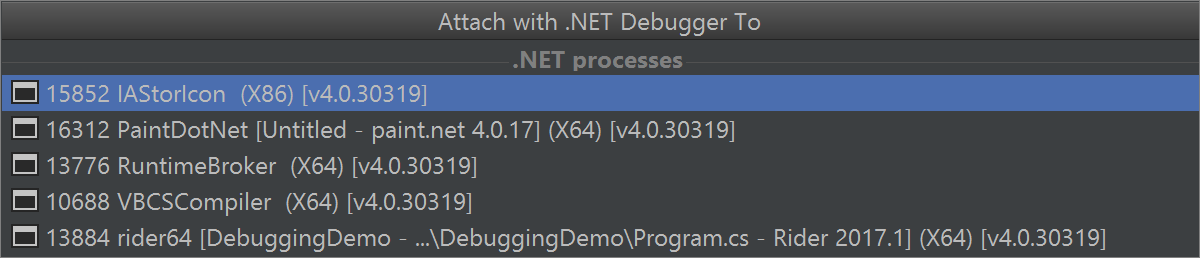
Another way to start the debugger is attaching it to an already running process. From the Run | Attach to Local Process… menu, we can attach to any running (.NET) process on our machine. If the process has PDB’s and we have the sources on our system, we can break the process at any point in time and look at what is happening at the current point of execution.
In this post, we’ve seen run/debug configurations and how they can help in starting to debug our applications. We’ve seen how we can debug our unit tests and how we can attach to an already running .NET process.
In our next post, we’ll go deeper into the various types of breakpoints: there are many interesting things we can do with them, beyond just pausing our application! Stay tuned to learn about exception breakpoints, hit counters and automatic enabling/disabling of breakpoints based on conditions!
Download JetBrains Rider and give it a try! We’d love to hear your feedback.


