

.NET Tools
Essential productivity kit for .NET and game developers
Debugging third-party code with Rider – now in Mono!

Back in December, we announced a really cool feature – the ability to seamlessly debug third party code in Rider. No need for a .pdb file, just hit F11 and step in – Rider will decompile the code on-the-fly, and boom! you’re debugging, just like that. A fantastic feature, but only available for .NET Framework and .NET Core.
With the recent release of Rider 2017.3.1, we’ve updated this to also work with Mono, which brings this feature to all runtimes, on all platforms. That means Windows, Mac, Linux, .NET Framework, .NET Core, Mono and of course, Unity.
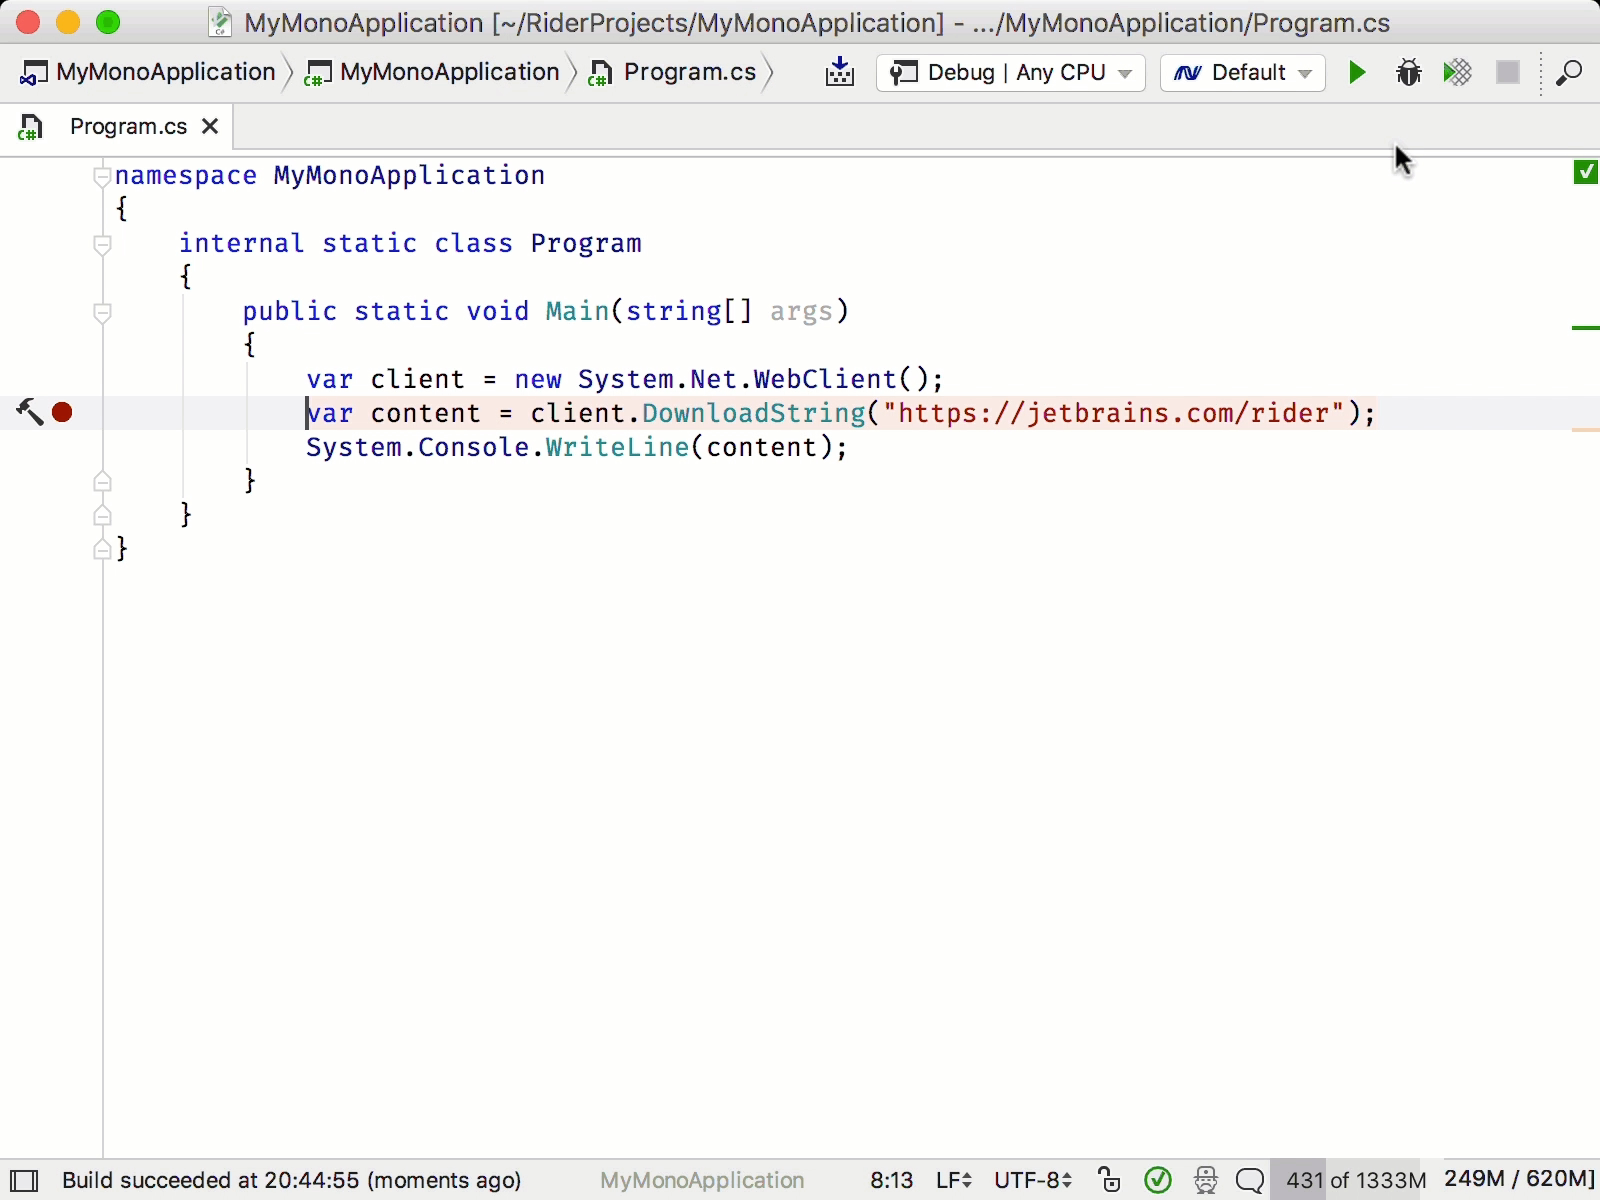
The experience and features for Mono are just the same as for the .NET Framework and .NET Core. You can navigate to decompiled code and add a breakpoint, or decompile the call stack on-the-fly, and even add breakpoints when attaching to running processes. For more details, please see the original announcement post.
And yes, we’re still intending to implement SourceLink support and downloading symbol files from symbol servers in a future update. In the meantime, download Rider 2017.3.1 and give it a go. And of course, you can also use the Toolbox app to always keep up to date with the latest versions of Rider.


