

.NET Tools
Essential productivity kit for .NET and game developers
Exception popup, improved Smart Step Into, symbol servers, and more Rider 2018.1 EAP debugger updates

The first build of the Rider 2018.1 EAP comes with a series of improvements for the debugger. We’ve added a new exception popup, improved Smart Step Into, third-party code can now be debugged using external symbol servers and SourceLink (or via decompilation), we now display source code for return value locals, the process username is displayed in the attach window, and several fixes were made to existing debugger functionality. More than enough to dig a bit deeper!
Exception popup
Up to this point, Rider already provided several ways to look into an exception, helping us figure out why a given exception is causing trouble in our code. Using Exception Breakpoints, Rider lets us explicitly tell the debugger to suspend the program execution when an exception of a particular type is thrown, and gives us the possibility to explore details for that exception from the Debug tool window.
In Rider 2018.1 EAP, we are adding another, simplified way of exploring (unhandled) exception details when things go wrong: the Exception popup. It shows us basic info about the exception that was thrown. We can continue running the application being debugged, or explore more details in the Exception details tool window:
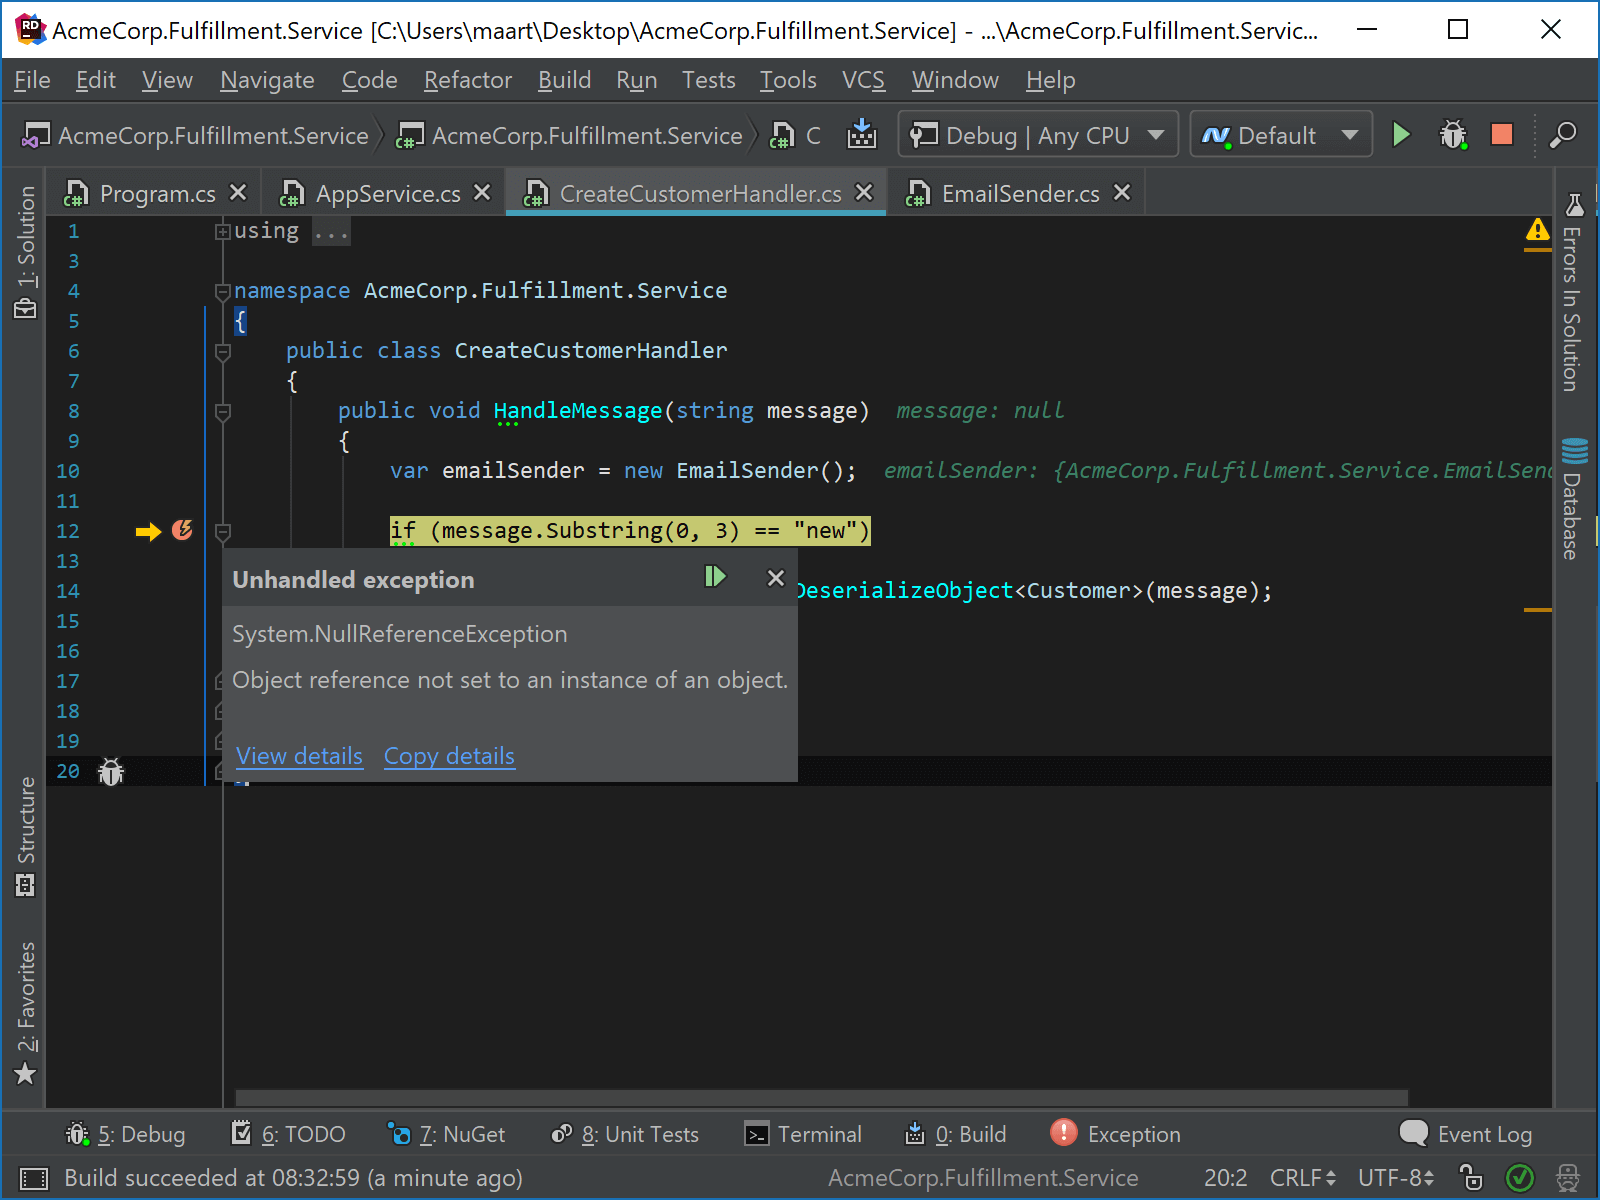
Note: In case you did not know this one yet: when copying an exception stack trace (e.g. from an ASP.NET application) to the clipboard, Rider allows exploring and navigating from that stack trace to the exception location.
Improved Smart Step Into
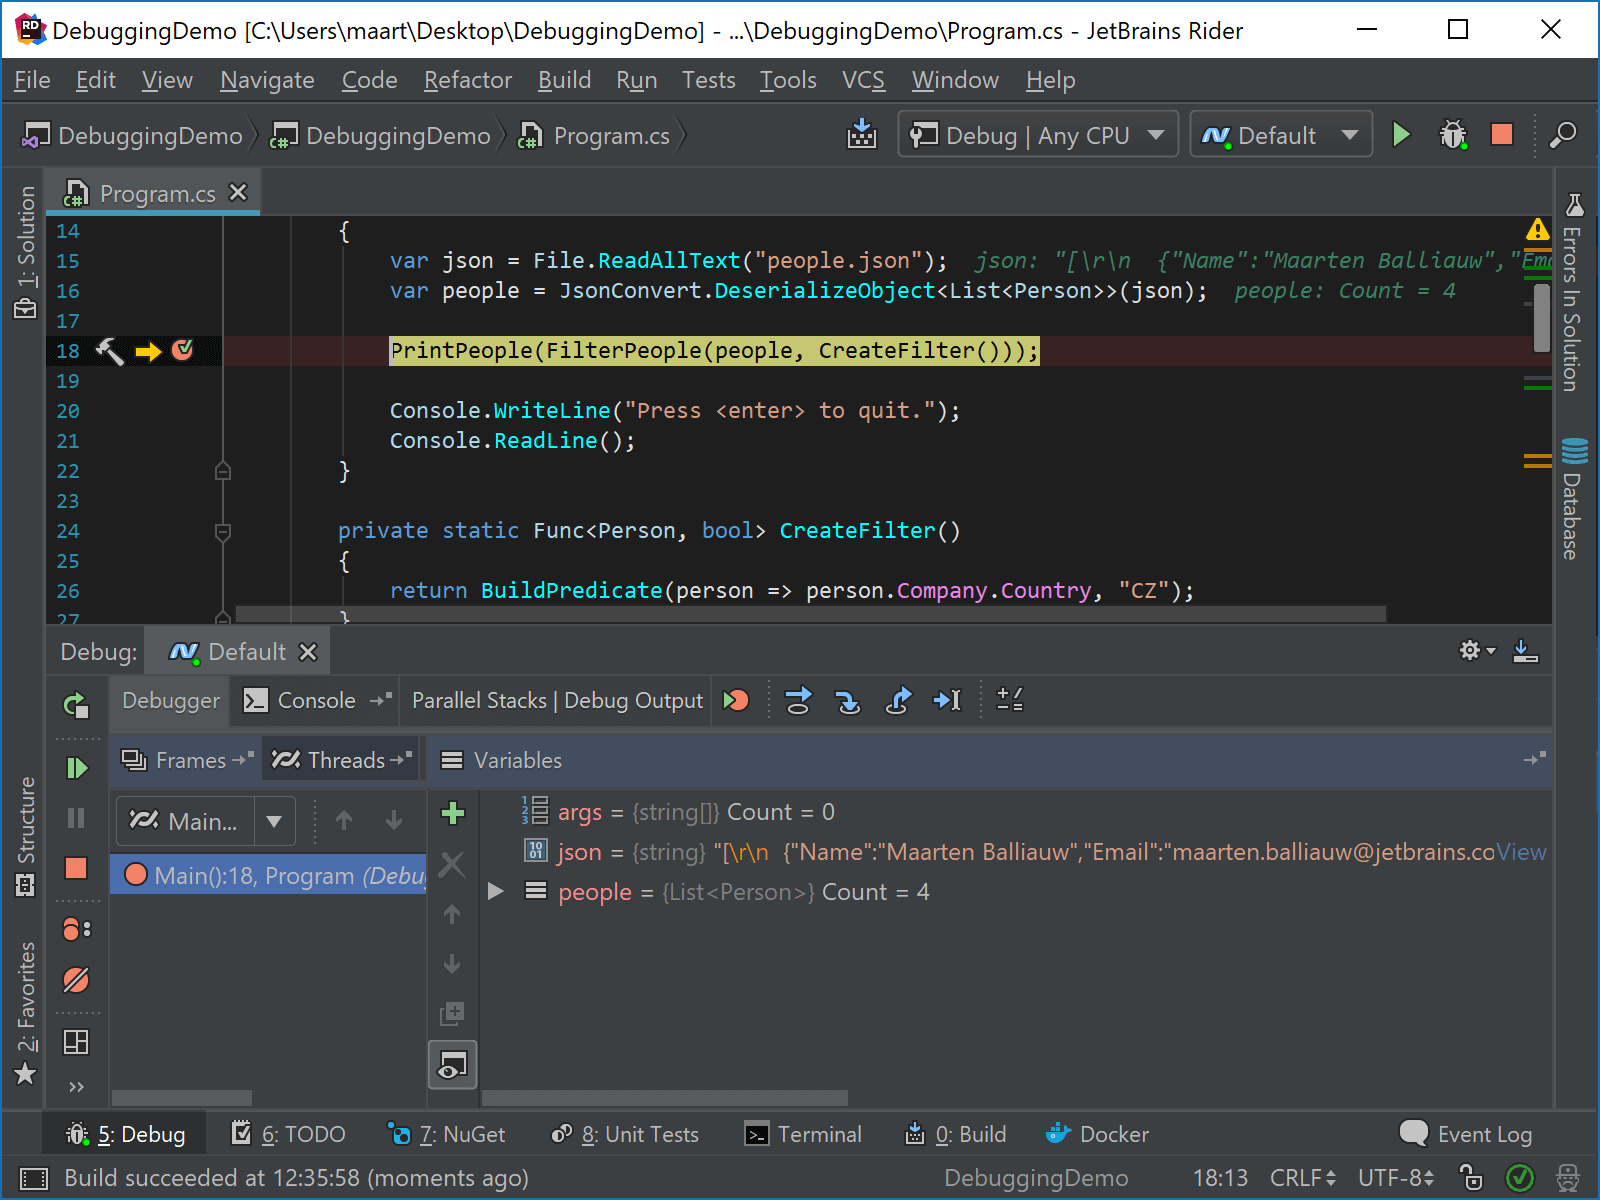
Smart Step Into makes it easier to debug lines of code that contain multiple statements. Let’s take this line of code as an example:
PrintPeople(FilterPeople(people, CreateFilter()));
If we’d want to step into FilterPeople(), we’d first have to step through CreateFilter() before we get to the method we want to debug, which is cumbersome as we have to mentally context-switch through another method than the one we wanted to debug.
Using Smart Step Into (Shift+F7), Rider lets us step into the method we are interested in, helping us keep focus on the task at hand, instead of having to follow the entire call chain.
Rider 2018.1 makes Smart Step Into more accurate and is combined with Set Next Statement so that already executed calls can be executed again if the need arises!
Symbol server support (and SourceLink)
Back in December, we announced a really cool feature where Rider lets us seamlessly debug third party code. Just hit F11 and step into. Rider decompiles the code on-the-fly, and immediately lets us debug external code without needing a .pdb file!
But what when we do have a .pdb file handy, and would like to download proper debugging information from our team’s symbol server? Good news: Rider 2018.1 allows configuring symbols behavior and symbol servers from the settings under Build, Execution, Deployment | Debugger | Symbols:
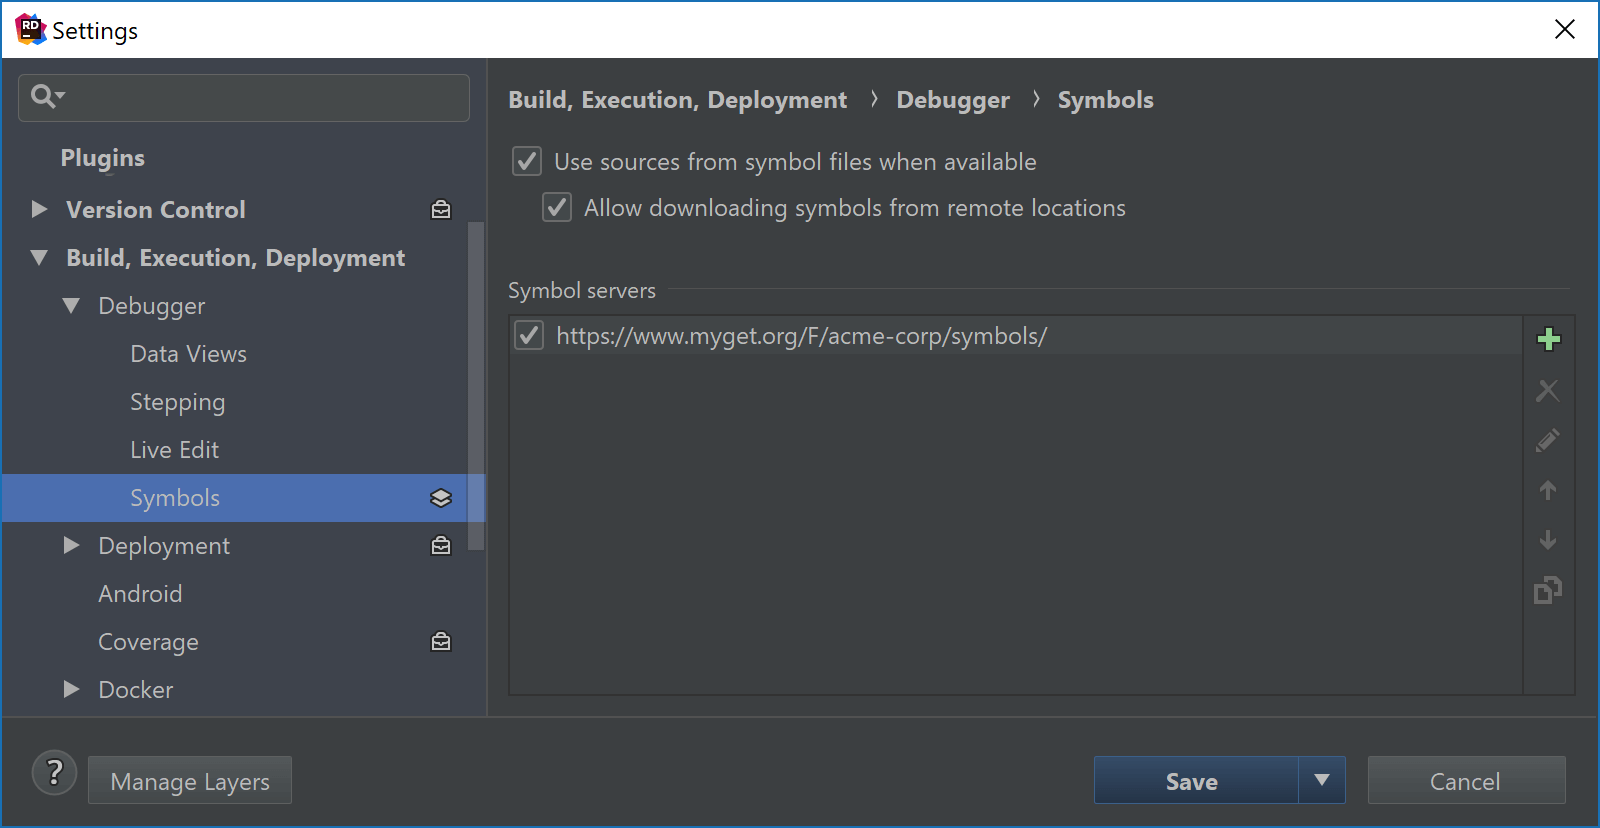
Rider will attempt to load symbols and sources from local or remote .pdb files, optionally prompting for missing source files as well. It supports Windows PDB files as well as Portable PDB files, including those that have either embedded sources or make use of SourceLink (which is a pretty cool way of linking symbols directly to source code on GitHub).
When no symbols or source code are found, the debugger will step into decompiled code instead – making debugging of external code seamless and powerful!
Displaying source code for return value locals
With Rider 2017.3, we added function return values in the locals window. While stepping through code, Rider displays the return value of any function we called. This is very useful to look at the result of a method call without having to store it in a local variable. For example when just returning another function’s return value or when using method chaining, Rider shows us the result of these function calls.
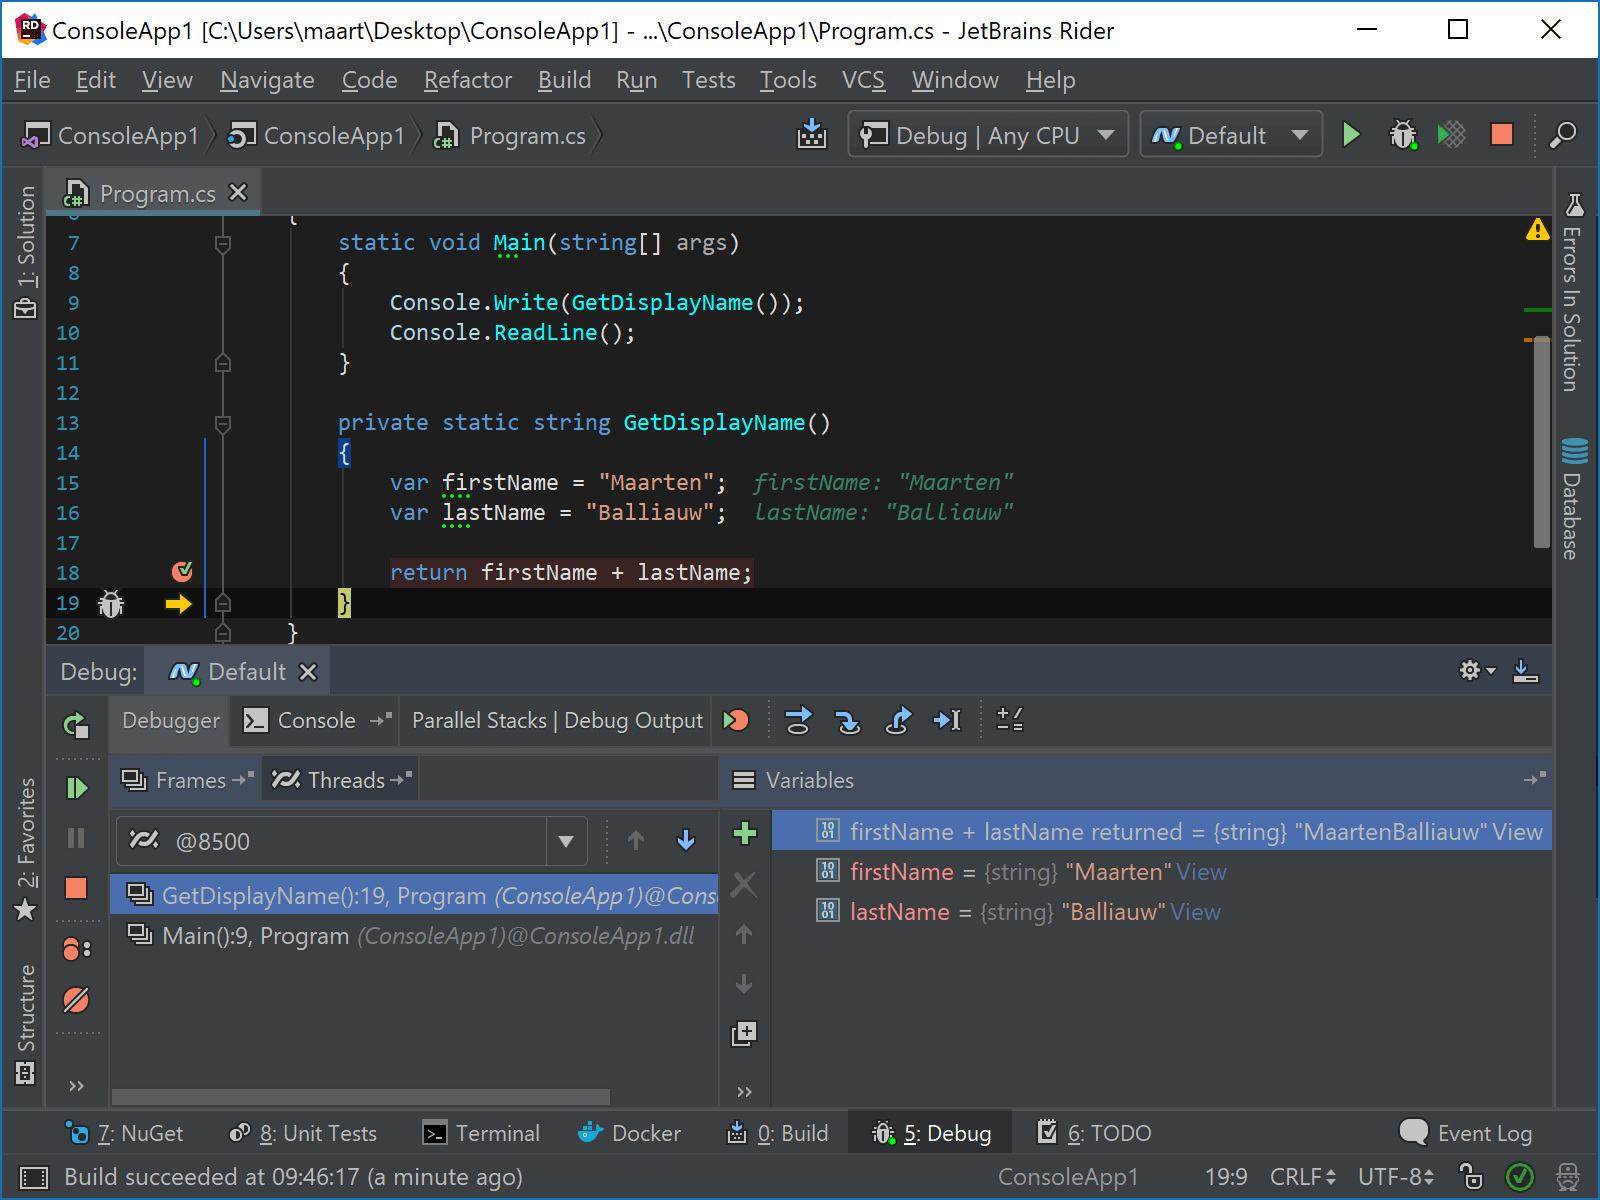
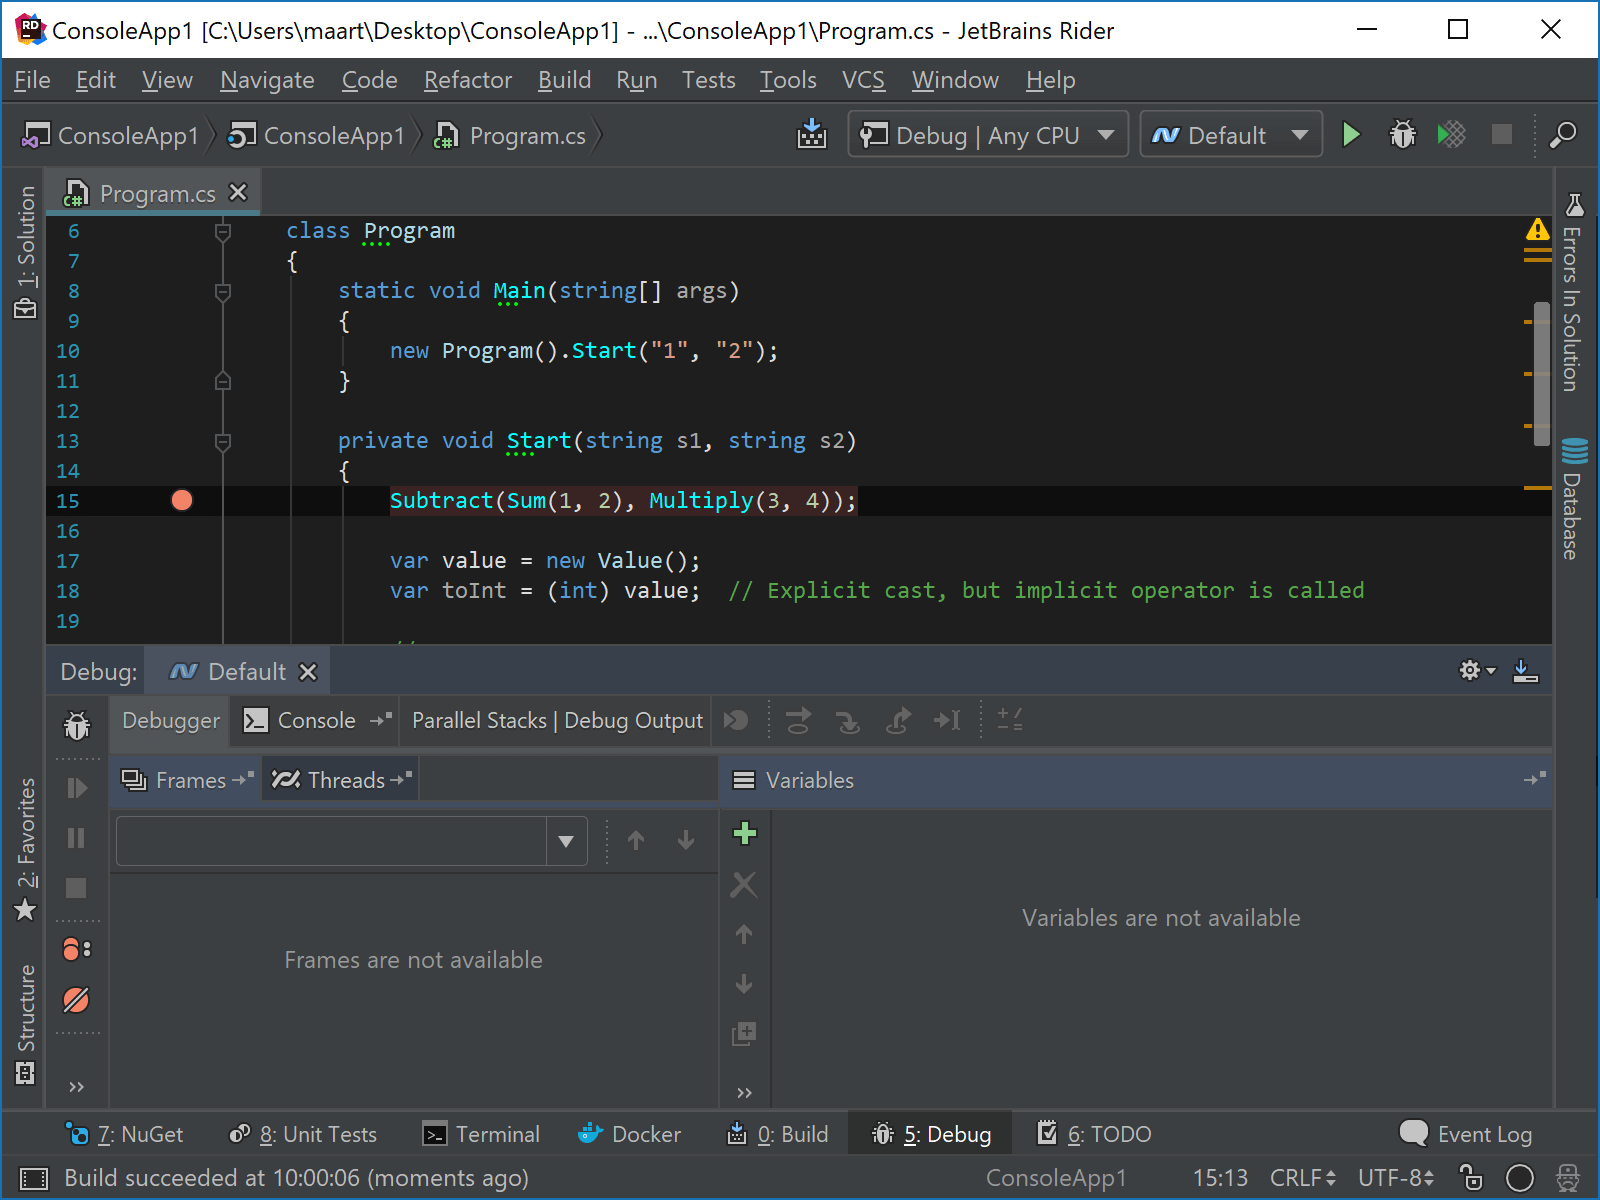
Rider 2018.1 builds on top of this functionality and now displays source code for return value locals. Allow me to explainusing the following code snippet:
var firstName = "Maarten";
var lastName = "Balliauw";

return firstName + lastName;
Earlier versions of Rider would display something like String.Concat returned = "Maarten Balliauw". Rider 2018.1 now gives us more details about what happened, displaying the source code that resulted in our function’s return value:
This also works for nested function calls and a variety of other constructs like casting etc.:
Debugger attach window displays process username (on Windows)
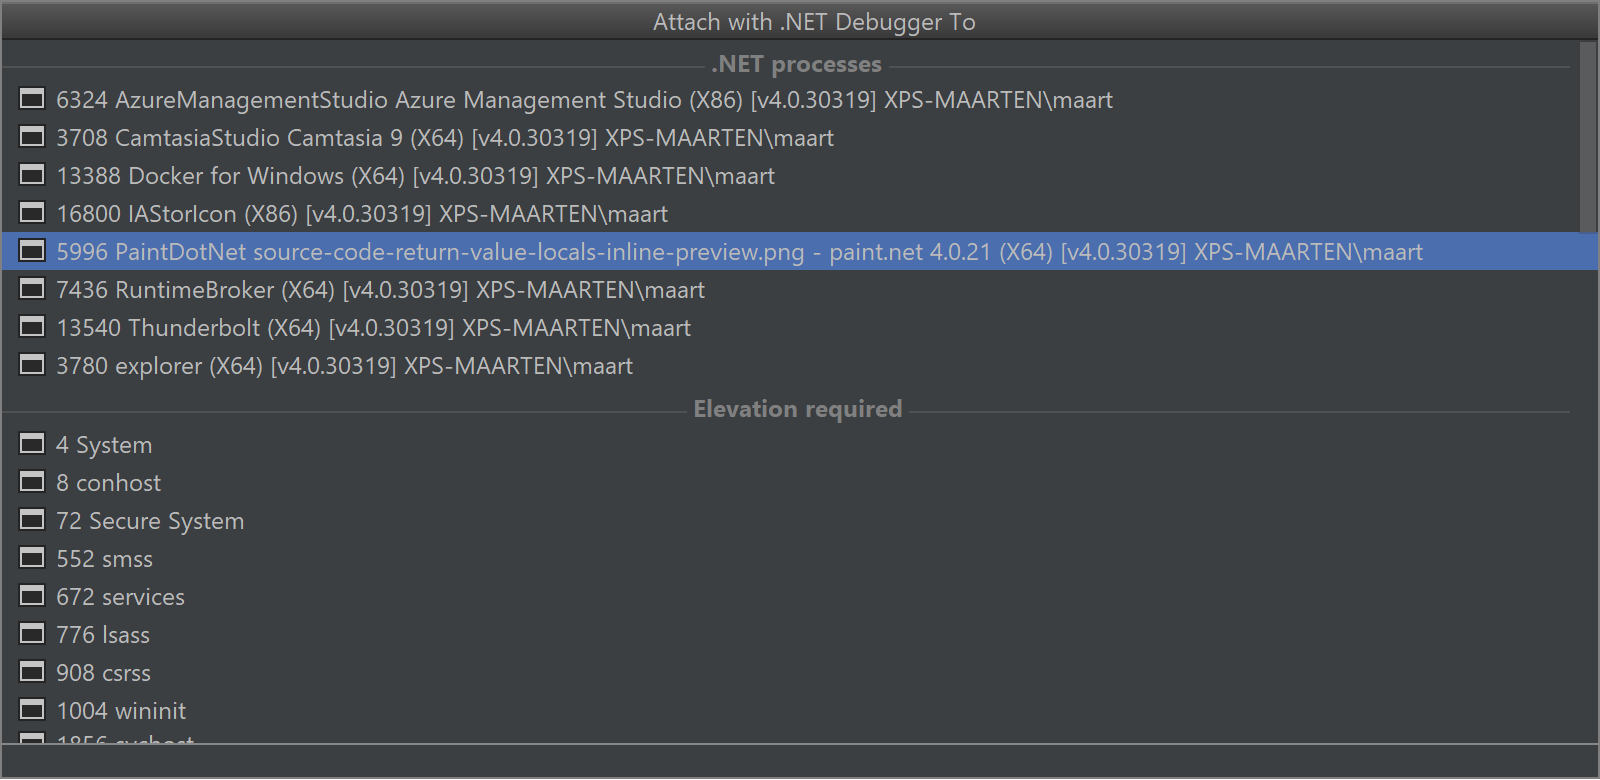
While developing an application, Rider lets us start the application with the debugger attached. But what with already running processes? Using the Run | Attach to Local Process… menu (or Ctrl+Alt+P in the Visual Studio keyboard scheme), we can do exactly that.
Rider now helps make it clear when we would have to run the IDE with elevated privileges by showing us the username the process is running under (note this only works for .NET Framework on Windows right now).
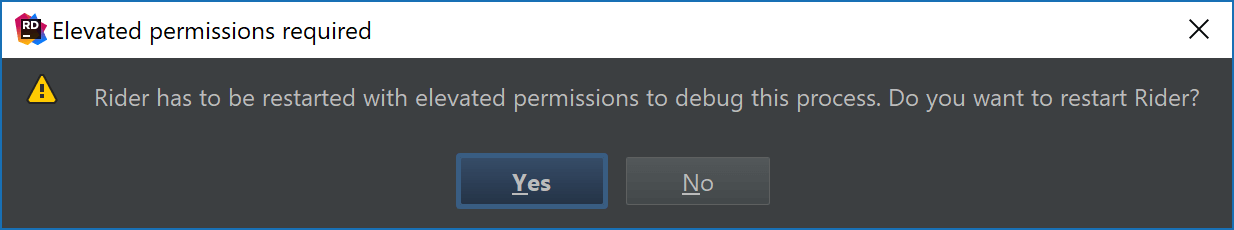
For example when running Rider as a local user, we would have to run with elevated privileges to be able to attach to a running Windows Service or an IIS application pool (w3wp.exe). In those cases, Rider will prompt and provide the option to restart the IDE with elevated permissions:
Various fixes and improvements
As with every release, there are always things that can be improved – so we did!
- When debugging an application on Windows that has the application’s console embedded in the Debug tool window, Rider now displays output more reliably. Also all character input is the embedded console is now redirected to the running process, so we do not have to run our application in an external console.
- When dragging the execution pointer to an empty line of source code, the debugger now pauses at the nearest statement.
- We added support for debugging external class libraries with Unity on any platform (and backported that fix to Rider 2017.3.1). And improved smart step-into as well.
- And many more!
Give the latest Rider 2018.1 EAP build a try! We’d love to hear your feedback!


