.NET Tools
Essential productivity kit for .NET and game developers
Introduction to code analysis in Rider

One of the strengths of Rider is code analysis. Rider comes with over 2400 code inspections that analyze our code at design time, allowing us to instantly see any errors, problems or potential improvements – whether in the current file or in our entire solution.
In this blog series, we’ll look at what code analysis is, how it can do automated code review and how it helps us improve the quality of our code. Once we covered that, we’ll look into some of the inspection categories that are available and how they can help spot and resolve potential issues in our codebase.
In this series: (table of contents will be updated as we progress)
- Introduction to code analysis in Rider
- Solution-wide analysis in Rider
- Using Rider to spot errors before our application runs
- Learning best practices and language features using Rider code inspections
- Consistent code bases using Rider code analysis
Let’s start at the beginning: what is code analysis?
What is code analysis?
How do we know if our code is correct? Unfortunately, there is no single answer to that question. We have to rely on various methods to validate code correctness:
- Compile our code to check for compilation errors.
- Run our application to check for issues at runtime.
- Write and run unit tests to validate code logic.
There’s a downside to these three ways of validating code: they all require an explicit action. For example, to detect runtime errors we have to run our application, click through it and see if things are okay. We have to attach a profiler to figure out whether we implemented the Disposable pattern correctly. What if we could detect potential issues while writing code?
Code Analysis continuously looks at what we are doing and tries to determine what we want to achieve. Rider looks at individual statements and at our overall solution architecture. If it detects a potential issue, it will show a warning. It may show suggestions too, helping us make our code better. Let’s look at an example.
What does it look like in the editor?
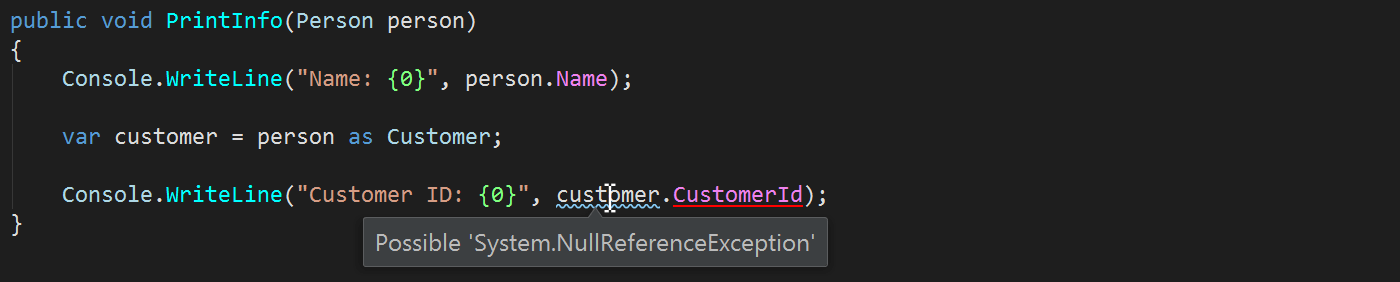
We can access code analysis in a number of places, but let’s start with a place where it’s very obvious: in the editor. We’ll see our code get underlined with a “squiggle”, its color based on the severity of the code inspection result (hint, suggestion, warning, error).
Hovering over an inspection shows us what the issue is. In this case, we’re casting a Person to a Customer, which could result in a NullReferenceException at runtime.
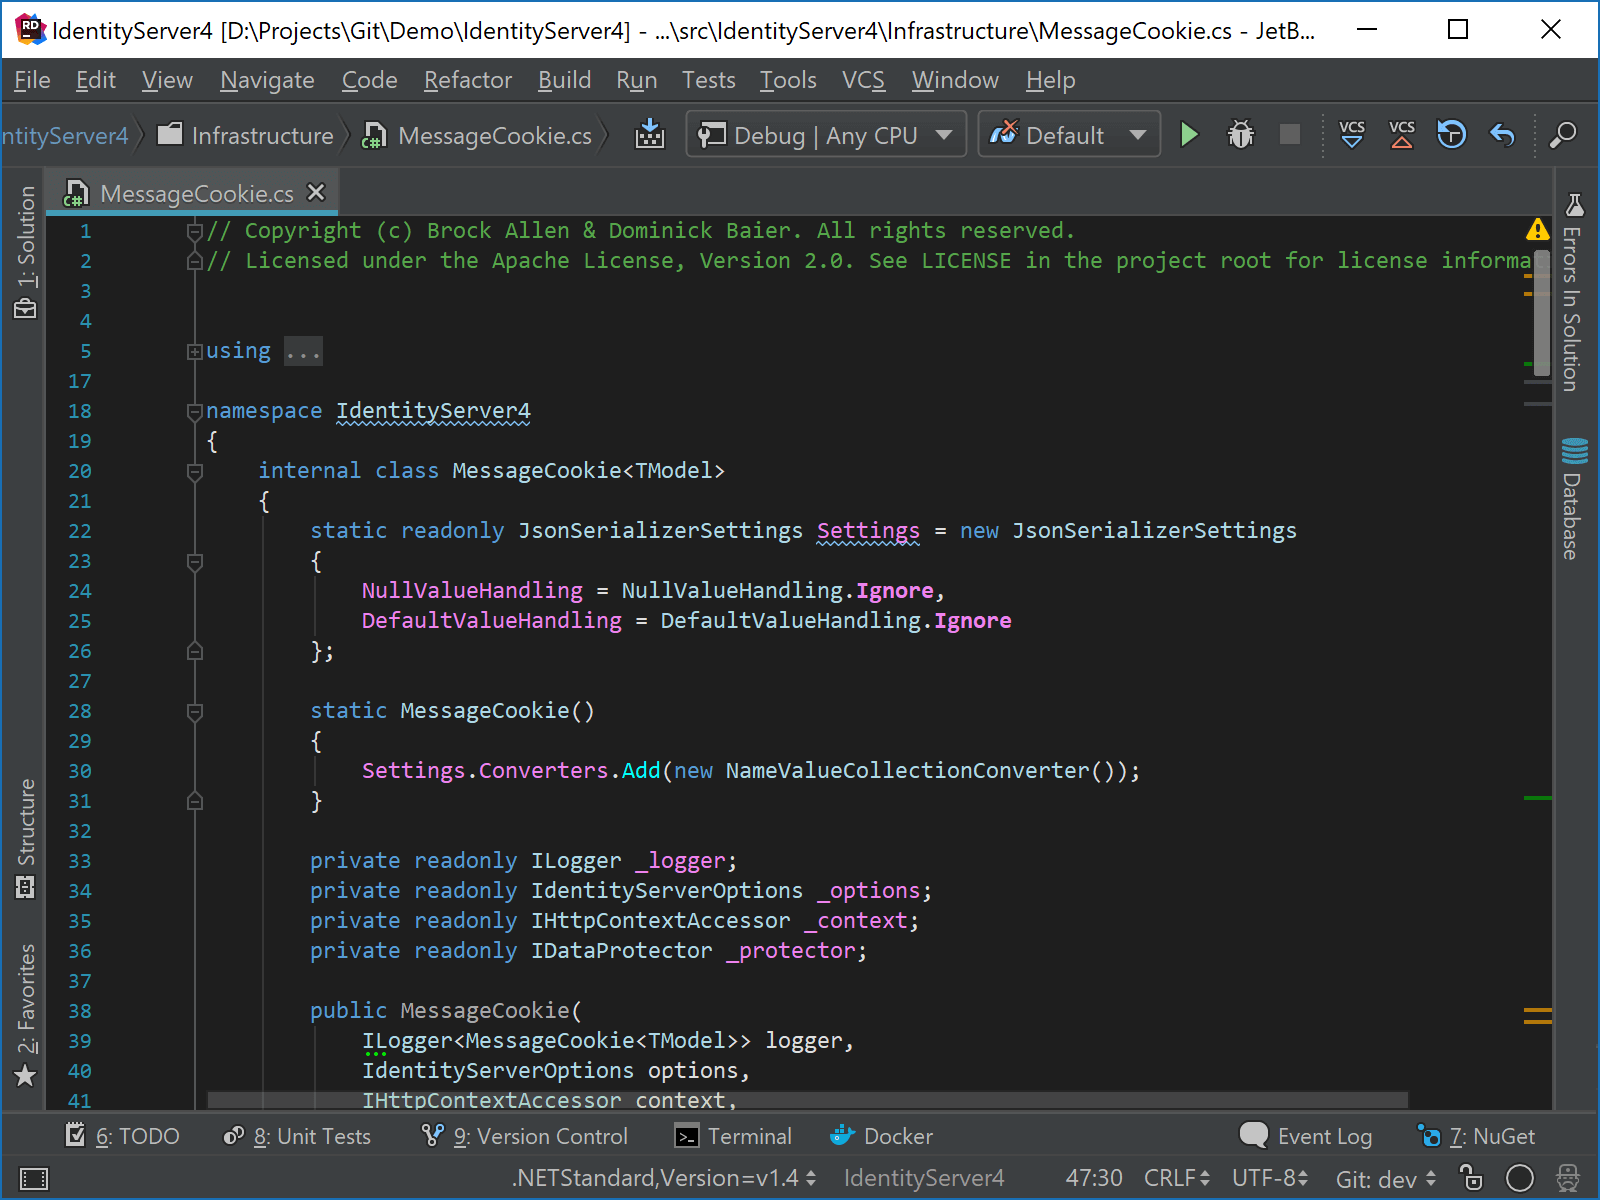
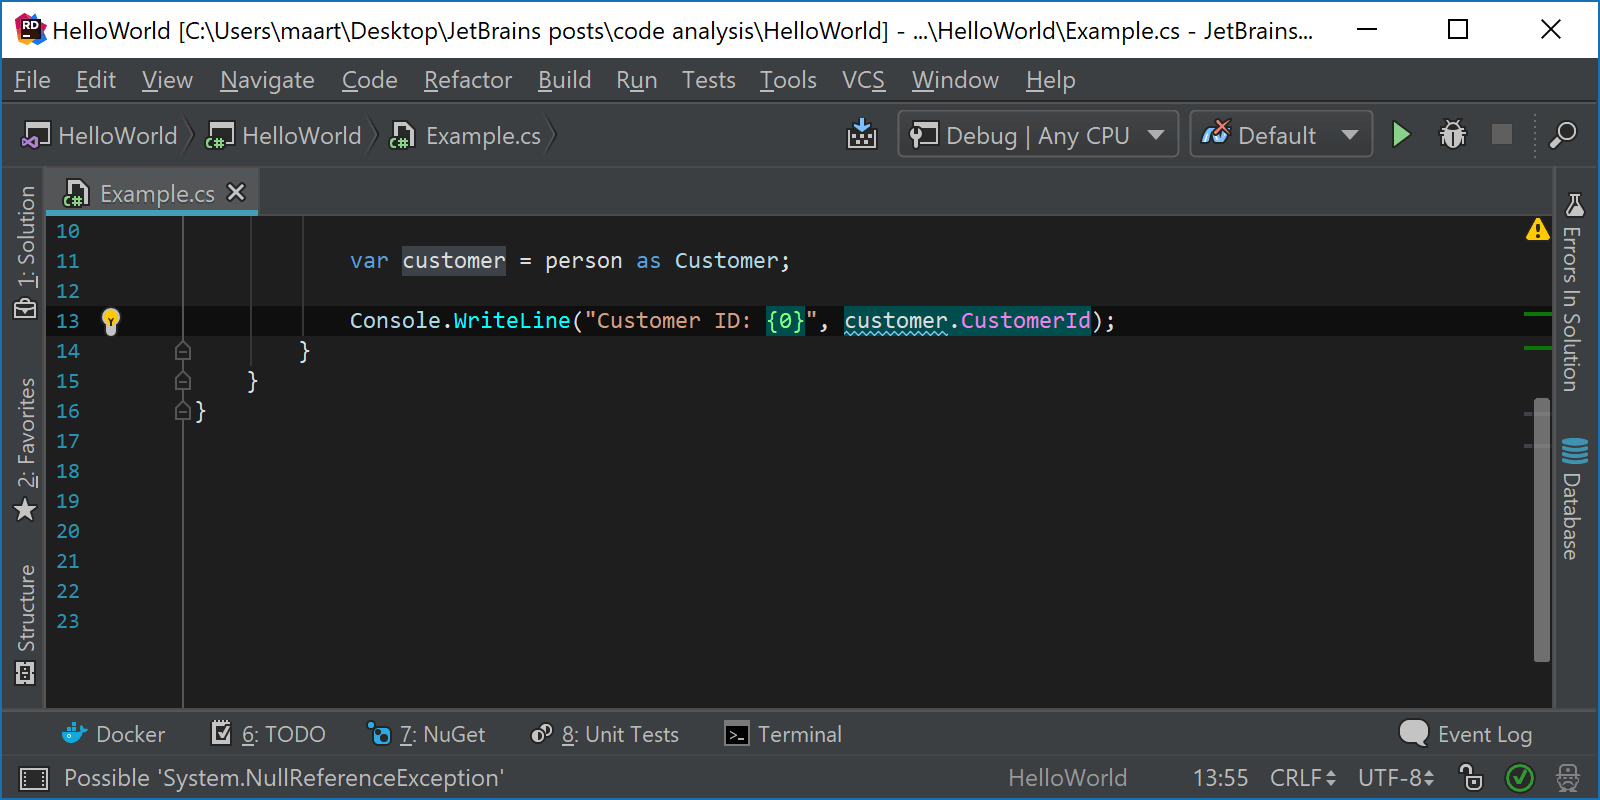
Rider also displays code analysis results in the top-right corner of the editor. If we see a green icon, all is well. If there’s a yellow exclamation mark, we have some potential issues. If it’s red, our code will either not compile or has a serious error that needs fixing. We can hover the icon and get a summary of potential issues. We can also hover the markers in the right-hand gutter to see the issue found there, including a preview. Clicking it jumps to the line of code in the editor.
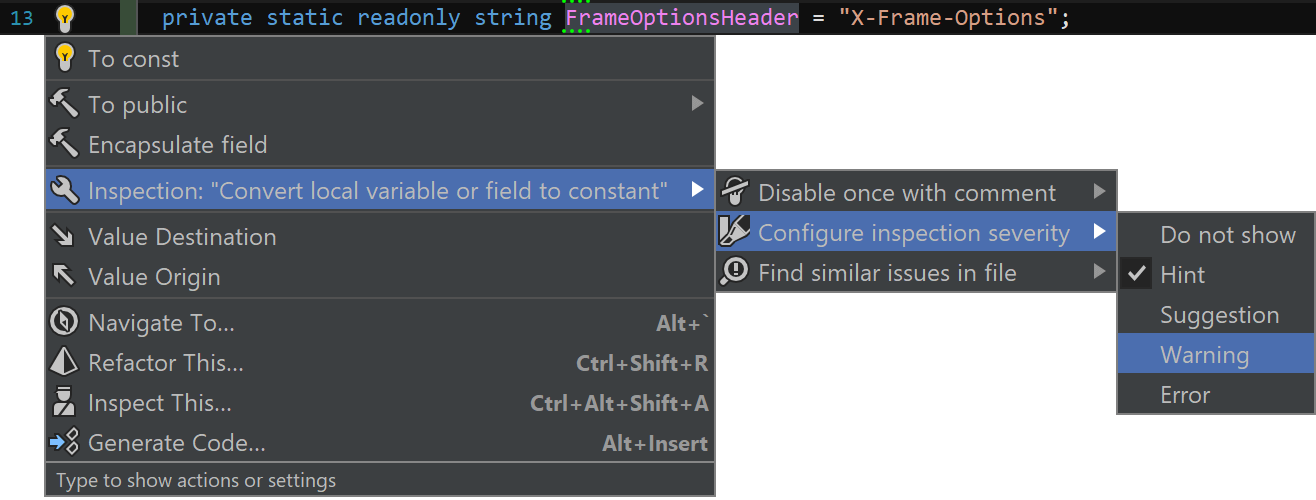
When the caret is at the code highlighted by a code inspection, Rider will display a lightbulb in the left gutter, from where we can perform several actions. Clicking it (or pressing Alt+Enter) expands a menu where we can:
- Apply a quick fix, automatically resolving the issue that is found.
- Suppress this inspection for just this occurrence, in a part of the file, or in the whole file.
- Disable this inspection altogether so that all similar issues get ignored.
- Change the severity level of this inspection to make issues it detects more or less noticeable.
- Find similar issues in the current file, project or solution.
- Get more information about why Rider is showing the suggestion, warning or error. For the above Possible System.NullReferenceException, we can read up on why this is an issue and how we can avoid it.
Most inspections come with one or more quick fixes that will attempt to automatically solve the issue for us. Here’s an example that adds a null check:
Code inspections and their severity levels
Since Rider is based on both ReSharper and IntelliJ IDEA, it shares inspections with both products. Inspections for .NET languages and frameworks come from ReSharper, while inspections for JavaScript, TypeScript, HTML, CSS, … come from IntelliJ-based IDE’s like WebStorm. The best of both worlds! Rider comes with over 2400 code inspections for C#, F#, VB.NET, XAML, XML, ASP.NET, ASP.NET MVC, Razor, JavaScript, TypeScript, HTML, CSS, Angular, …
The sheer amount of inspections can be overwhelming at first, but we’ve configured sensible defaults for their severity levels. For example, language usage opportunities are merely suggestions to learn about (new) language features. Compiler warnings, such as missing properties, will show an error.
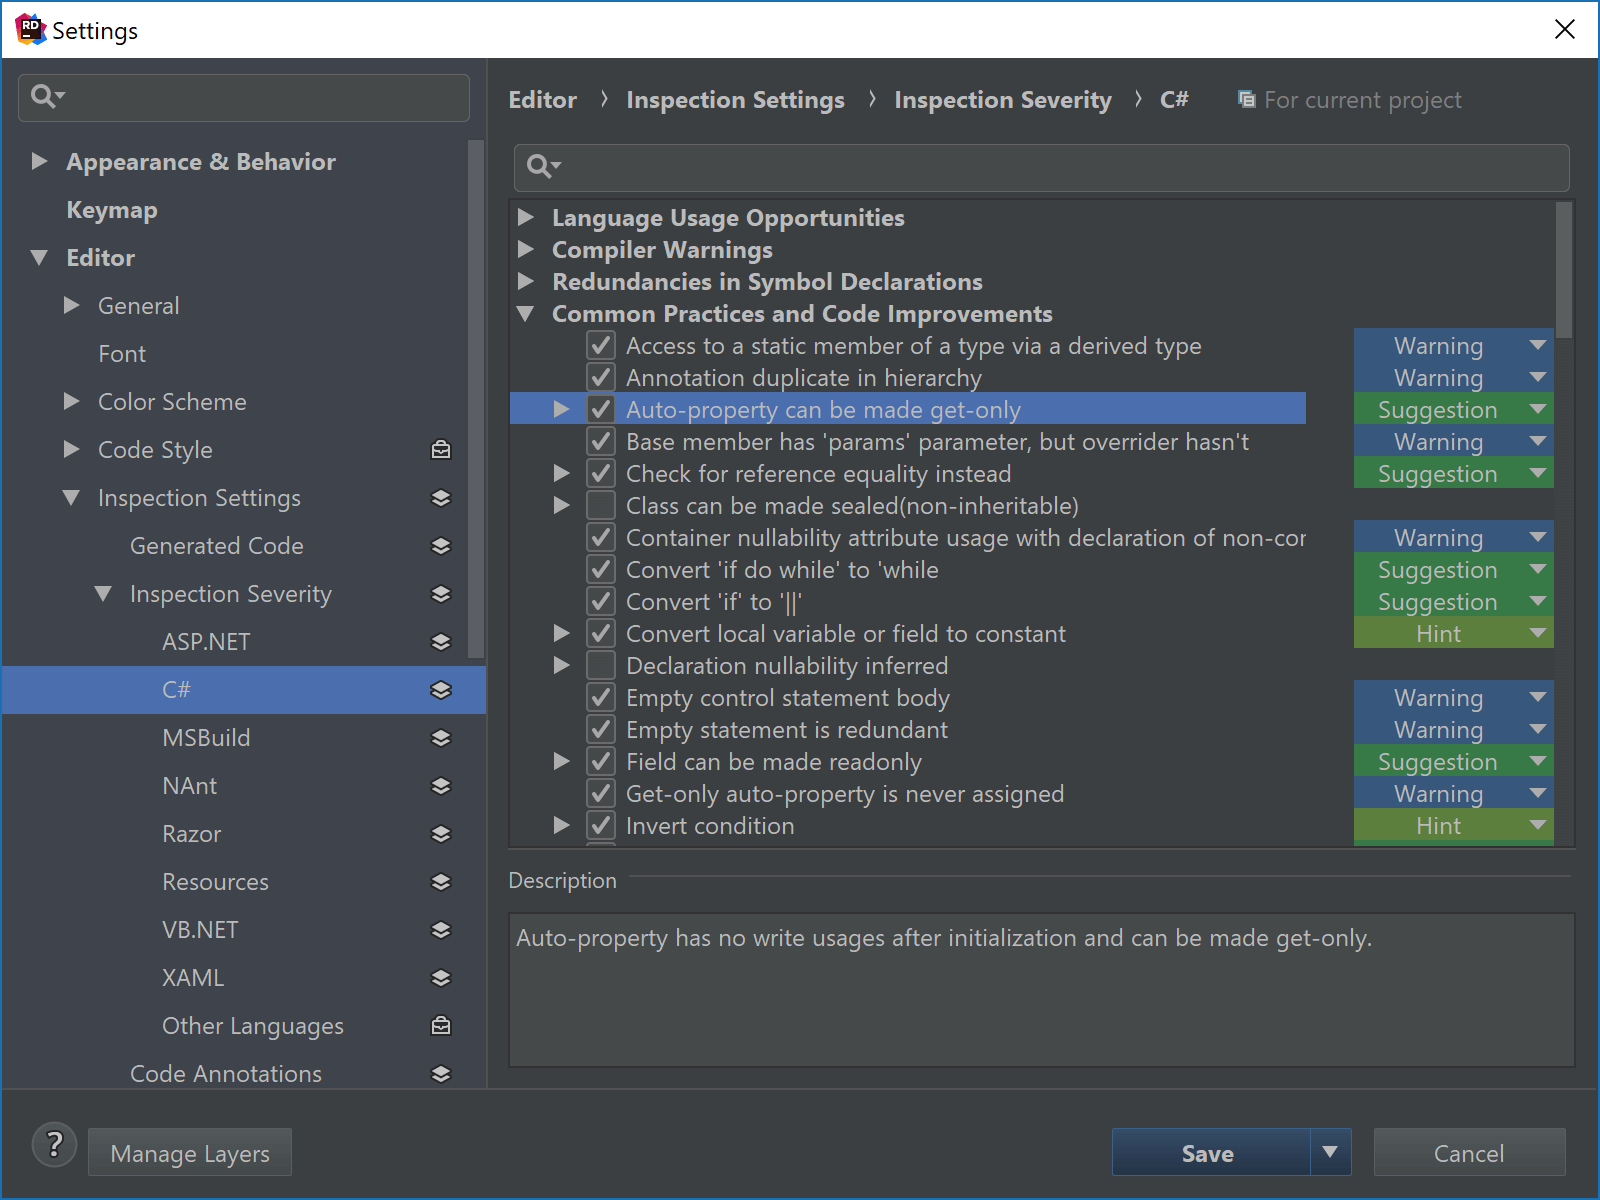
Depending on the project we’re working on, we may want to move away from those defaults. We may want to skip some inspections, or enforce code styles with errors instead of merely suggesting an improvement. From the settings, under Editor | Inspection Settings | Inspection Severity, we can configure severity levels for each code inspection. Inspections that are disabled by default can also be enabled from here. When selecting an inspection, we can read its description to see what it does.
There are several categories of inspections:
- Potential Code Quality issues, such as members that cannot be resolved or writing functions that never return.
- Code Style, such as redundant parentheses or unnecessary whitespace.
- Language Usage Opportunities, helping us to learn our programming language. Examples are suggesting optional parameters, converting a for loop into a foreach, …
- Redundancies in Code, such as detecting empty loops or detecting expressions that are always true or null.
- Constraints Violations, such as inconsistent naming.
- Common Practices and Code Improvements, such as merging two if statements with an “or”, inverting conditions, …
- Redundancies in Symbol Declarations, such as unused references, unused methods, …
- Compiler Warnings, such as invalid syntax, unused fields, … – the things that the compiler will warn us about later.
- Framework-specific inspections for NUnit, ASP.NET, MSBuild, NAnt, JavaScript, Razor, Angular, CSS, …
While we can search through the list of inspections, it’s often easier to configure inspection severity when we first see a specific code issue that it detects. Using Alt+Enter, we can set the inspection severity from within the editor, suppress the inspection for this specific occurrence, or disable it project- or solution-wide.
Sharing code analysis settings through settings layers
Code analysis settings can be shared within the development team, enabling/disabling code inspections and setting their severity when the solution is loaded on their machines.
Rider makes use of ReSharper settings layers to share settings, which means that our code analysis configuration can also be shared between team members using different IDE’s!
Settings can be applied to the current solution – either just for ourselves or for the entire team, or across all solutions on our computer. We can see the code inspections configuration has a layers icon next to it, which means it can be shared. The Save button lets us choose where settings should be applied:
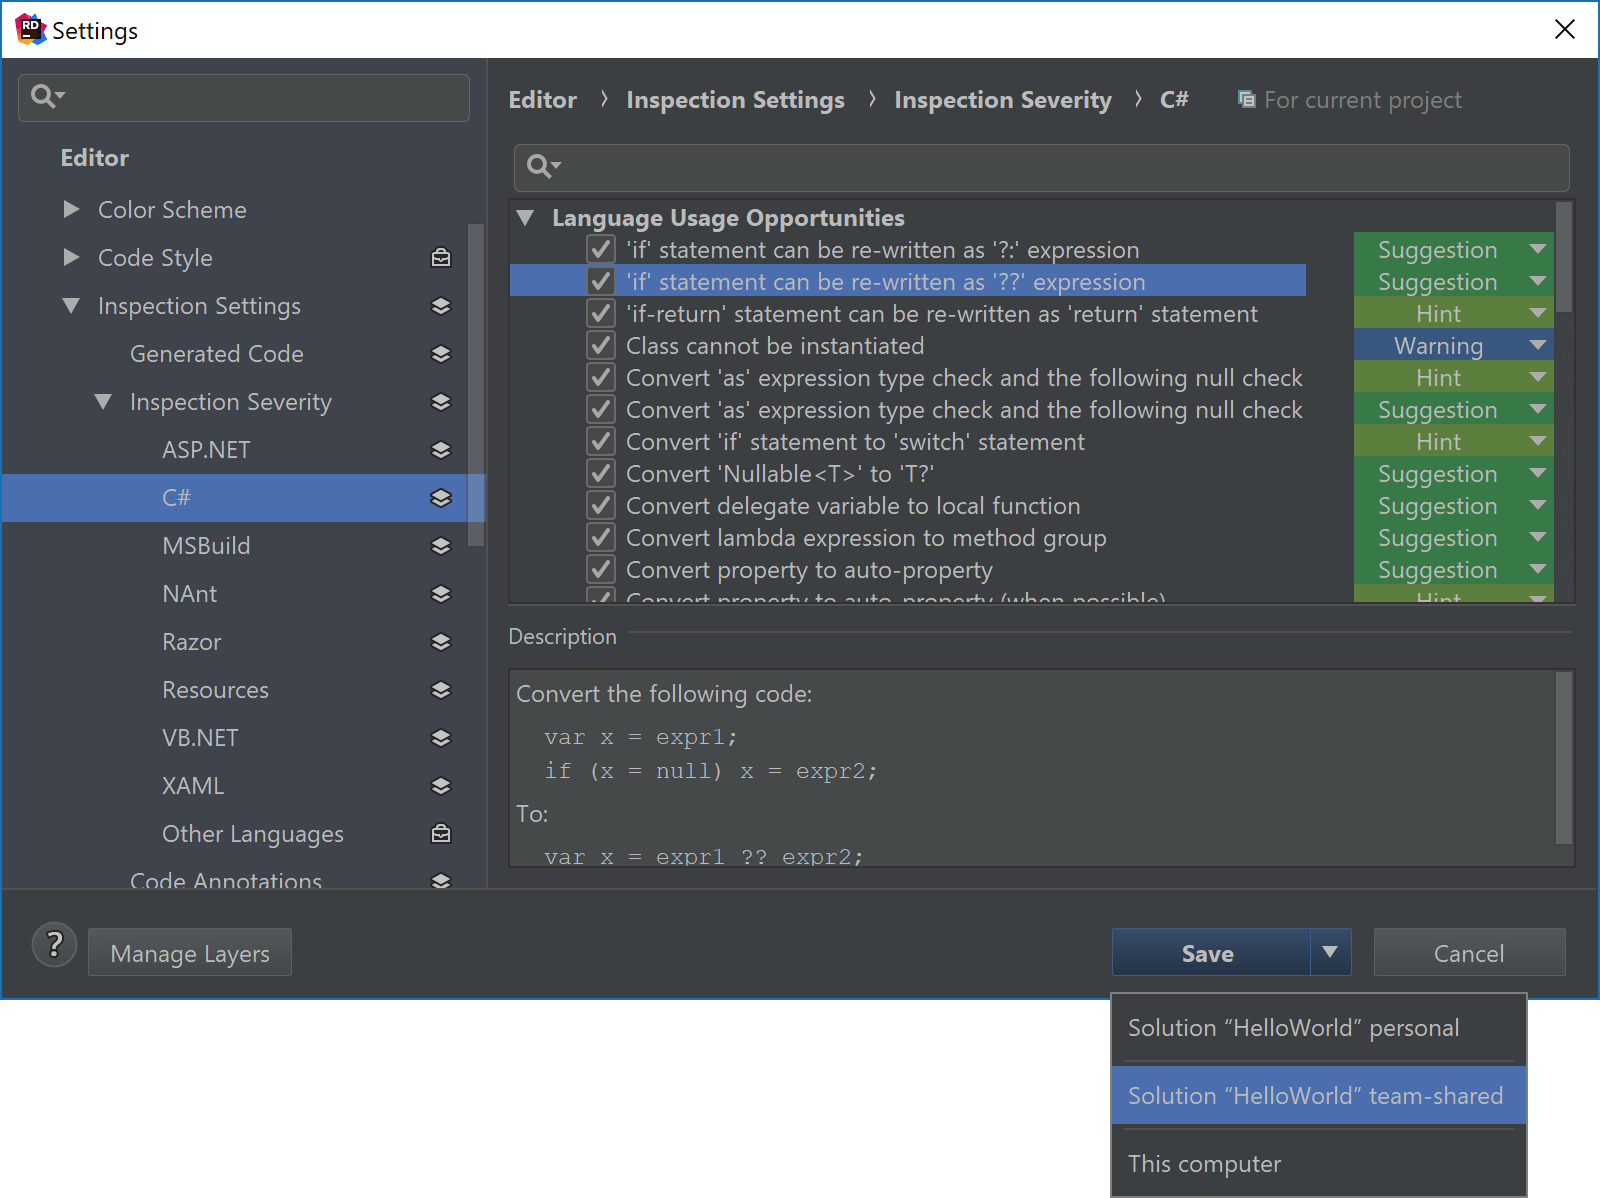
Team-shared settings are stored in a <SolutionName>.sln.DotSettings file which we can commit to source control and then share with other developers on the team.
In our next post, we’ll look at solution-wide analysis and how it can help us detect (and fix) common code quality issues in our codebase.
Download Rider and give it a try! We’d love to hear your feedback.

Subscribe to a monthly digest curated from the .NET Tools blog: