

.NET Tools
Essential productivity kit for .NET and game developers
Solution-wide analysis in Rider

In a previous post, we looked at the basics of Rider‘s code analysis. We’ve seen that Rider continuously runs over 2400 inspections and validations on our code, informing us about potential issues and improvements while we are writing it. Code Analysis works with all languages supported by Rider and builds on inspections coming from ReSharper and from IntelliJ-based IDEs.
In this post, we’ll look at solution-wide analysis and how it can help us monitor code quality issues in our entire codebase at once – essentially providing us with an automated code review. We will also check out other ways to detect and fix problems in the scope of your project or solution.
In this series: (table of contents will be updated as we progress)
- Introduction to code analysis in Rider
- Solution-wide analysis in Rider
- Using Rider to spot errors before our application runs
- Learning best practices and language features using Rider code inspections
- Consistent code bases using Rider code analysis
What is solution-wide analysis and where do I find it?
Solution-wide analysis in Rider does two things for us. First, it lets us constantly keep track of all errors/warnings in our solution, such as compiler errors or errors detected by code inspections. Second, it helps us find issues that can only be detected by analyzing the whole solution at once. Examples would be determining if a public member is used anywhere in the codebase, unassigned fields, …
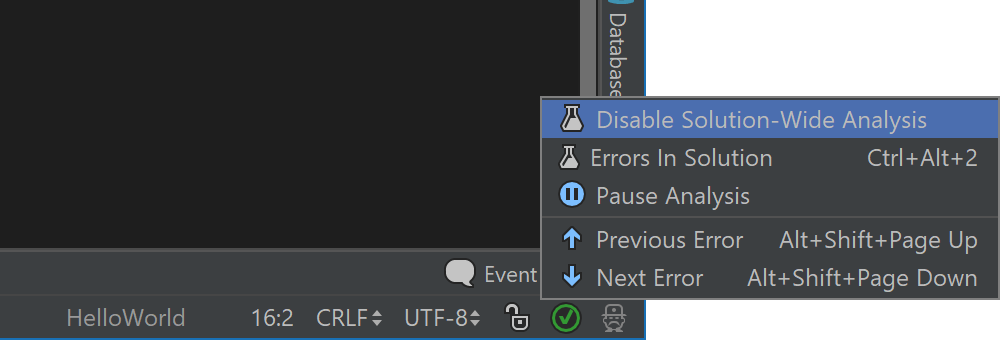
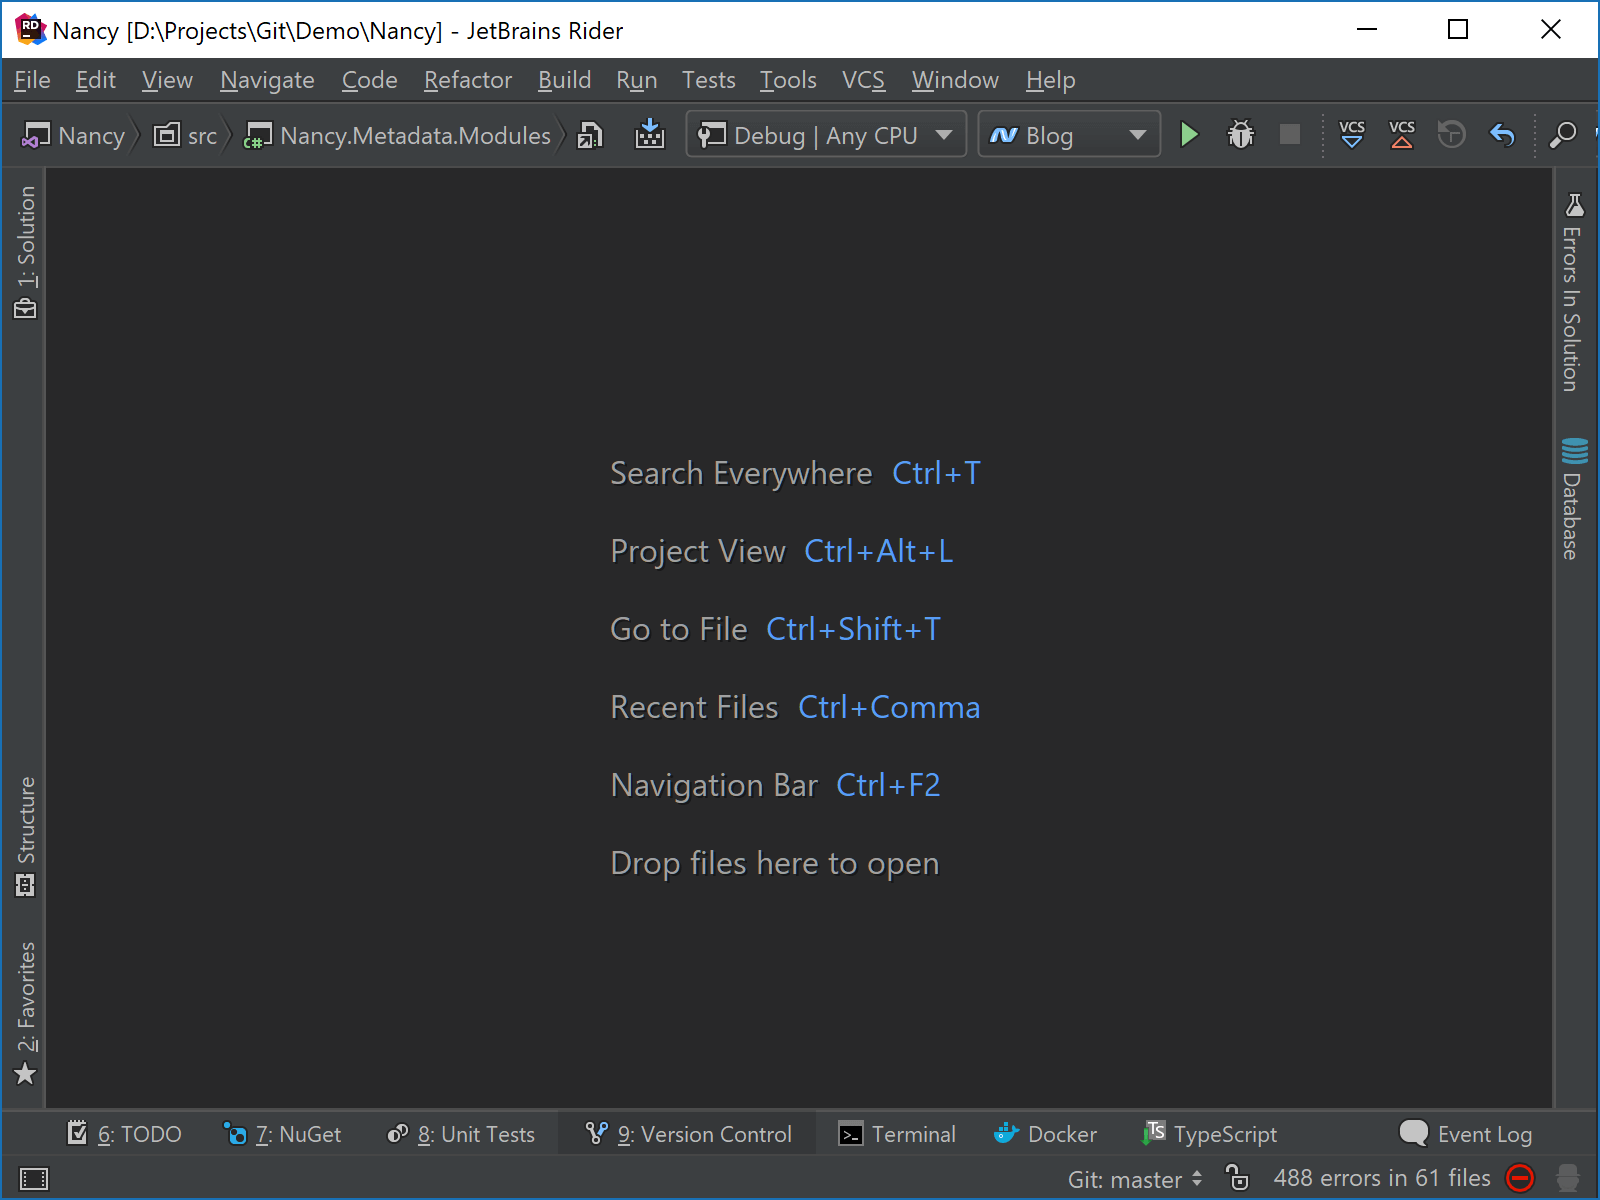
We can enable/disable solution-wide analysis from Rider settings (Editor | Inspection Settings), from the Errors in Solution tool window (View | Tool Windows | Errors in Solution) or from Rider’s status bar:
When enabled, solution-wide analysis will perform an initial scan of our entire solution. Depending on the size of the solution, this scan may take anything from a few seconds to several minutes. We can keep working on our code while it runs, but it may have some performance impact at first. Once finished, solution-wide analysis will run incrementally, based on changes we make in our code – which is much faster.
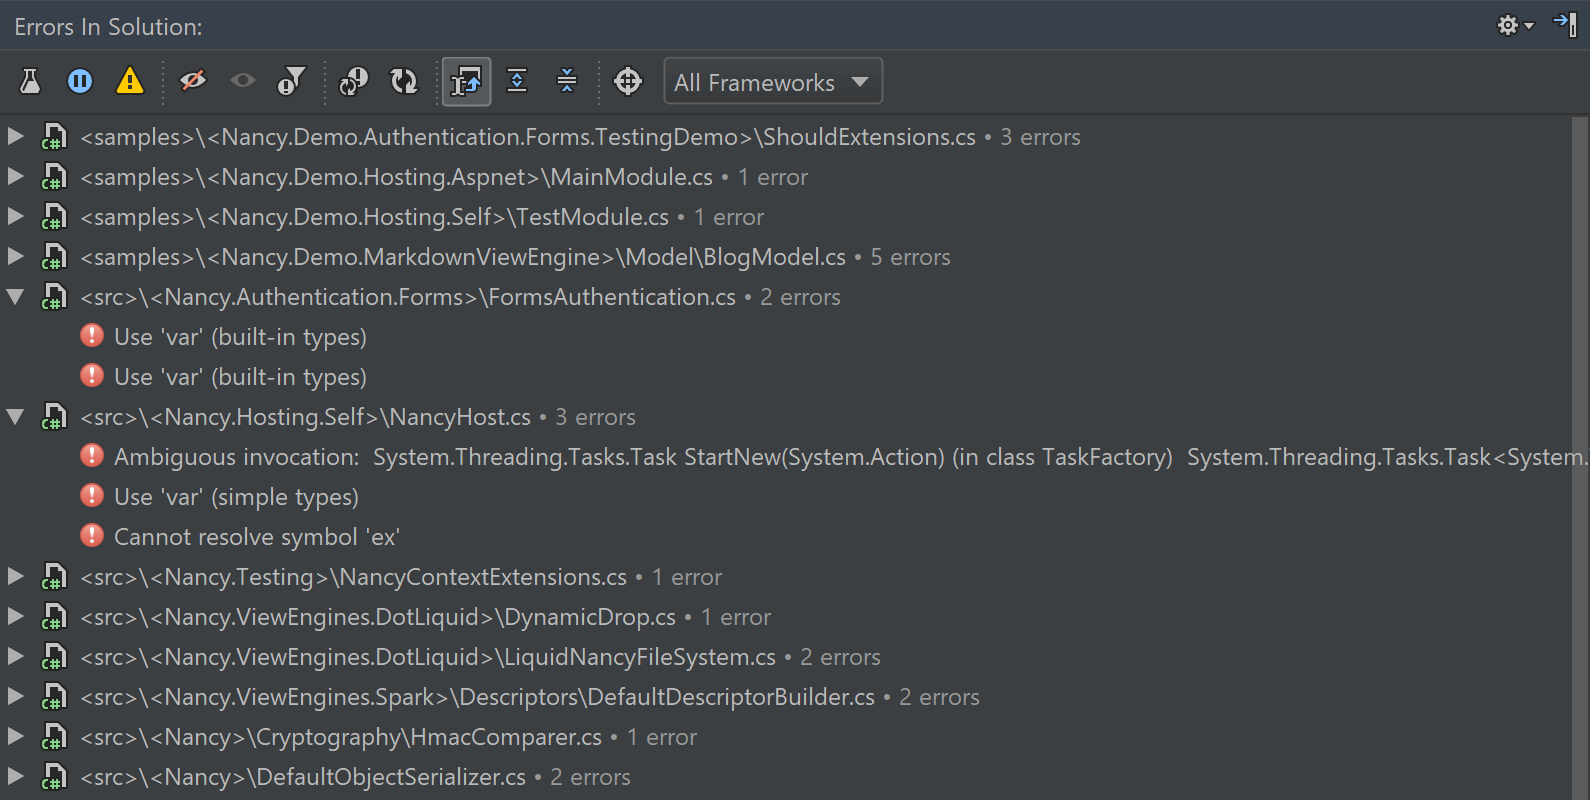
Once the initial scan is completed, we’ll see warnings and errors from our codebase appear in the Errors in Solution window. In the above example, we can see we have quite a few errors. Double-clicking a warning or error will jump to the source file. We can also navigate between errors in solution using the Alt+Shift+PgUp/PgDown keyboard shortcuts.
From the toolbar, we can do several things:
- Pause solution-wide analysis – this will temporarily stop monitoring for changes. It may make sense to do this while performing a large refactoring to reduce unnecessary analysis.
- Ignore selected errors – in case we don’t want to see them in the list here.
- Re-analyze files with errors in them, or re-analyze all files.
Note that the Errors in Solution tool window doesn’t include all code analysis results – just errors. We can toggle displaying warnings from the toolbar as well.
Let’s look at some other ways of running code analysis!
Different ways of running code analysis
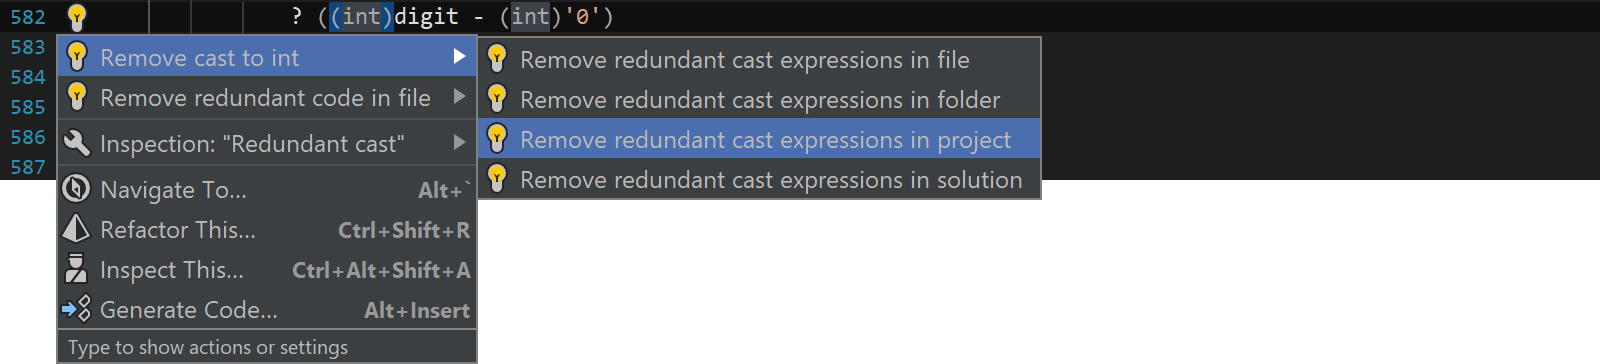
Rider lets you analyze code in several different ways. Let’s start with an easy one: using Alt+Enter. We’ve seen that when code analysis reports an issue, we can bring up a menu where we can execute a quick fix to solve the issue automatically. Rider allows us to not only fix the current occurrence, but also lets us fix all similar issues in the current file, folder, project or solution.
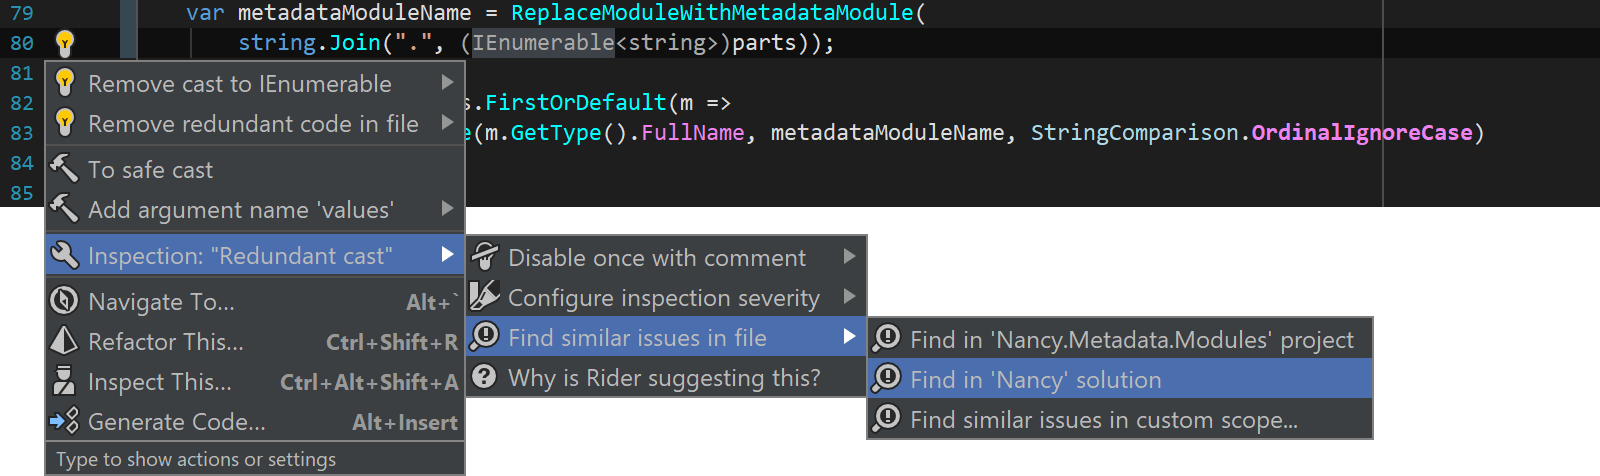
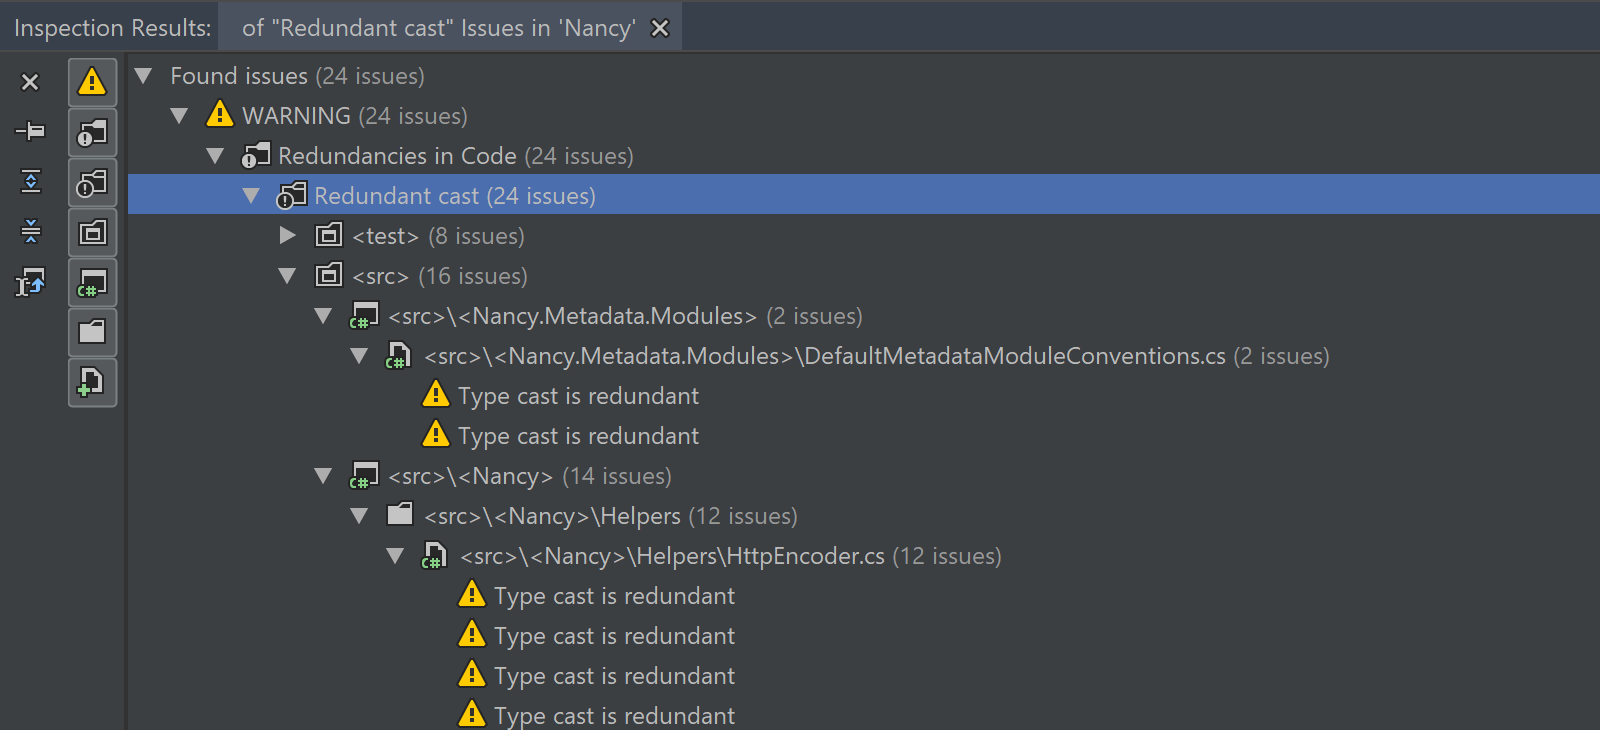
Maybe we want to first analyze occurrences before fixing them. Again from the Alt+Enter popup, we can run the specific inspection against our current file, project, solution, or a custom scope.
Once completed, Rider will show us a tool window where we can see the inspection results. Double-clicking an item or pressing F4 jumps to the location in source code where Rider found the issue. The toolbar on the left lets us slice and dice results so we can navigate them according to our preference.
Another way of running code inspections is by name. The Code | Run Inspection by Name… menu (Ctrl+Alt+Shift+I) will display a search box where we can enter the name of an inspection. Let’s see if we can find empty catch blocks in our solution, searching for “empty general catch clause” in the list of inspections. Note the list of inspections shows the inspection name as well as the language/framework icon which it applies to.
From the inspection results window, we can again navigate to a specific occurrence in code and decide on the action to perform.
And finally, we can apply all Rider’s code inspections to our codebase by either selecting Code | Inspect Code… from the menu or by right-clicking a node in the Solution Explorer and choosing Inspect Code. In contrast to the solution-wide analysis, which only detects major problems, this way Rider will inspect our code more thoroughly – but no worries, it is still done asynchronously and we don’t have to pause coding and wait for the inspection to finish.
In the past two blog posts, we’ve seen one of the strengths of Rider: code analysis. There are over 2400 code inspections borrowed from ReSharper and IntelliJ-based IDEs that analyze our code while we are writing it, allowing us to instantly see any errors, problems or potential improvements in a wide variety of languages and frameworks.
With our next post, we’ll start looking into specific scenarios and how code analysis can help us out by spotting and resolving potential issues in our code. Stay tuned!
Download Rider and give it a try! We’d love to hear your feedback.


