.NET Tools
Essential productivity kit for .NET and game developers
More meaningful call stacks, thread-specific breakpoints and other debugger improvements in Rider 2018.2 EAP
Our latest Rider 2018.2 EAP (Early Access Preview) introduces a series of improvements to the debugger. Generic types, async function names, constructors, static methods and other type information in .NET call stacks are now displayed in a more meaningful way. We added thread-specific breakpoints for multi-threaded applications. Mono and Unity developers will be happy with the ability to inspect unsafe pointers. It’s now possible to change debugger settings while running. And more! Let’s have a look.
Improved type information in .NET call stack
While debugging, we can inspect what our code is doing. When execution is paused, we can inspect variables, and see the current execution stack. Traditionally, this stack displayed type information as seen by the .NET runtime. For example, when debugging async methods, we would see the underlying state machine in our call stack, rather than the name of our async method:
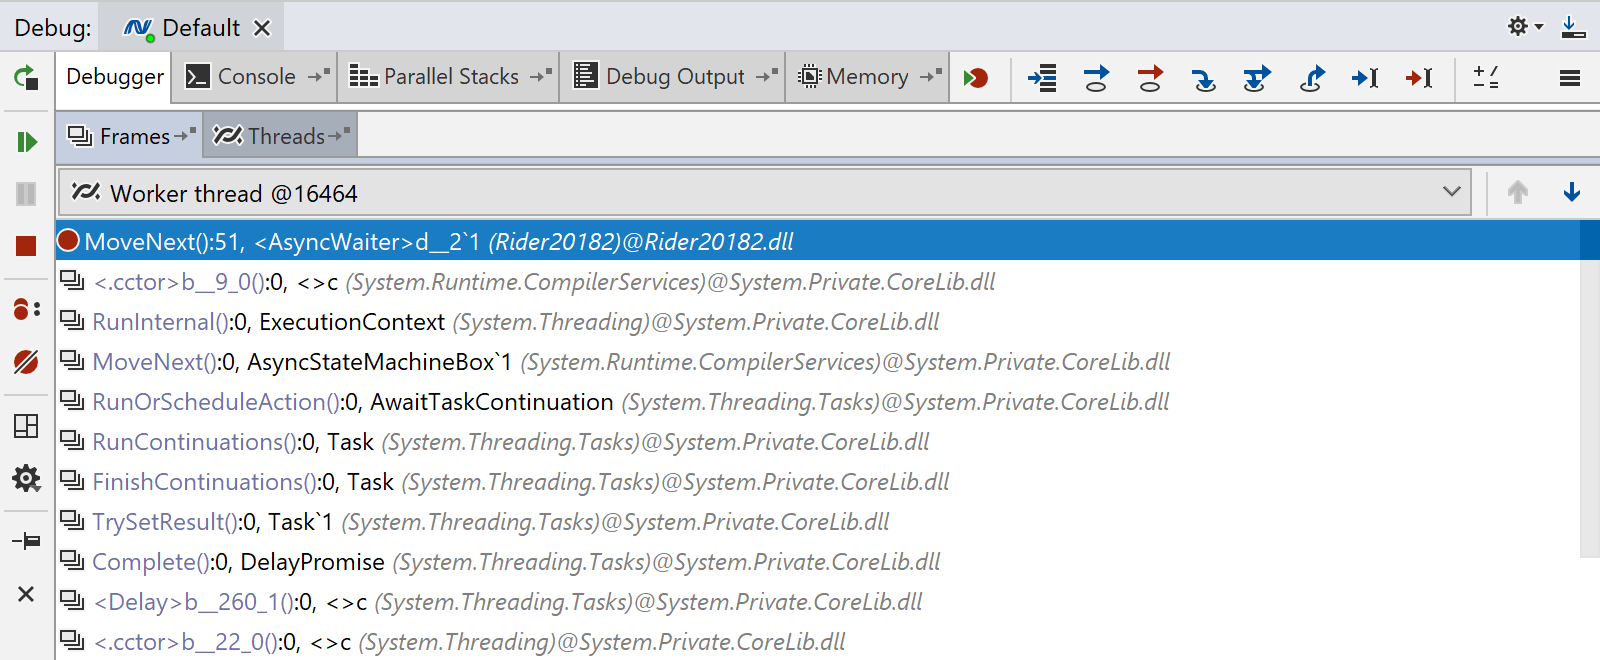
No longer! Rider 2018.2 comes with improvements in presenting generic types, async function names, constructors, static methods and other type information in .NET call stacks. Instead of that MoveNext() method, we can now see the name of our async method:
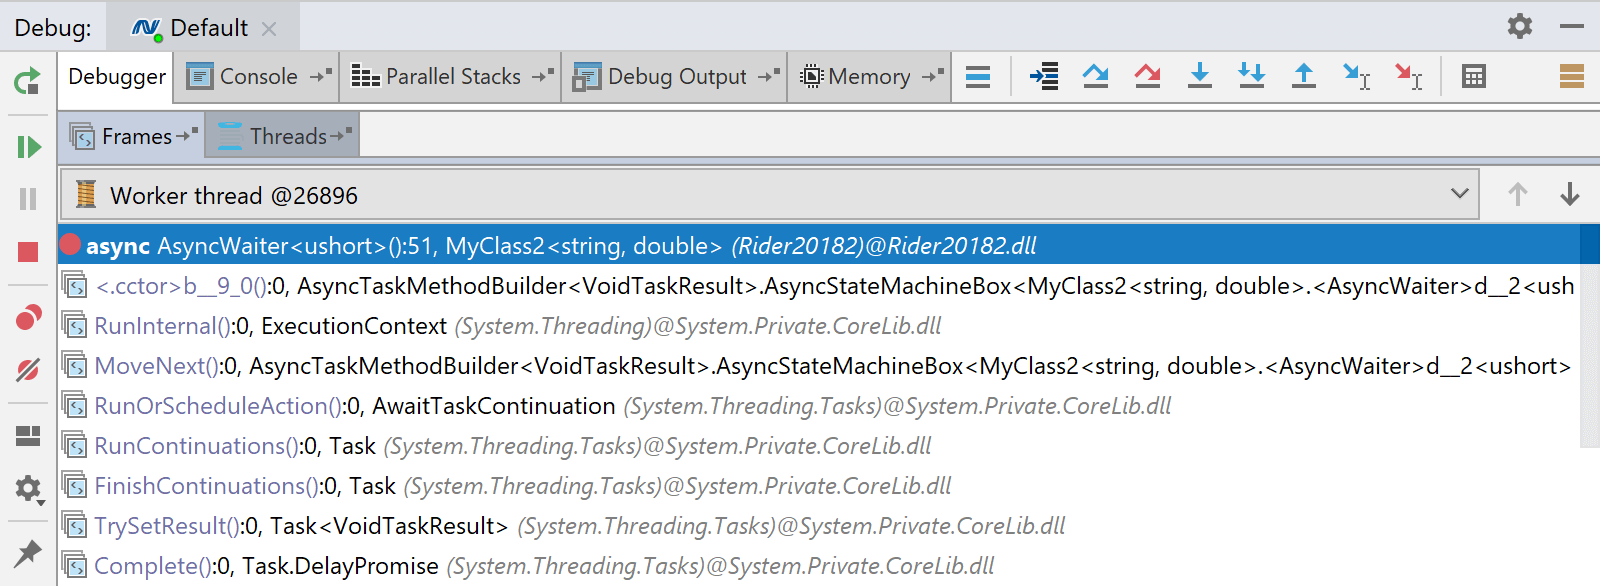
Rider now displays call stacks that make use of modern C# features in an understandable way.
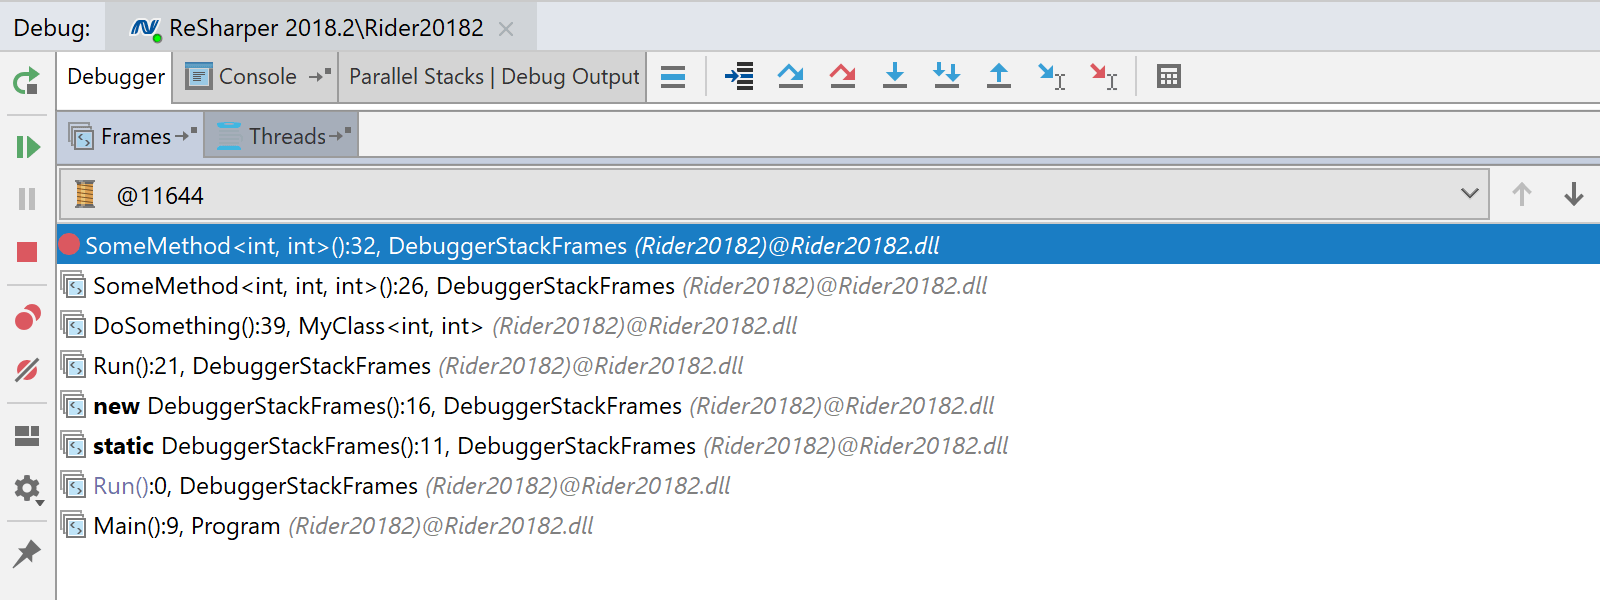
Presentation improvements were made for various language constructs: in the following example, we can see generic parameters are displayed in method signatures and class names. Constructors are no longer displayed as .ctor, instead they are shown as the type name with new in front of them. Static constructors are shown as static.
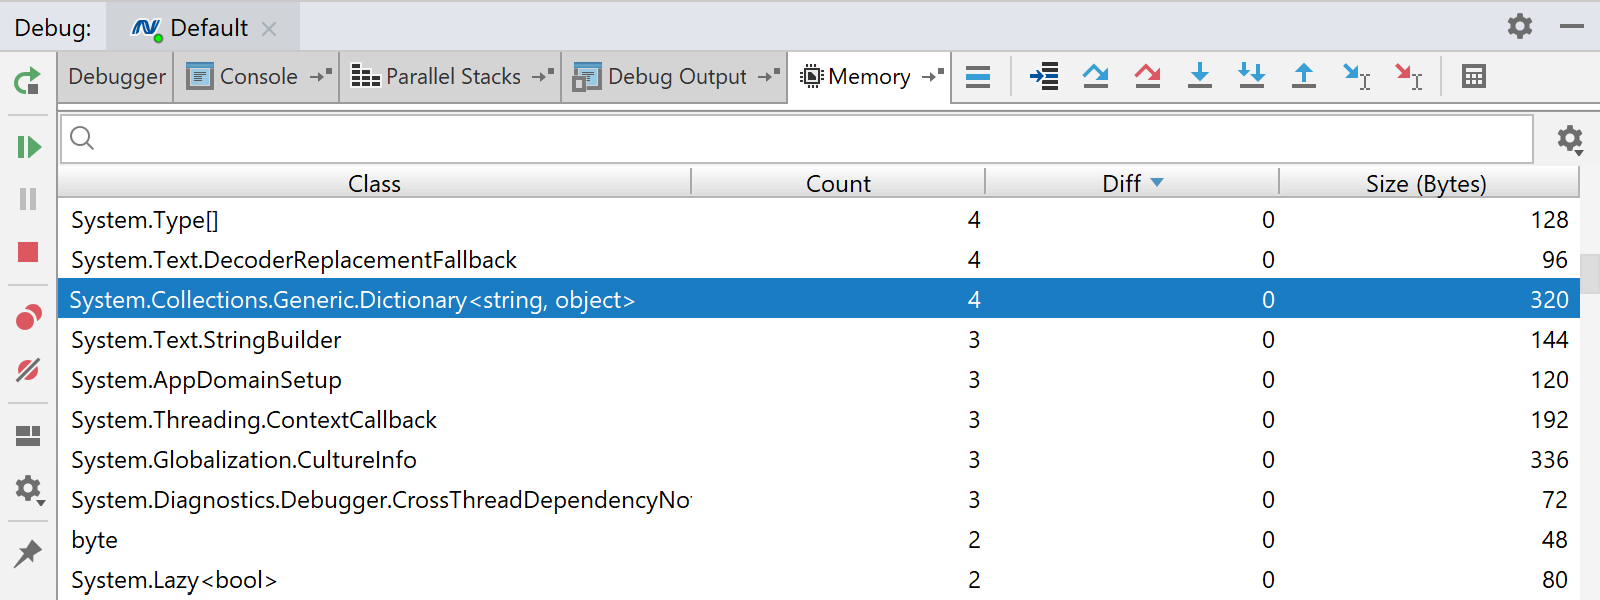
The memory view now also formats types using this approach, showing C# types instead of CLR types.
These improvements should make debugging and exploring call stacks in the debugger much more productive!
Thread-specific breakpoints
Debugging multi-threaded applications can be challenging: whenever we continue execution, we may be on another thread the next time our breakpoint is hit. In Rider 2018.2, we’ve added thread-specific breakpoints to make debugging of multi-threaded code an easier task.
In the following example, chances are that when stepping through code we will first see i = 0 a number of times, as each of the threads executing this code initializes i to 0 within its own scope. However, we can edit our breakpoint (using the context menu) and suspend only on a specific thread. Our breakpoint will then only be hit when it is reached in the particular thread we are interested in.
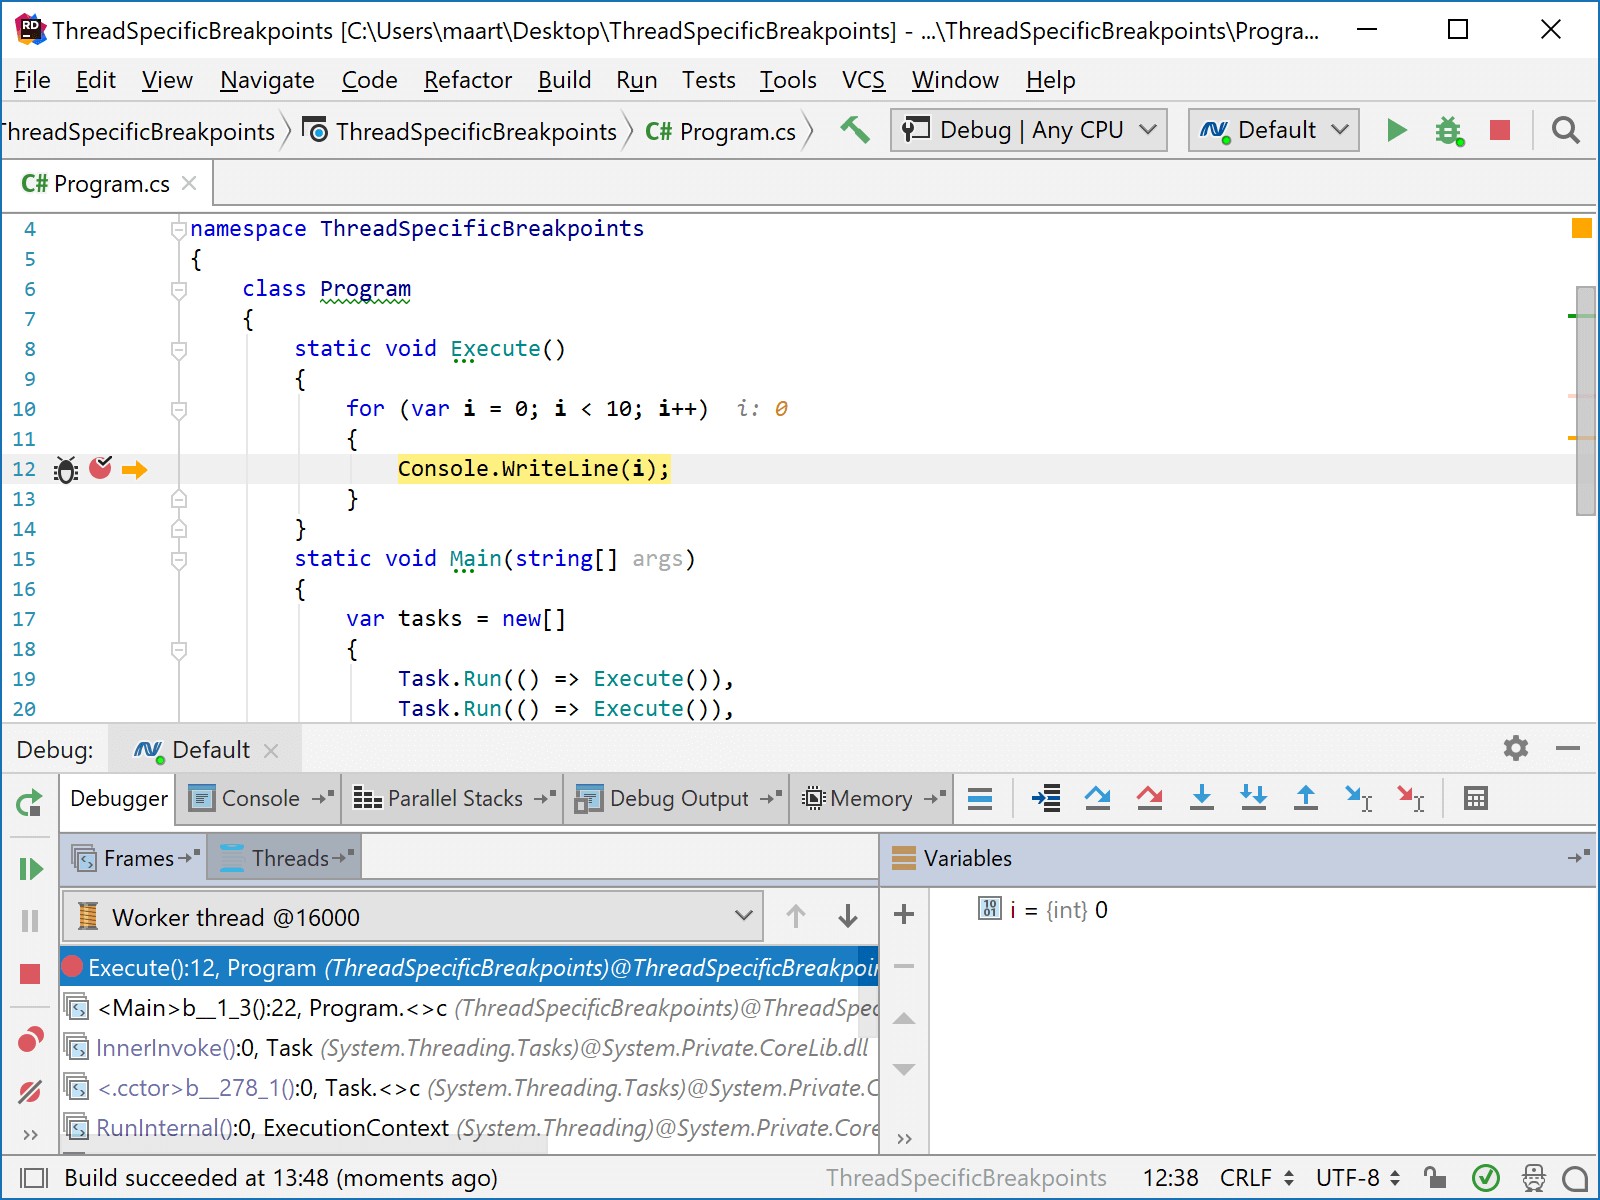
By default, Suspend only on specific thread selects the currently active thread. We can also switch to a particular thread, which can be useful when working with named threads, for example.
Support inspecting and expanding unsafe pointers
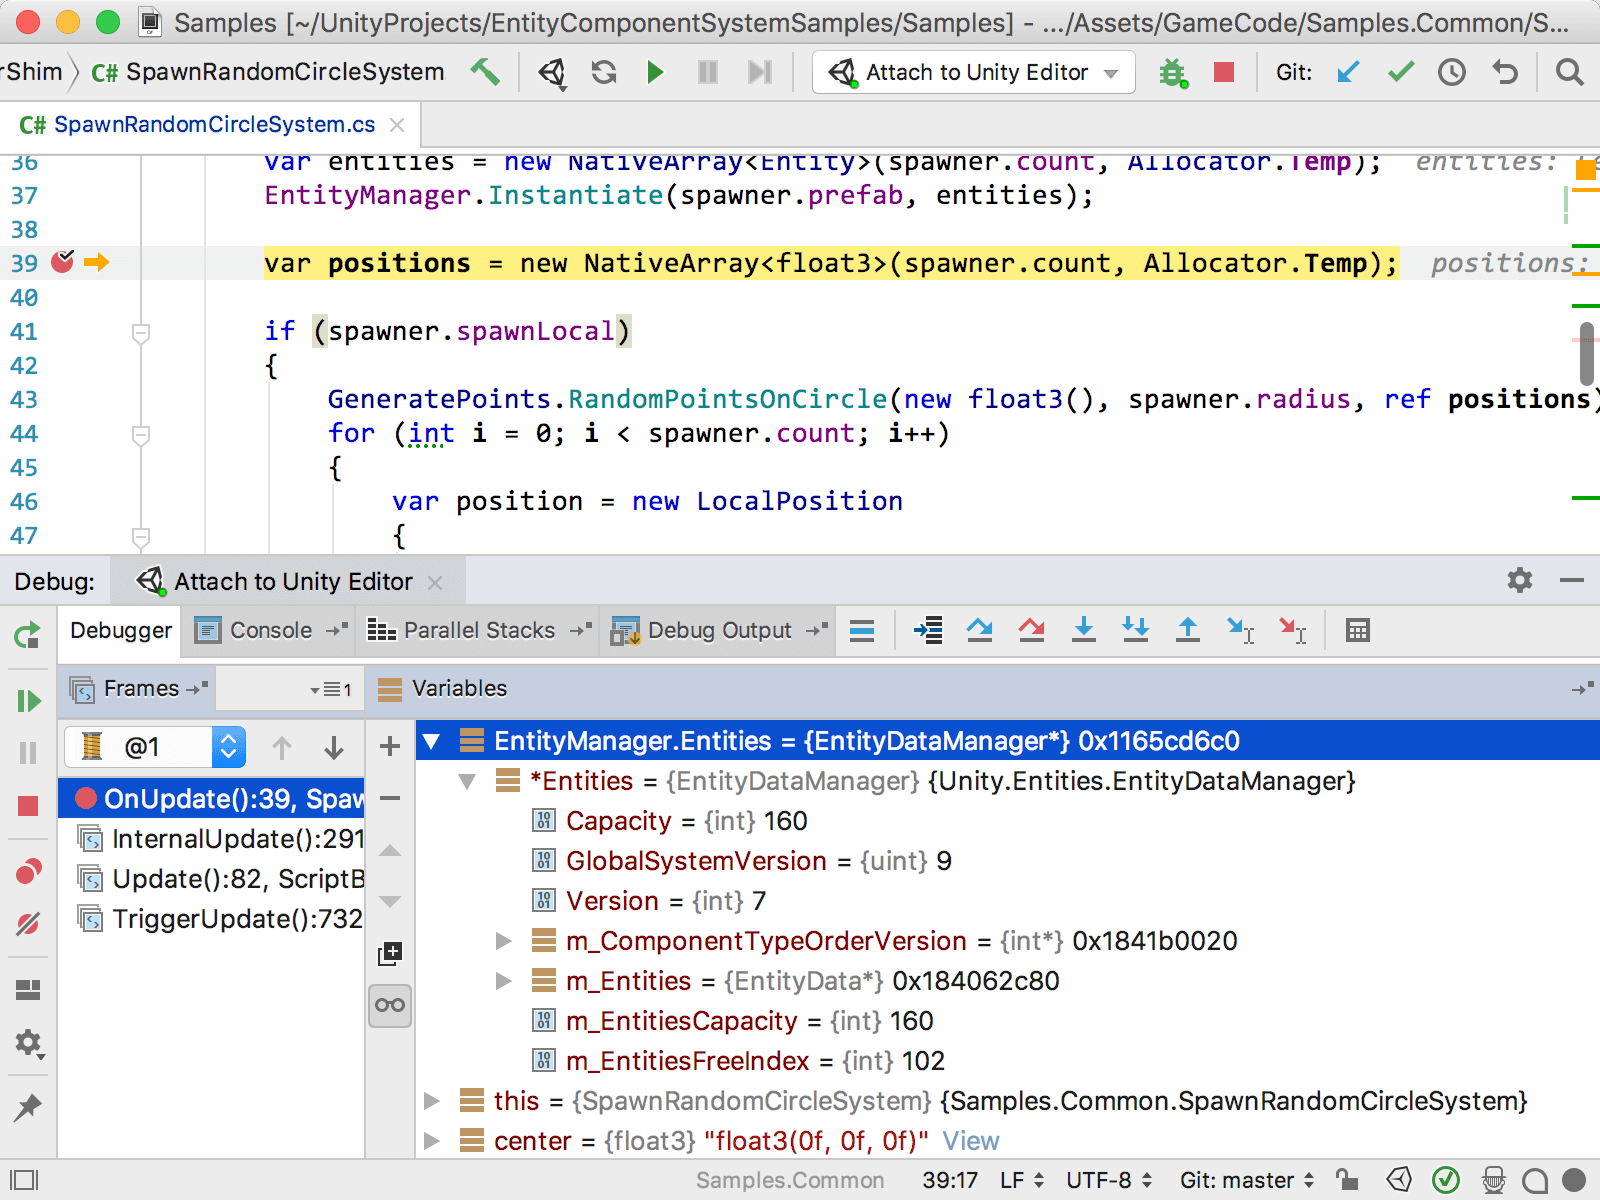
Unsafe pointers could not be expanded while debugging under Mono versions before 5.0. Thanks to a contribution to the Mono project by the folks at Unity, we were able to make an update to the Rider debugger where pointers are followed and expanded.
In the following example, the EntityManager.Entities property (which is a pointer to an EntityDataManager) can be inspected from the debugger tool window:
Other debugger improvements
A number of other updates were made to our debugger. For example, it is now possible to change the debugger’s settings while it is running. This makes it possible to do things like enabling/disabling the Ask for location of missing source files setting to determine where sources are loaded from.
Smart Step Into now correctly handles methods that are decorated with the [DebuggerStepThrough] attribute. Instead of suggesting to step into such method, Rider will step over instead.
For .NET and .NET Core, we now also support the Debugger.NotifyOfCrossThreadDependency method. “What’s that?“, you may ask. This method can be used to signal the debugger that a thread has to run in order to display a watched property or method, and that the state of the application will change because of that. For those cases, Rider will not automatically refresh watches.
We also added an option to automatically refresh all watches in the debugger tool window on every debugger pause. The Automatically refresh watches on debugger pause checkbox can be found in the settings under Build, Execution, Deployment | Debugger | .
Download Rider 2018.2 EAP now! We’d love to hear your feedback on these improvements!


