

.NET Tools
Essential productivity kit for .NET and game developers
Analyzing a memory leak discovered by our build server

A few weeks ago, I was working on a feature in Rider when I received a build failure e-mail from TeamCity, our continuous integration service. I was not allowed to merge my feature into the main product as it was causing a memory leak. Good thing: the build artifacts contained a dotMemory snapshot file, so I could start analyzing the issue right away.
Detecting this memory leak (and capturing a snapshot) was done automatically as part of a unit test we have, which uses the dotMemory Unit framework.
In this mini series:
- Analyzing a memory leak discovered by our build server (and fixing it before merging it into the product)
- Unit testing memory leaks using dotMemory Unit – setting up a similar memory test using dotMemory Unit
Here we go!
Analyzing the memory leak
Our continuous integration service (TeamCity) runs many tests for Rider as part of the build process. For example, we have a few tests that launch Rider, create a new .NET project, write some code, invoke code completion and things like that. These are automated UI tests that validate the experience our users will have on their machine.
One of the integration tests opens a “large solution” (which has 60+ projects), waits for it to load, then closes it. This unit test also attaches a memory profiler to Rider’s back-end process (an out-of-process version of ReSharper that provides C# features), and checks for memory leaks.
It was this specific test that notified me something was wrong! The build overview displayed a failing unit test, and the failure reason stated ZombieSolutionCount = 1. Translated: while the test expects the entire object graph for an open solution to be disposed after the solution is closed, something was keeping that large solution in memory…
On our TeamCity server, a memory snapshot is saved automatically when a memory unit test fails. After downloading and opening the snapshot on my machine, I searched for the Solution type. Indeed, one instance was left in memory, and retained 178 MB of memory!

A very nice feature in dotMemory is the key retention paths view. It displays a chart of objects that are keeping our object in memory. Drilling down into the leftover Solution instance revealed a good view of the object tree that was holding a reference to our object.
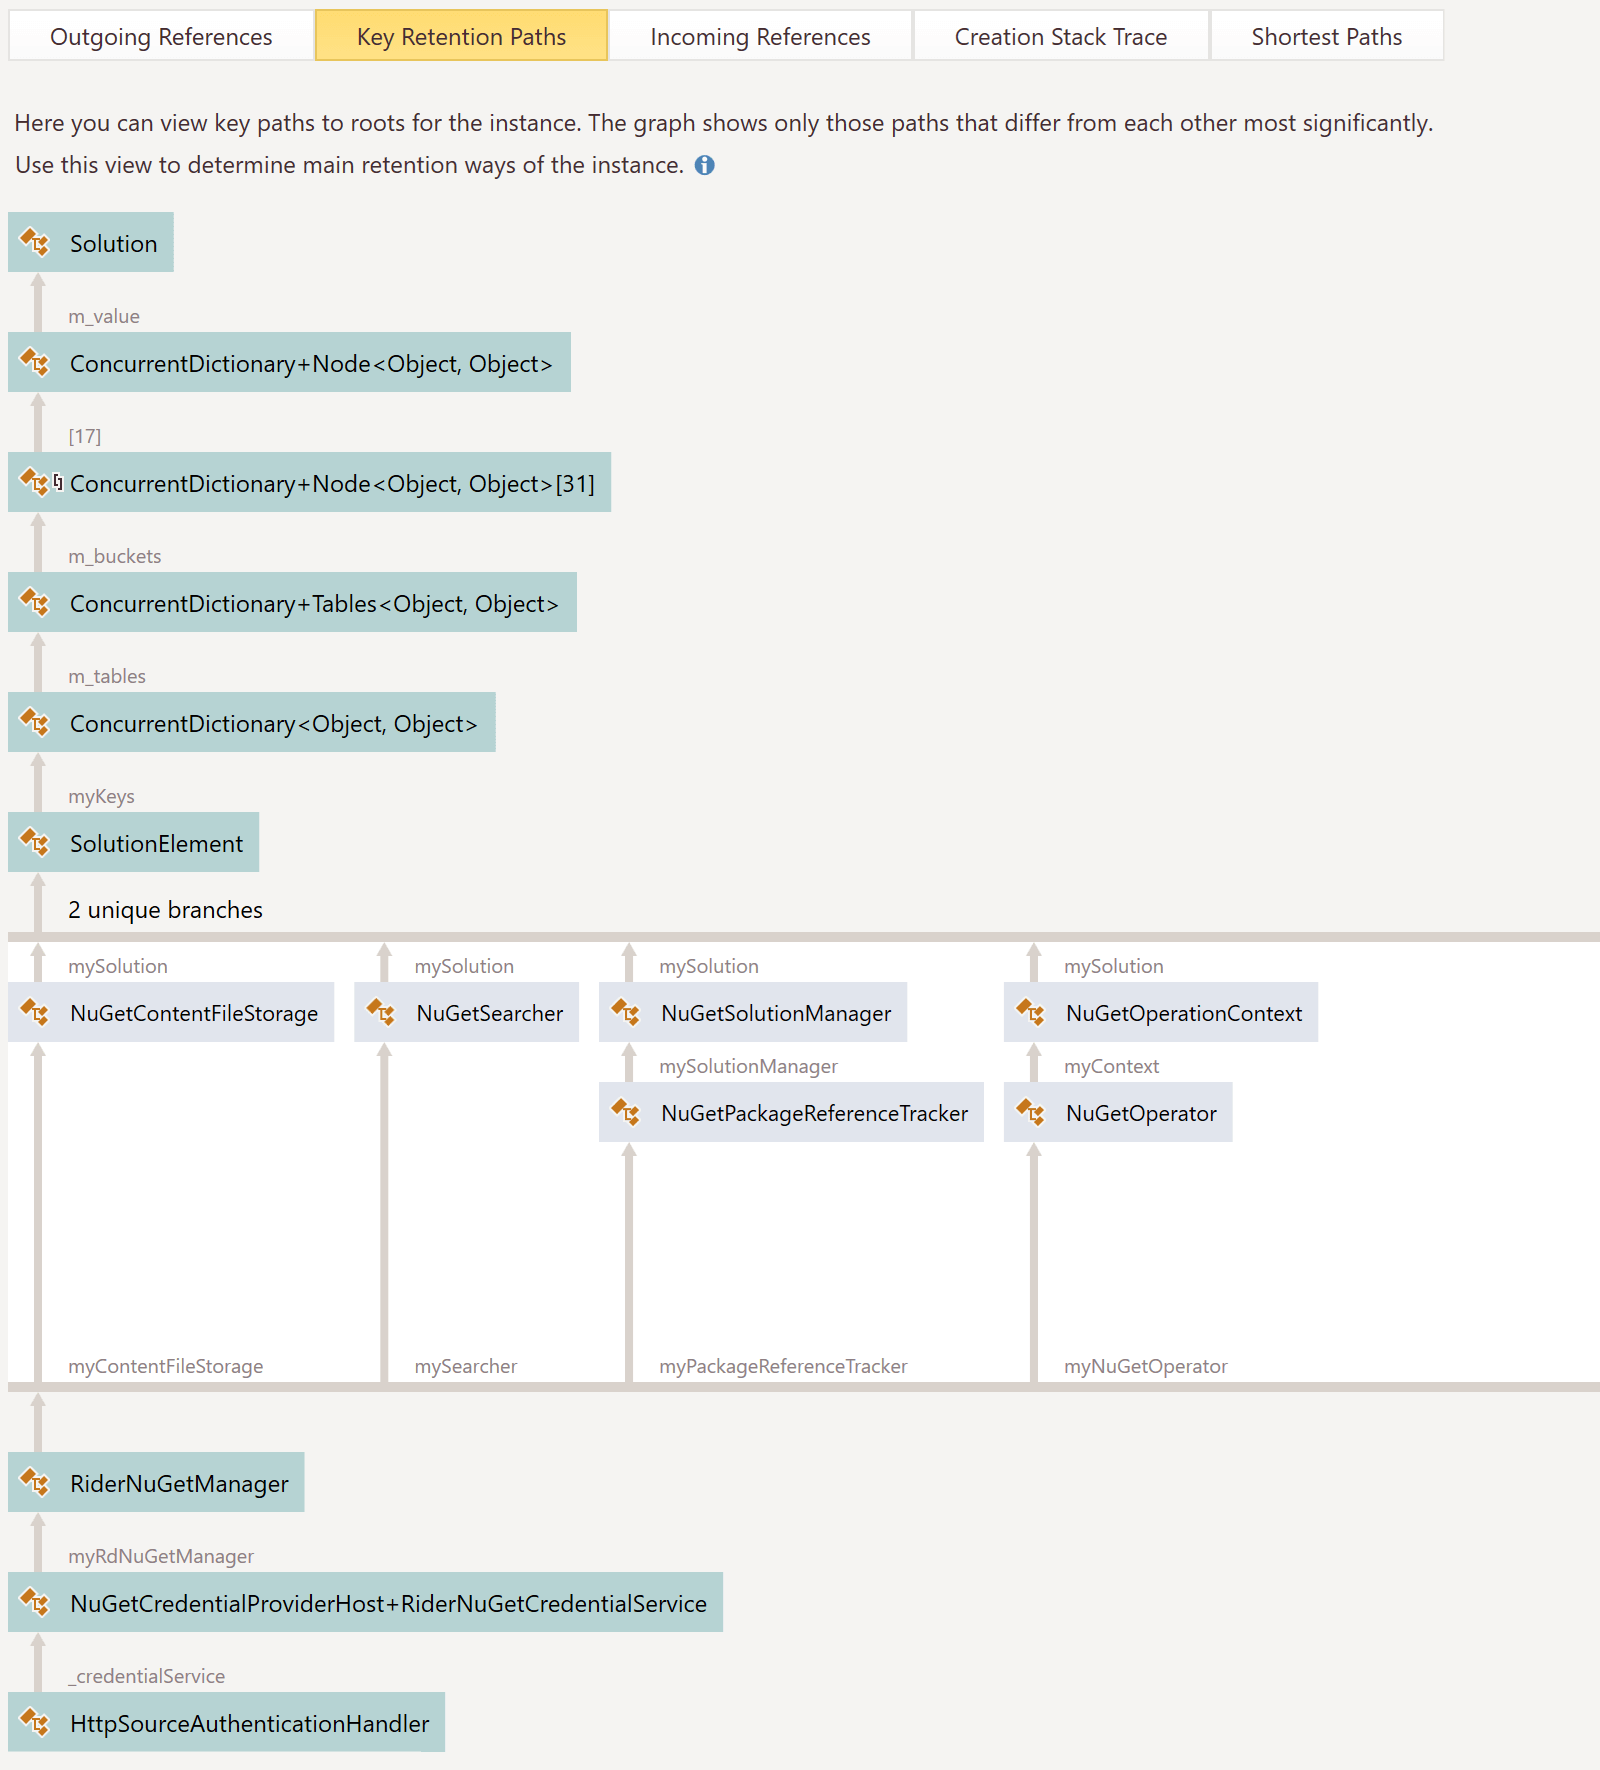
If we look at the bottom of the diagram, we will see that an HttpSourceAuthenticationHandler was keeping my RiderNuGetCredentialService in memory, which in turn has references to many other objects (via different paths), and ultimately, our Solution.
Before we dive into that, we will need a bit of background knowledge about how the Rider (and ReSharper) codebase work in terms of managing objects…
Object lifetimes in Rider
An IDE is, in essence, a big object tree: there is a solution, projects, code files, etc. Functionality becomes available when certain objects are available. Some features will be available when the solution is loaded, while others like code completion only make sense when a file is opened. Now, which objects should be disposed when just one file is closed? What when the entire solution is closed?
Rider manages memory using Lifetime objects. There’s a parent lifetime at the solution level, and various child lifetimes at other levels. Objects register themselves with a lifetime. When a lifetime is disposed, its child objects are, too. So when opening the NuGet tool window, we register it with the solution lifetime. When the solution is closed, the NuGet tool window’s object tree will be disposed as well. There is no need for the solution to track its child objects – instead child objects register themselves with the appropriate lifetime.
Now, back to our memory leak…
HttpSourceAuthenticationHandler was not being disposed
The feature I was working on hooks into NuGet’s HttpSourceAuthenticationHandler (which is also visible in the key retention paths chart earlier in this post). This is a class that lives in NuGet’s codebase and keeps track of authentication against a given NuGet feed. It also provides support to plug in a credential service, which will be invoked when a feed requires authentication and no credentials are known. Exactly the feature I was building into Rider!
Now, when a solution is loaded I was registering Rider’s credential provider with NuGet, but I forgot to tie that registration into a lifetime. In other words: there was no code unregistering the credential provider, which was thus being held in memory. And since my credential provider needed access to data from the solution, it kept a reference to Solution, causing the memory leak.
The fix was fairly simple: in the spot where I was registering Rider’s credential provider with NuGet, I would also have to hook into the solution’s lifetime to ensure it could also be unregistered:
var credentialService = new RiderNuGetCredentialService(
    lifetime, rdSolutionModel.GetNuGetHost(), rdNuGetManager, nuGetHost);

// Register credential service
nuGetHost.RegisterNuGetCredentialService(lifetime, credentialService);

// Dispose credential service when lifetime is disposed
lifetime.AddDispose(credentialService);
One commit and test run later, tests were green again – and if you now use Rider’s NuGet credential providers, the solution is properly removed from memory.
Now how do we write a test that checks for an object being disposed? That seems like the perfect topic for our next post. Stay tuned!
Give dotMemory Unit a try! It’s a powerful (and free) tool that helps make sure code is behaving the way it should be in terms of memory usage.


