

.NET Tools
Essential productivity kit for .NET and game developers
Remote debugging comes to Rider 2018.3!

The latest Rider 2018.3 Early Access Preview (EAP) build brings remote debugging of .NET, .NET Core and Mono applications! By setting up an SSH connection, we can attach to a running process on a remote machine and step into code.
Better even, remote debugging works across platforms! For example, we can debug a .NET application running on a remote Linux machine, from our Windows box. Let’s see how this works.
Connecting the debugger to a remote server over SSH
With Rider 2018.3, it is now possible to debug a .NET, .NET Core or Mono application that is deployed on a remote machine. From the Run | Attach to Remote Process… menu, we can enumerate processes on a remote server, by connecting to it over SSH.
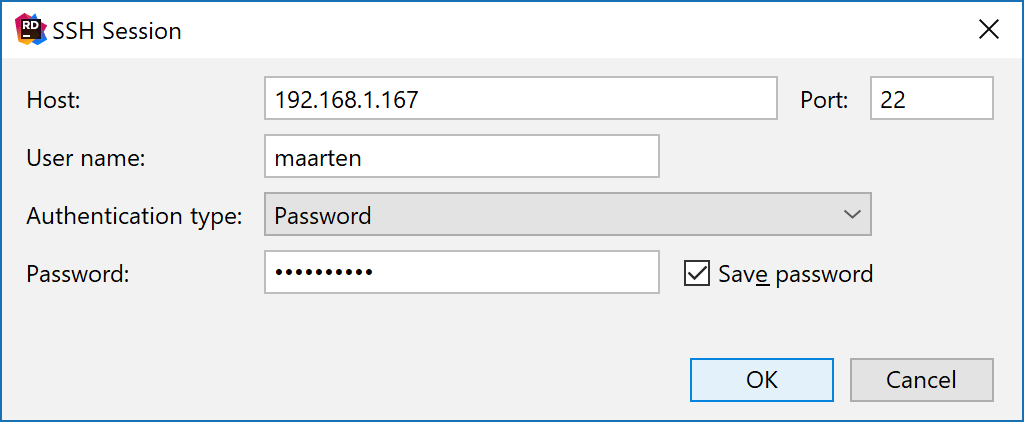
Of course, we will first have to set up such connection, which can be done from Rider’s settings under Build, Execution, Deployment | Debugger | Remote debug. We can also add a remote host the first time we use Run | Attach to Remote Process… Authentication with a remote host can be done using a password, an OpenSSH / Putty key pair, or using an OpenSSH configuration file and authentication agent.
The first time we now use the Run | Attach to Remote Process… action, Rider can connect to the remote machine and fetch a list of running processes. To do that, it requires the remote debugger tools to be uploaded and extracted on the machine, which can be done automatically.
Note that when the unzip tool is installed on the remote machine, Rider will compress (and extract) the remote debugger tools to increase transfer speed.
Once we select a remote process, Rider will attach the debugger to it and allows us to pause execution, place breakpoints, inspect variables, and so on.
Once the remote debugger tools have been loaded first time, connecting to a remote host becomes much easier. Again using the Run | Attach to Remote Process… action, Rider now immeditaly lists remote processes and lets us attach to them:
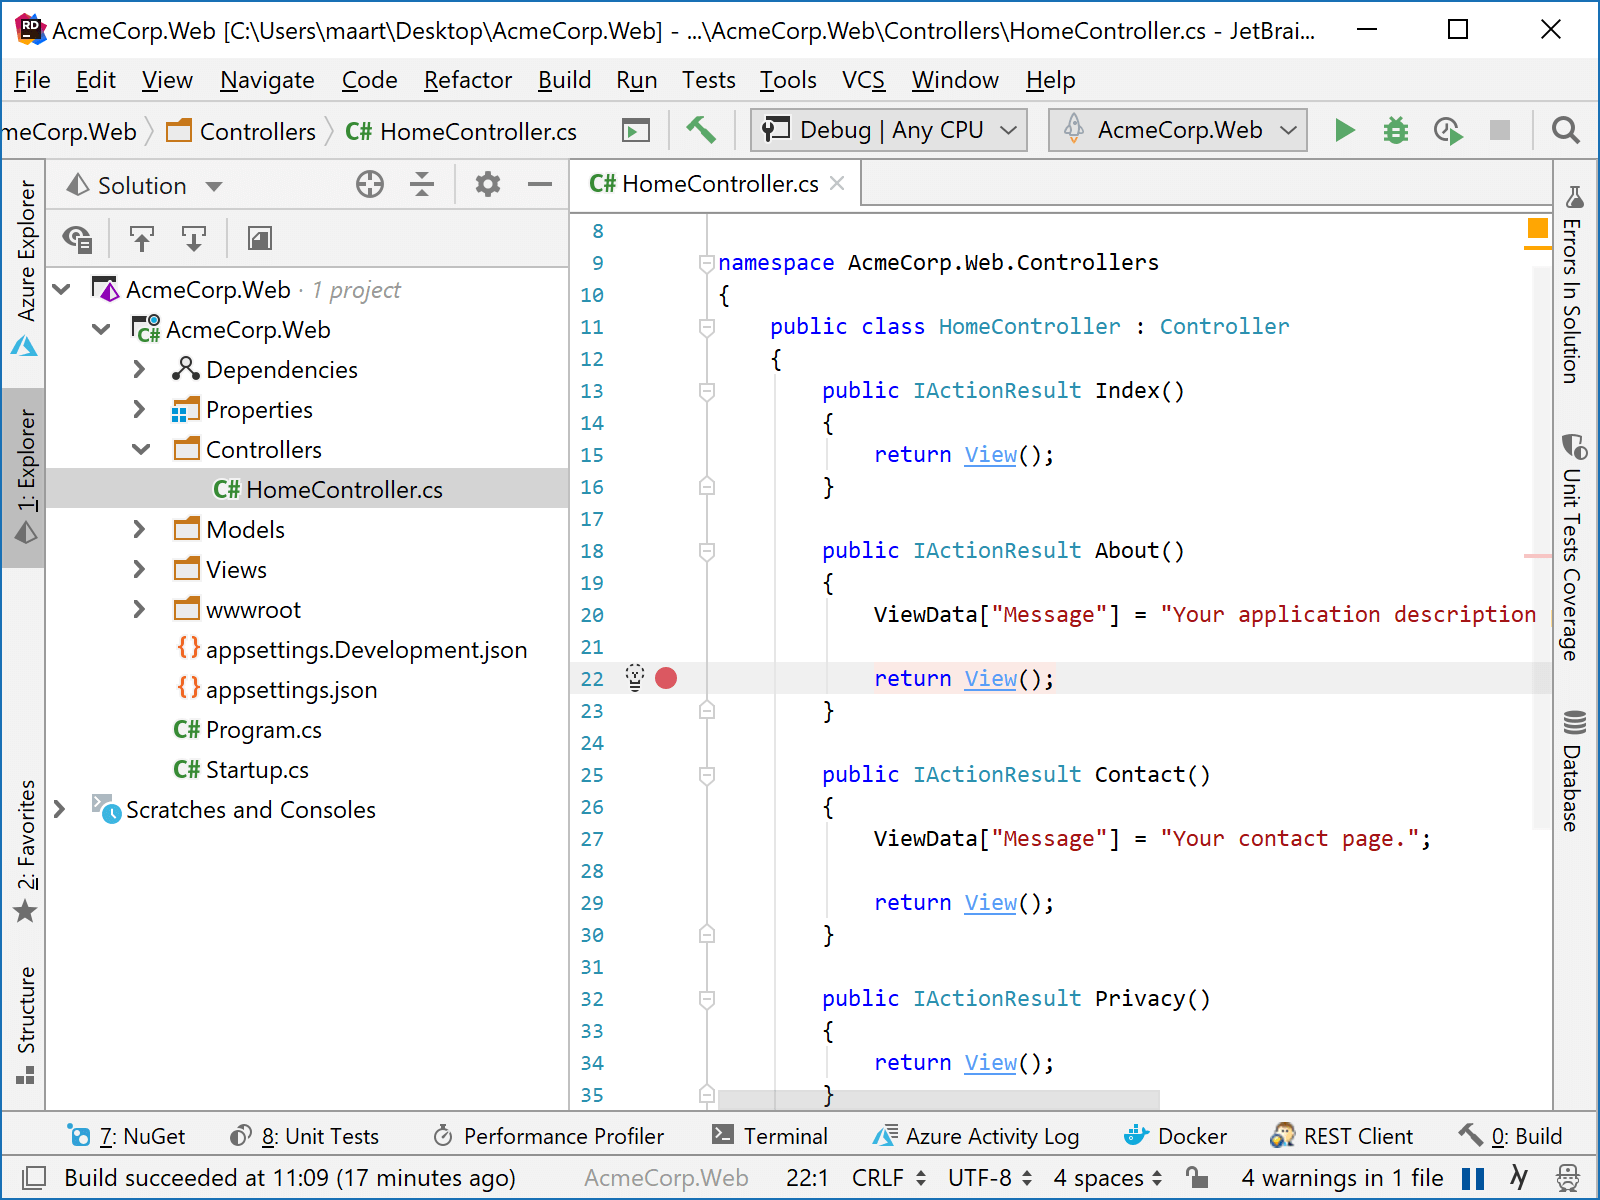
Once we select a remote process, Rider will attach the debugger to it and allows us to pause execution, place breakpoints, and so on.
Other debugger updates
Next to adding support for remote debugging, we have made a number of bugfixes and improvements to the debugger:
- We added a new expression evaluation engine, which lets us use the latest C# syntax in debugger watches.
- When inspecting variables, the context menu now lets us switch between decimal and hexadecimal for numeric values.
- Support of pointer operations (arithmetic, derefencing) in watches for .NET, .NET core, Mono and Unity 2018.3+ (when the new runtime is used) is coming in the next EAP build
Download Rider 2018.3 EAP and give it a try! We’d love to hear your feedback!


