Remote debugging comes to Rider 2018.3!
The latest Rider 2018.3 Early Access Preview (EAP) build brings remote debugging of .NET, .NET Core and Mono applications! By setting up an SSH connection, we can attach to a running process on a remote machine and step into code.
Better even, remote debugging works across platforms! For example, we can debug a .NET application running on a remote Linux machine, from our Windows box. Let’s see how this works.
Connecting the debugger to a remote server over SSH
With Rider 2018.3, it is now possible to debug a .NET, .NET Core or Mono application that is deployed on a remote machine. From the Run | Attach to Remote Process… menu, we can enumerate processes on a remote server, by connecting to it over SSH.
Of course, we will first have to set up such connection, which can be done from Rider’s settings under Build, Execution, Deployment | Debugger | Remote debug. We can also add a remote host the first time we use Run | Attach to Remote Process… Authentication with a remote host can be done using a password, an OpenSSH / Putty key pair, or using an OpenSSH configuration file and authentication agent.
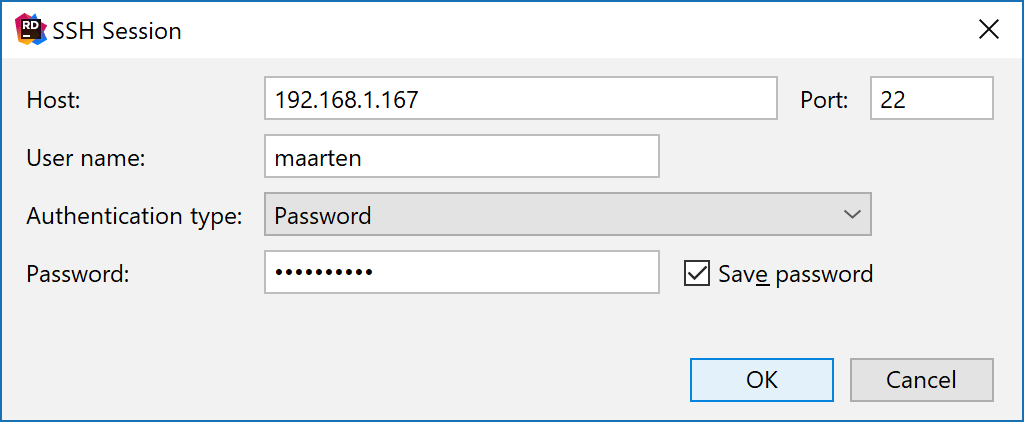
The first time we now use the Run | Attach to Remote Process… action, Rider can connect to the remote machine and fetch a list of running processes. To do that, it requires the remote debugger tools to be uploaded and extracted on the machine, which can be done automatically.
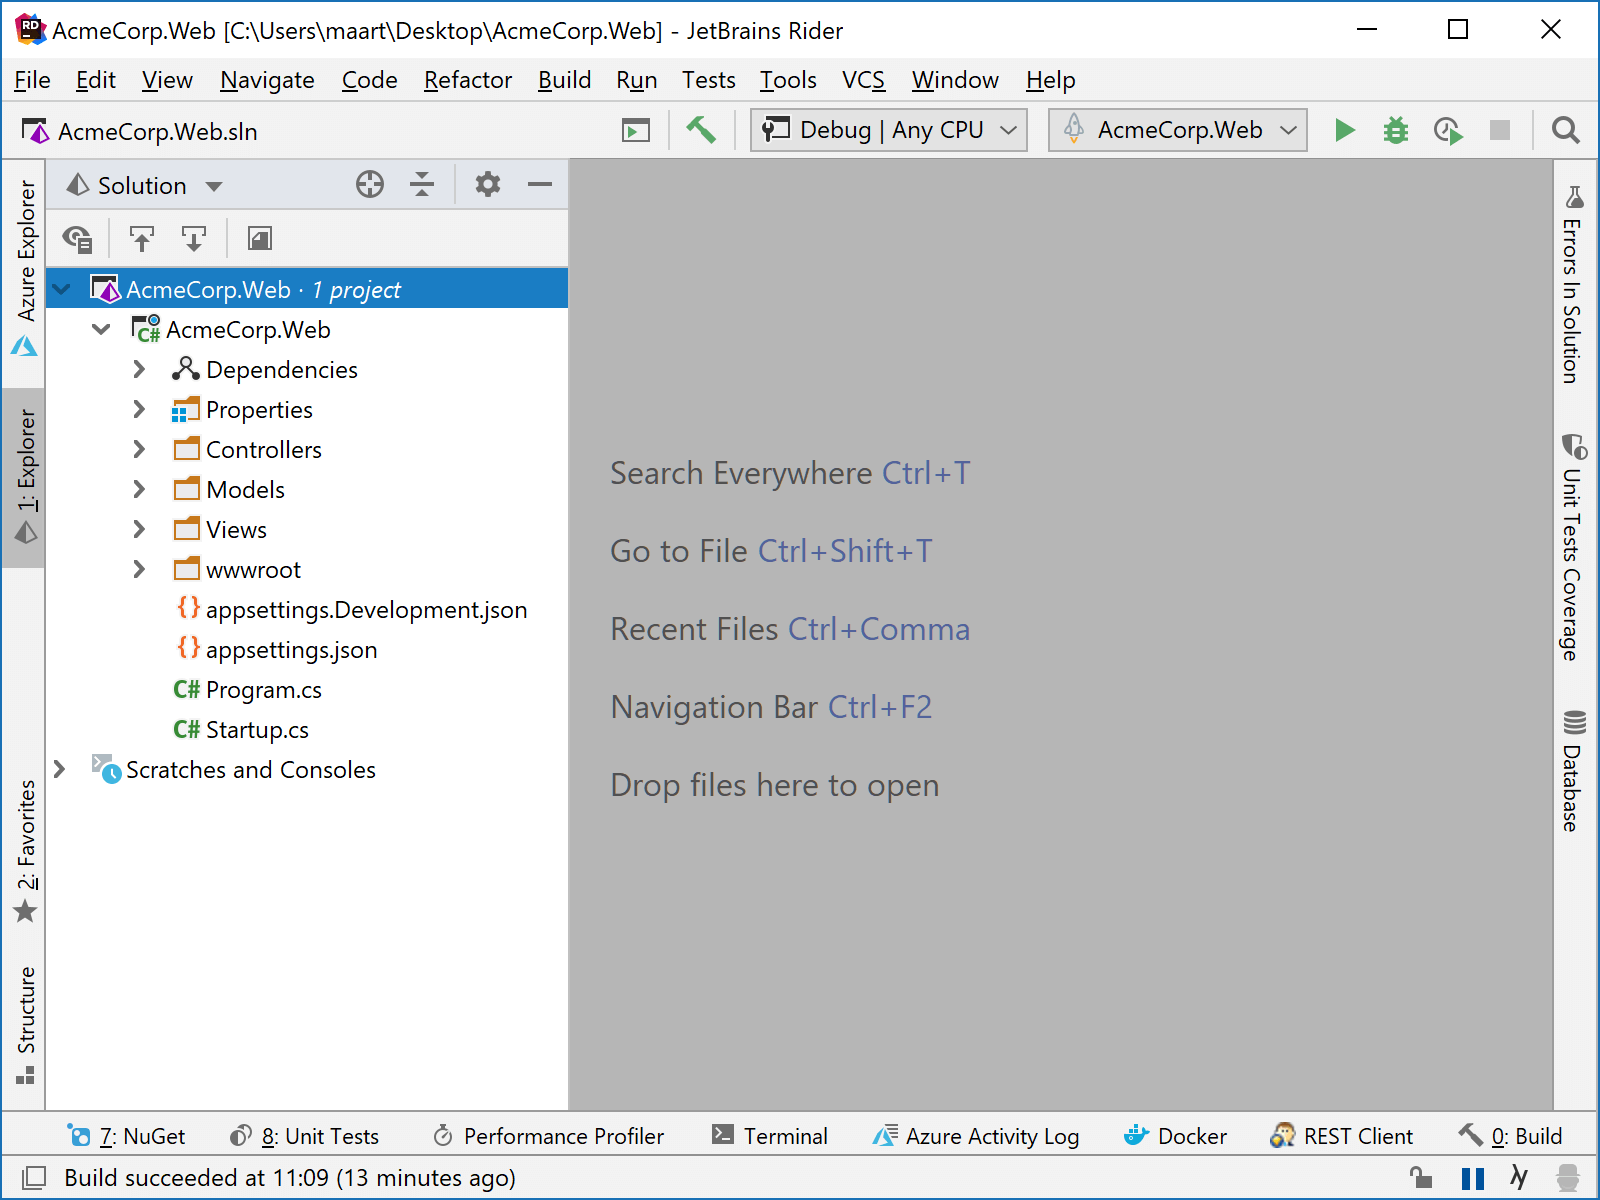
Note that when the unzip
tool is installed on the remote machine, Rider will compress (and extract) the remote debugger tools to increase transfer speed.
Once we select a remote process, Rider will attach the debugger to it and allows us to pause execution, place breakpoints, inspect variables, and so on.
Once the remote debugger tools have been loaded first time, connecting to a remote host becomes much easier. Again using the Run | Attach to Remote Process… action, Rider now immeditaly lists remote processes and lets us attach to them:
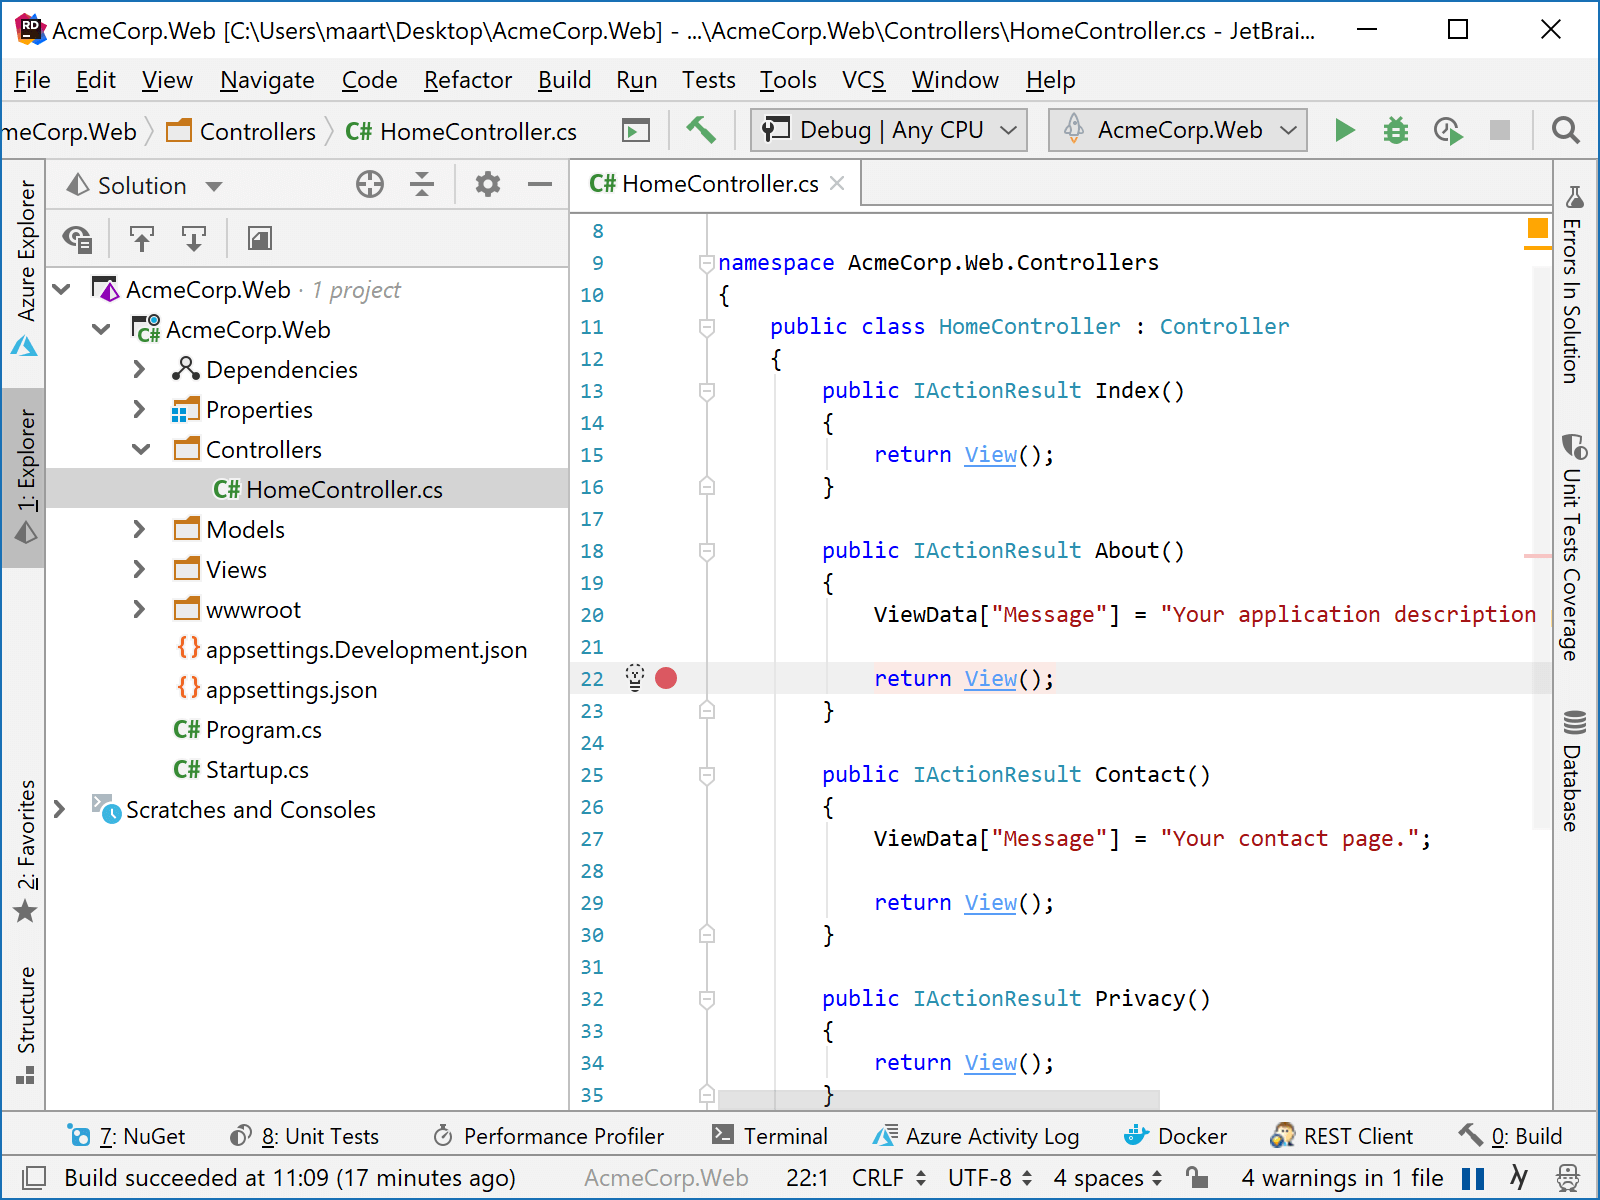
Once we select a remote process, Rider will attach the debugger to it and allows us to pause execution, place breakpoints, and so on.
Other debugger updates
Next to adding support for remote debugging, we have made a number of bugfixes and improvements to the debugger:
- We added a new expression evaluation engine, which lets us use the latest C# syntax in debugger watches.
- When inspecting variables, the context menu now lets us switch between decimal and hexadecimal for numeric values.
- Support of pointer operations (arithmetic, derefencing) in watches for .NET, .NET core, Mono and Unity 2018.3+ (when the new runtime is used) is coming in the next EAP build
Download Rider 2018.3 EAP and give it a try! We’d love to hear your feedback!
Kirill Rakhman says:
November 29, 2018Can I use this to debug an IIS application running on a Windows Server?
Maarten Balliauw says:
November 29, 2018If you can SSH into the machine, you should be able to debug it.
Dew Drop - November 30, 2018 (#2850) - Morning Dew says:
November 30, 2018[…] Remote debugging comes to Rider 2018.3! (Maarten Balliauw) […]
jd says:
November 30, 2018Nice move. Any update on this one ?
https://youtrack.jetbrains.com/issue/RIDER-2704
Regards
Maarten Balliauw says:
November 30, 2018Not yet, keep an eye on that issue though.
Eli says:
November 30, 2018This is really cool to have, just one thing that is unclear to me, what setup is required on the server (besides ssh ofc)
Maarten Balliauw says:
November 30, 2018Hi Eli,
SSH access of course, and a user that has privileges to look at the running process(es) you want to attach to.
Piotr says:
December 6, 2018Can I debug a .NET application on a remote Windows machine? My local machine runs on Linux.
Maarten Balliauw says:
December 6, 2018That should work, if the remote machine can be accessed over SSH (and the user has access to the process you want to debug)
Pavel says:
December 7, 2018Super awesome! .NET diagnostic tooling is really lacking on Linux, it is a pain sometimes. Great step in that direction!
Nickie S. says:
December 7, 2018Are there any plans for adding copying functionality, so I can edit, build and debug program without leaving IDE?
Maarten Balliauw says:
December 7, 2018What would “copying” functionality look like? Could you give an example?
Nikita Tsukanov says:
December 8, 2018Xamarin automatically uploads application binaries on device. Same could be done with desktop.
Nickie S. says:
December 8, 2018Yep, Just like this
Doug says:
February 28, 2019Is this possible?
Stas says:
March 28, 2019Hey Maarten,
Any update on that?
Maarten Balliauw says:
March 29, 2019You mean auto-copying updated binaries to the remote server? Would you mind opening an issue for this on https://youtrack.jetbrains.com/issues/RIDER#newIssue that describes more in detail what it should do?
3dGrabber says:
July 17, 2019I made a POC for this “deploy and debug” functionality.
https://github.com/3dGrabber/RiderRemoteDebug
Is it possible to further streamline this?
Integration into Rider?
Maarten Balliauw says:
July 17, 2019That’s pretty nifty! Would you mind opening a feature request on https://youtrack.jetbrains.com/issues/RIDER#newIssue ?
Alex says:
August 8, 2019here’s the feature request https://youtrack.jetbrains.com/issue/RIDER-31279
Bob Gonsalves says:
December 17, 2018Will this effectively replace the Attach to Android Process that was in MonoDevelop? Any chance we can get a tutorial on how to do that?
arseny_chernyaev says:
December 18, 2018Rider uses the same algorithm as MonoDevelop, for now. What would you like us to improve in attach to Android process?
Bob Gonsalves says:
December 19, 2018Right now I don’t have any suggested improvements. I’ll download the EAP package and see how it feels..
Bob Gonsalves says:
June 4, 2019It turns out that Run>Attach to Unity Process works just fine for me!
Daivid Silverio says:
November 20, 2019Actually, it would be great to be able to attach to Xamarin android processes like the Android Studio IDE can do. Currently if I try to attach to a process when a debuggable application is running I get nothing.
ydrolet says:
January 28, 2019Thank you very much for this great feature! Does the remote debugger tools that are uploaded to the remote machine support ARM? I would like to remote debug .NET Core program on a Raspberry Pi. Is it possible? If not, do you have plans to support ARM in the future?
on3al says:
January 31, 2019Did this functionality make it into the released version? Is this functionality available when running Rider on OSX?
Maarten Balliauw says:
February 4, 2019Absolutely! Should be availabel from the Run menu.
George says:
March 18, 2019Can we use remote Debugging to debug a local docker container built from a docker-compose.yml?
I am able to actually hit the container using the “Attach to remote Process” feature at root@127.0.0.1:port
But i get a:
info: Microsoft.AspNetCore.Server.Kestrel[17]
api_1 | Connection id “0HLLBKT2RMC3P” bad request data: “Invalid request line: ‘SSH-2.0-JSCH-0.1.54\x0A'”
api_1 | Microsoft.AspNetCore.Server.Kestrel.Core.BadHttpRequestException: Invalid request line: ‘SSH-2.0-JSCH-0.1.54\x0A’
api_1 | at Microsoft.AspNetCore.Server.Kestrel.Core.Internal.Http.HttpParser`1.RejectRequestLine(Byte* requestLine, Int32 length)
api_1 | at Microsoft.AspNetCore.Server.Kestrel.Core.Internal.Http.HttpParser`1.GetUnknownMethod(Byte* data, Int32 length, Int32& methodLength)
api_1 | at Microsoft.AspNetCore.Server.Kestrel.Core.Internal.Http.HttpParser`1.ParseRequestLine(TRequestHandler handler, Byte* data, Int32 length)
api_1 | at Microsoft.AspNetCore.Server.Kestrel.Core.Internal.Http.HttpParser`1.ParseRequestLine(TRequestHandler handler, ReadOnlySequence`1& buffer, SequencePosition& consumed, SequencePosition& examined)
api_1 | at Microsoft.AspNetCore.Server.Kestrel.Core.Internal.Http.HttpParser`1.Microsoft.AspNetCore.Server.Kestrel.Core.Internal.Http.IHttpParser.ParseRequestLine(TRequestHandler handler, ReadOnlySequence`1& buffer, SequencePosition& consumed, SequencePosition& examined)
api_1 | at Microsoft.AspNetCore.Server.Kestrel.Core.Internal.Http.Http1Connection.TakeStartLine(ReadOnlySequence`1 buffer, SequencePosition& consumed, SequencePosition& examined)
api_1 | at Microsoft.AspNetCore.Server.Kestrel.Core.Internal.Http.Http1Connection.ParseRequest(ReadOnlySequence`1 buffer, SequencePosition& consumed, SequencePosition& examined)
api_1 | at Microsoft.AspNetCore.Server.Kestrel.Core.Internal.Http.Http1Connection.TryParseRequest(ReadResult result, Boolean& endConnection)
api_1 | at Microsoft.AspNetCore.Server.Kestrel.Core.Internal.Http.HttpProtocol.ProcessRequests[TContext](IHttpApplication`1 application)
api_1 | at Microsoft.AspNetCore.Server.Kestrel.Core.Internal.Http.HttpProtocol.ProcessRequestsAsync[TContext](IHttpApplication`1 application)
I am not sure this is a rider issue, a docker issue, or a dotnet core setup issue.
Maarten Balliauw says:
March 18, 2019You can use the regular Docker debugging for now. Docker compose debugging is not (yet) supported.
George says:
March 18, 2019That is why I went down the path of trying to get remote debugging to work. Any suggestions for hooking into a Docker container (manually) that was built from a compose file? This Blog https://blog.jetbrains.com/dotnet/2018/07/18/debugging-asp-net-core-apps-local-docker-container/
is directed at Windows users. I am on MacOS, using Docker For Mac.
As you can imagine setting up containers individually is immensely cumbersome, especially with out my compose file is setup.
George says:
March 18, 2019with how*
Maarten Balliauw says:
March 18, 2019The flow for debugging one specific container should be the same as described in that post (another example of running a specific container: https://blog.jetbrains.com/dotnet/2019/03/05/connecting-microsoft-sql-server-linux-docker-container-rider/)
Docker compose debugging is on the planning for 2019.2: https://youtrack.jetbrains.com/issue/RIDER-17801
vb says:
April 18, 2019Is Edit and continue is supported
Maarten Balliauw says:
April 18, 2019It is in 2019.1 (will be released soon) – more info: https://blog.jetbrains.com/dotnet/2019/04/16/edit-continue-just-time-debugging-debugger-improvements-rider-2019-1/
vb says:
April 19, 2019thanks a lot
Kirill Rakhman says:
April 26, 2019Is there a way to debug a Docker image running in a Kubernetes pod? I can open a shell using
kubectl exec -it POD_NAME — /bin/bash
but how can I tell Rider to use that to connect?
Maarten Balliauw says:
April 26, 2019Not right now. Would you mind opening an issue for this on https://youtrack.jetbrains.com/issues/RIDER#newIssue that describes more in detail what it should do (your wishlist :-))?
Kirill Rakhman says:
April 26, 2019Done: https://youtrack.jetbrains.com/issue/RIDER-27214
Camilla says:
June 19, 2019I’m running Windows 10 in Parallels with IIS and want to debug the application from Rider on MacOs. Is this possible? I’m a little bit confused by the setup, for example – “To do that, it requires the remote debugger tools to be uploaded and extracted on the machine, which can be done automatically.” – Which remote debugger tools are you referring to and how to do this?
I installed Visual Studio 2017 Remote Debugger on my Windows installation but I don’t get the option to load the tools in Rider. I have enabled SSH on Windows and verified the connection. I’m very new to .NET development, so I’m sorry if this should be very obvious. Thanks!
Sergey Bezkrovnyi says:
July 11, 2019Hi Maarten.
I need to debug service running at the VM
– OS: Linux 5.0.6
– IP: 127.0.0.1
– Port: 18022
To check Rider 2019.1.3 possibility to do this I did the following steps:
1. Build test ConsoleApp1 application with Rider 2019.1.3
2. Copy ConsoleApp1.exe, ConsoleApp1.pdb to Linux VM, folder /test_debug
3. Set /test_debug as current directory
3. As root run command
mono –debugger-agent=address=127.0.0.1:18022,server=y,transport=dt_socket –debug ConsoleApp1.exe
4. In Rider created remote host with parameters host: 127.0.0.1; port: 18022 (credentials of root); save changes
5. Do Run -> Attach To remote Process -> select created host
6. I see popup “loading” and after couple of sec “No process to attach to”
Please, clarify what step I missed (did wrong)?
Maarten Balliauw says:
July 11, 2019Can you try without passing in those debugger agent parameters? Rider will use its own debugger and should not need the debugger agent listening.
Sergey Bezkrovnyi says:
July 11, 2019At VM:
mono ConsoleApp1.exe
at Win, RIder,
Attach to Remote Process -> select host -> hang with popup “Loading” > 2min
Then I stopped them
Maarten Balliauw says:
July 11, 2019Would you mind using the Help | Report a Bug menu and make sure to upload logs? We’re then able to see what is causing the issue.
Sergey Bezkrovnyi says:
July 11, 2019How can send you ZIp file for folder
C:\Users\sergey.bezkrovnyi.DO\.Rider2019.1\system\log
Sergey Bezkrovnyi says:
July 11, 2019Registered as RIDER-30033 by Sergey Bezkrovnyi
Maarten Balliauw says:
July 11, 2019Thanks!
Robert Wagner says:
July 30, 2019Hi,
I can’t get this to work. I’ve setup SSH and I have a .NET FX process running on the machine. When I attempt to remote debug, I get the message “No process to attach to”.
Rider 2019.1.2
Remote Machine is Windows 2019 Server Core
Maarten Balliauw says:
July 30, 2019Hi Robert,
This is a known issue and should be fixed with the next EAP release (late this/early next week) – http://www.jetbrains.com/rider/eap
Xiangyi says:
December 10, 2019Hi,
I am still not able to attach the remote debugger with rider 2019.2.3 (showing ‘no process to attach to’). It used to work flawlessly in rider 2018.
Has the issue been fixed? Thank you.
Tobias Punke says:
October 7, 2019Hi,
where are the fingerprints / known_hosts saved? When the fingerprint changes, nothing happens anymore. Where can I delete old fingerprints?
Tobias Punke says:
October 7, 2019Okay, restarting Rider seems to be enough though.
Krzysztof says:
October 30, 2019After upload tools for debug collecting processes never ends.
Application to debug is on raspberry pi in net core.
I’m using Rider 2019.3 EAP on Windows 10.
Any suggestions?
Alex says:
November 27, 2019Does Rider support remote debugging on linux-arm(64) targets?
Maarten Balliauw says:
November 27, 2019Right now, we don’t support debugging on arm/arm64 platforms, neither local nor remote. Feel free top open a feature request at https://youtrack.jetbrains.com/issues/RIDER#newIssue
Alexander Hildebrand says:
November 27, 2019Here is the issue:
https://youtrack.jetbrains.com/issue/RIDER-36025#newIssue