

.NET Tools
Essential productivity kit for .NET and game developers
Edit & Continue, Just-in-time Debugging, and more debugger improvements in Rider 2019.1

Probably the most fundamental technique in software development is Changing Stuff and Seeing What Happens. Rider 2019.1 EAP brings new features and several fixes for its powerful debugger, including edit-and-continue functionality and just-in-time debugging.
Edit & Continue
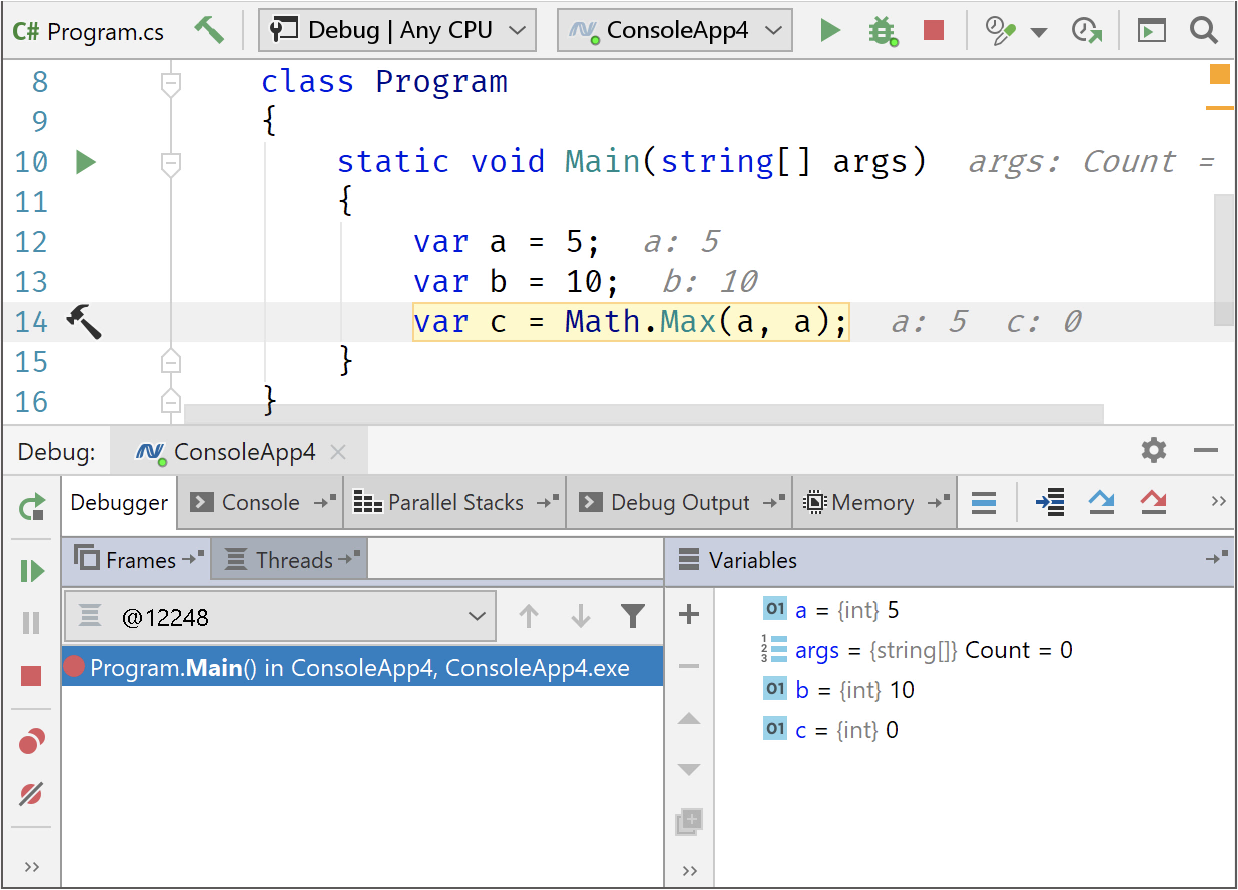
One of the highest voted feature requests for the debugger is finally here! Edit & Continue is now supported for projects targeting .NET Framework and .NET Core on Windows (except WPF). That means we can keep our application running, change the code, and continue debugging without actually restarting. The project will just recompile in the background:
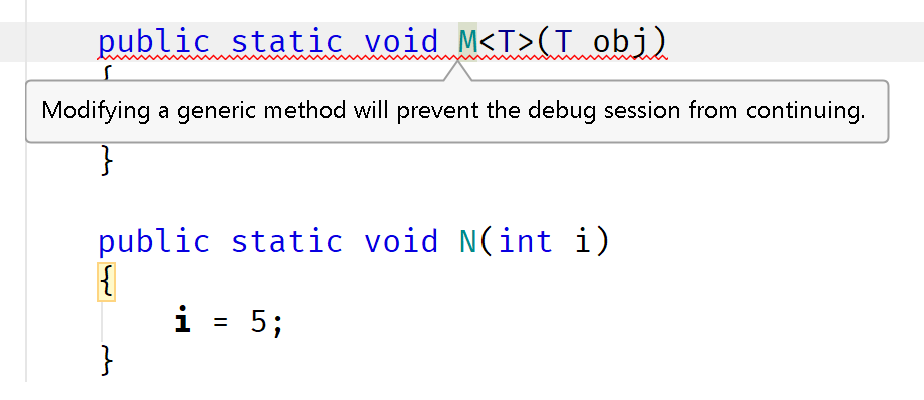
There are cases when modifying the code is not possible and a restart is required. This includes changing signatures, working in generic functions, renamings of any kind, and some more. Rider will make us aware by showing a tooltip:
Note that Edit & Continue is currently only supported on Windows as the other runtimes do not implement the required debugger APIs.
Just-In-Time Debugger
Calling Debugger.Launch is an effective way to dynamically attach the debugger whenever a certain place in our codebase is executed. In contrast to starting with the debugger attached or attaching it manually, this method can save us a lot of unnecessary execution time. If the debugger is attached, our application will run slightly slower, as the debugger has to follow what’s happening.
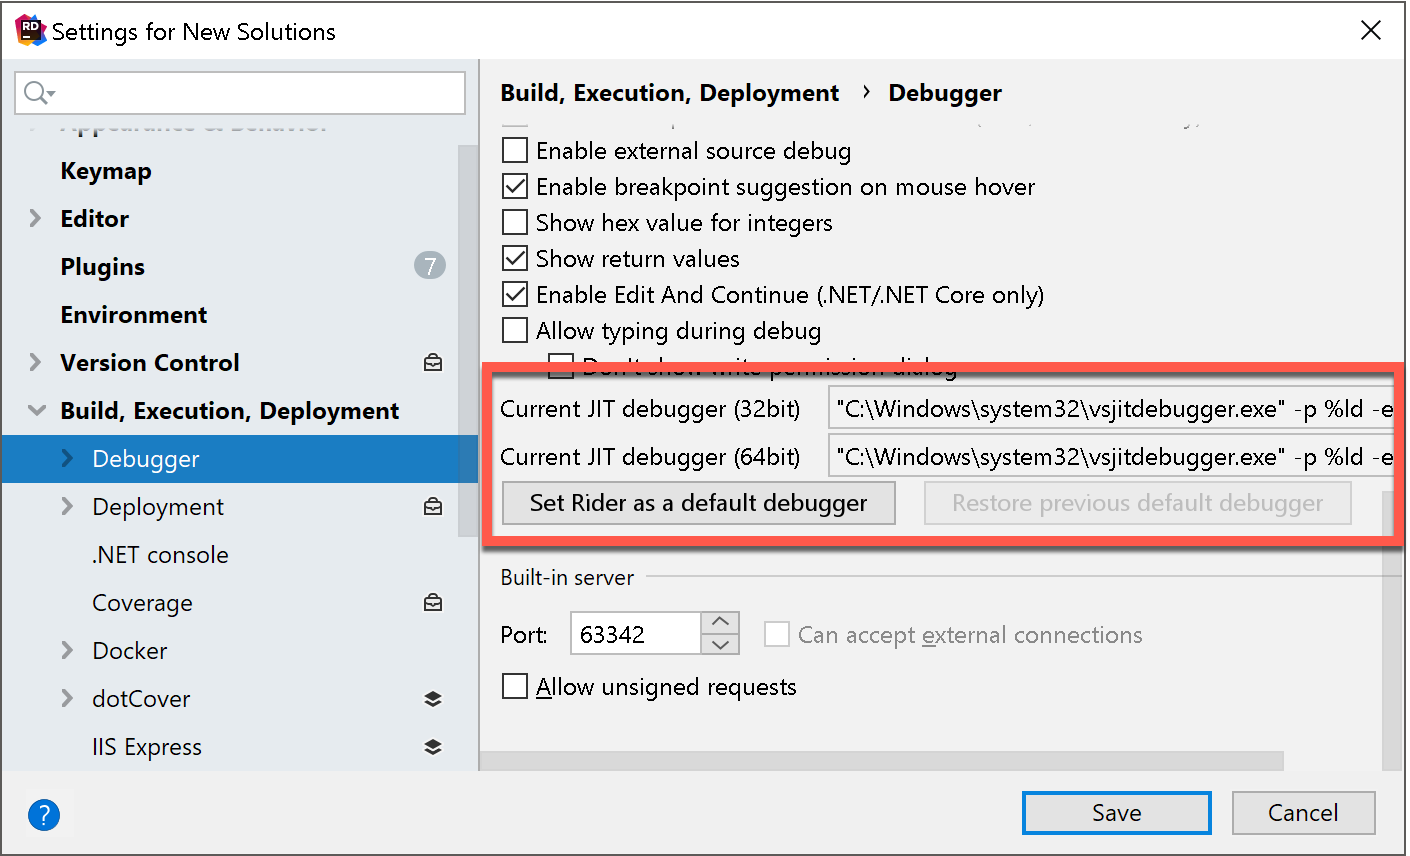
With the release of 2019.1 EAP we get the opportunity to configure Rider as our just-in-time debugger under Build, Execution, Deployment | Debugger:
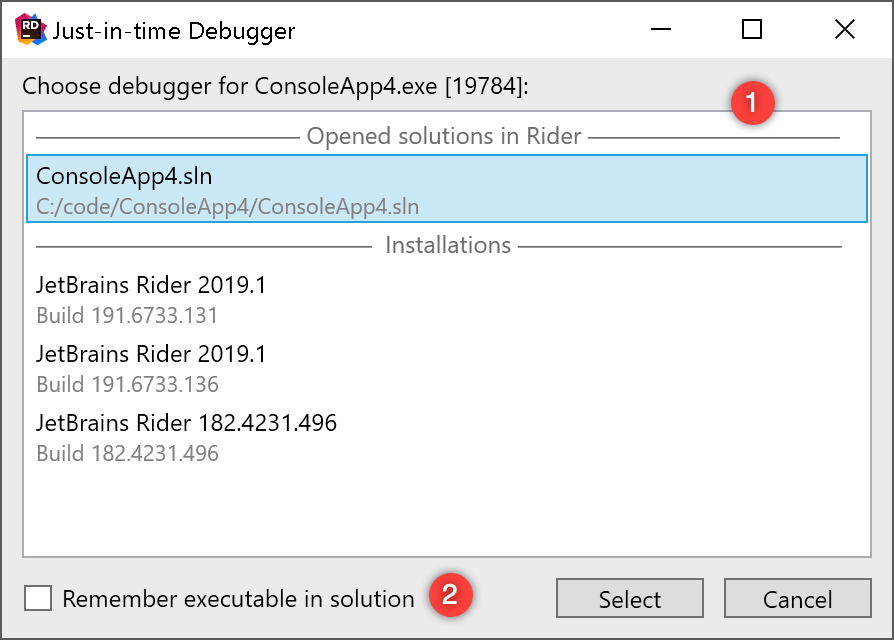
Whenever a process calls for the just-in-time debugger, we get a dialog to choose from a list of currently opened solutions, and installations that can be launched (1). An additional checkbox allows to remember the selected option (2), in which case for every future attempt, the debugger will automatically be attached:
Note that swapping the JIT Debugger is currently only supported on Windows as the other runtimes do not implement the required debugger APIs.
Tooltip Evaluation
Hovering an expression with the mouse lets us quickly take a glimpse at its actual result, regardless of its type. This feature now works with any expression type:
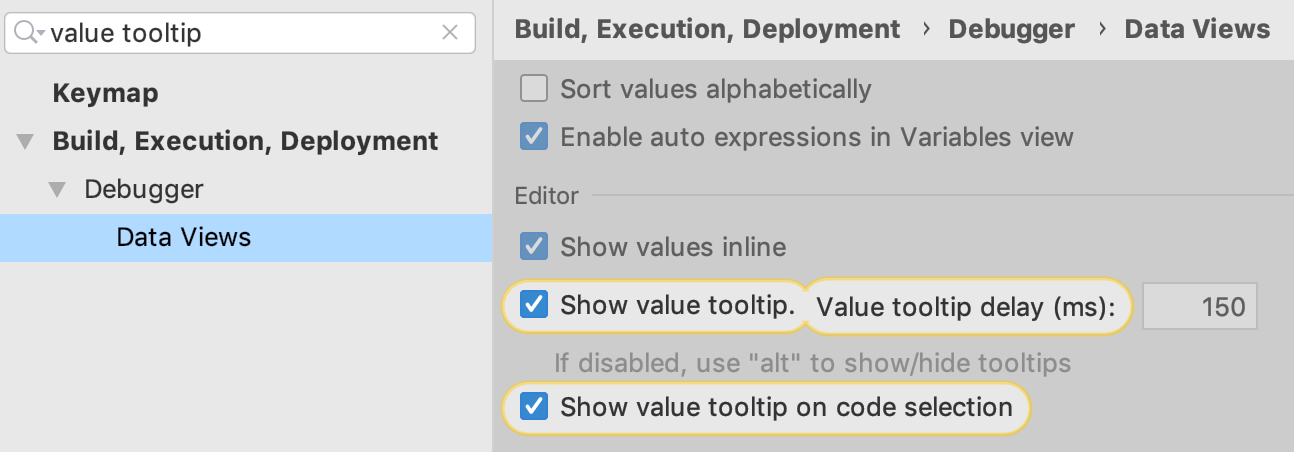
Did you know that you can inspect expressions also in a more keyboard-centric way? For this to work, first enable the Show value tooltip on code selection option under Build, Execution, Deployment | Debugger | Data Views:
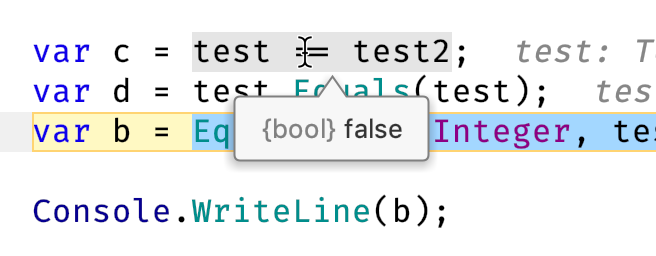
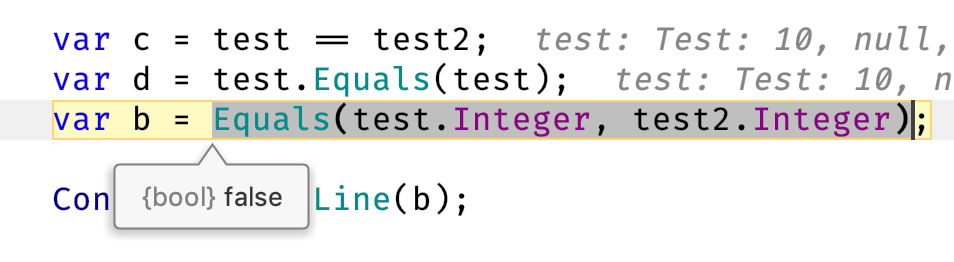
Afterwards, we can use the caret and the extend/shrink selection (Shift+Control+W or Shift+Command+W) action, to select expressions of our choice. A tooltip will appear right away:
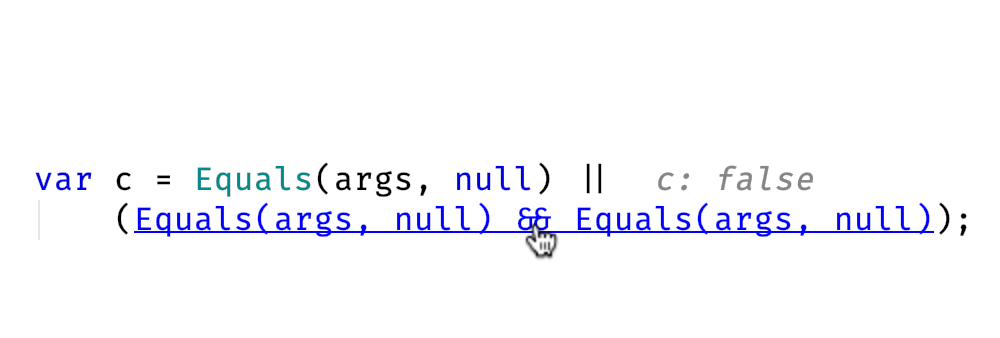
Another way of evaluating an expression is to use the Quick Evaluate Expression action (Alt+Click or Option+Click) that turns any arbitrary expression into a clickable link which then reveals the value as a tooltip:
Enhancing debugger experience
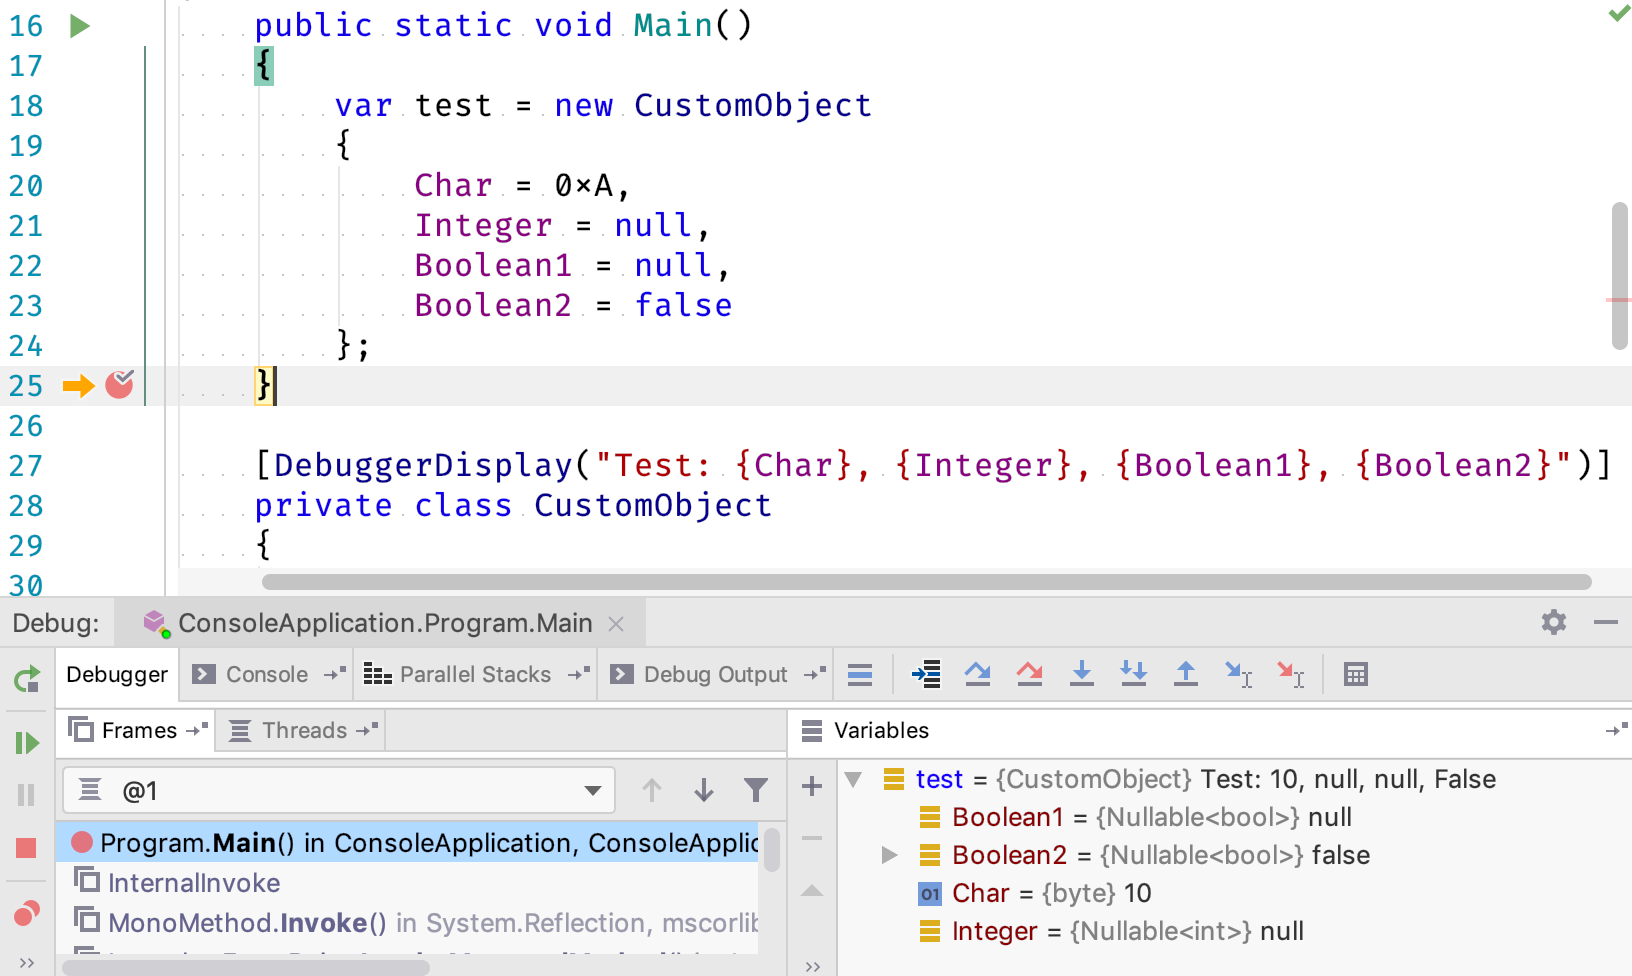
The DebuggerDisplay attribute is a good way to enhance our debugging experience. It allows to define how a certain type is represented in the debugger, without overriding ToString, which could change the actual runtime behaviour.
Rider 2019.1 EAP improves the support for DebuggerDisplayAttribute, which now correctly shows nullable types as null instead of the previous behaviour (RIDER-10280, RIDER-24334):
We’re looking forward to your feedback about our recent debugger improvements. Download Rider 2019.1 EAP now, and give it a try!


