

.NET Tools
Essential productivity kit for .NET and game developers
Cloud Debugging of ECS in Rider

Concluding our series of posts on the AWS Toolkit for Rider, let’s take a look at Cloud Debugging of ECS services!
In case you missed the earlier posts, the AWS Toolkit is a free plugin for Rider that provides support for AWS, with credential and region management, creation, local debugging and deploy of AWS Lambda functions and Cloud Debugging of .NET Core applications in ECS containers.
Once enabled, you can use all of Rider’s debugging features to debug your remote application, hosted inside ECS – everything from step in and out, advanced breakpoints to “pin to top”.
In this post, we’ll look at how to enable Cloud Debugging and debug your own applications in the cloud. And if you’d like to see the toolkit in action, check out the video on our AWS home page.
In this series:
- Introducing the AWS Toolkit for Rider
- Creating, debugging and deploying AWS Lamdba from Rider
- ECS Cloud Debugging in Rider (this post)
Cloud Debugging
Cloud Debugging is a new service from AWS that allows debugging your Amazon ECS applications, deployed with AWS Fargate, while it’s running remotely in the ECS container. Note that it currently only supports .NET Core 2.0 and 2.1. You can find out more about this in the AWS Toolkit documentation.
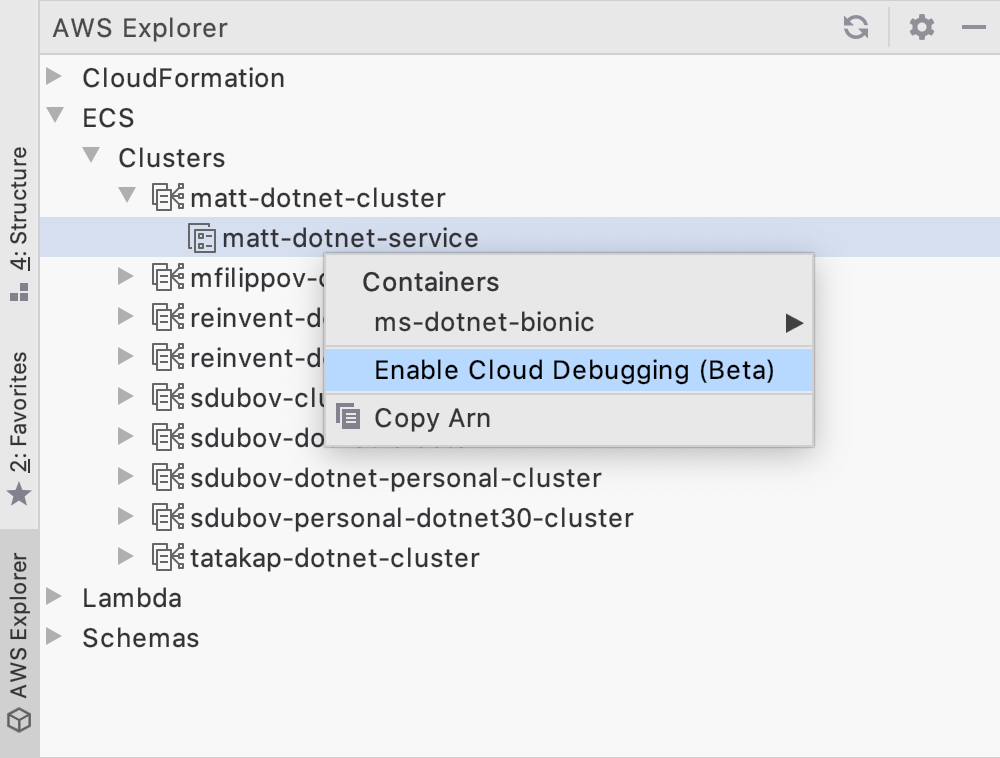
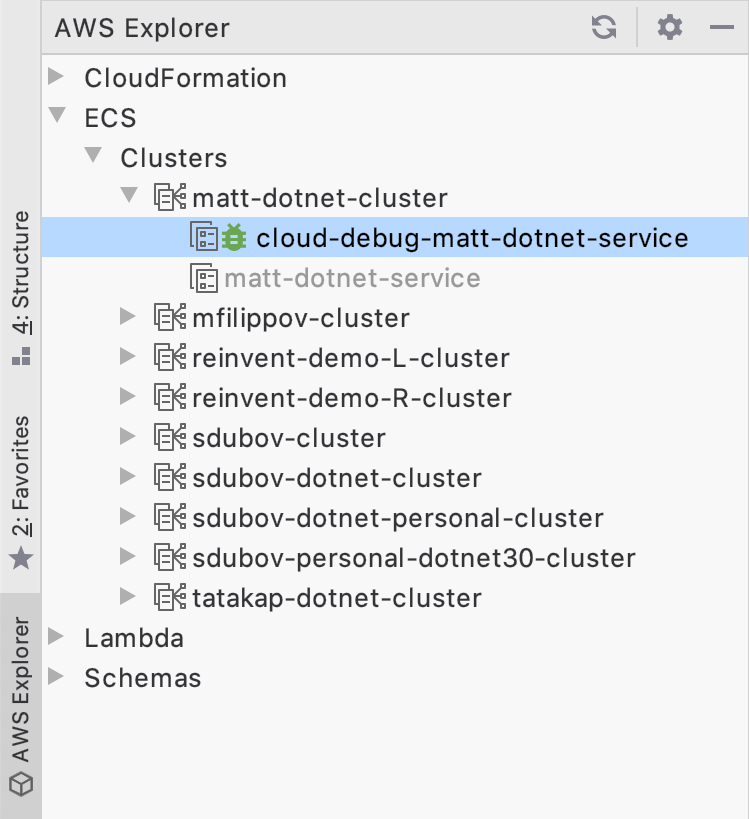
Getting started is pretty straightforward. Find your ECS service in the AWS Explorer tool window, right click and select Enable Cloud Debugging. If you can’t find any services, make sure you have the right credentials and region selected in the status bar widget. See the post on working with AWS Lambda for more details.
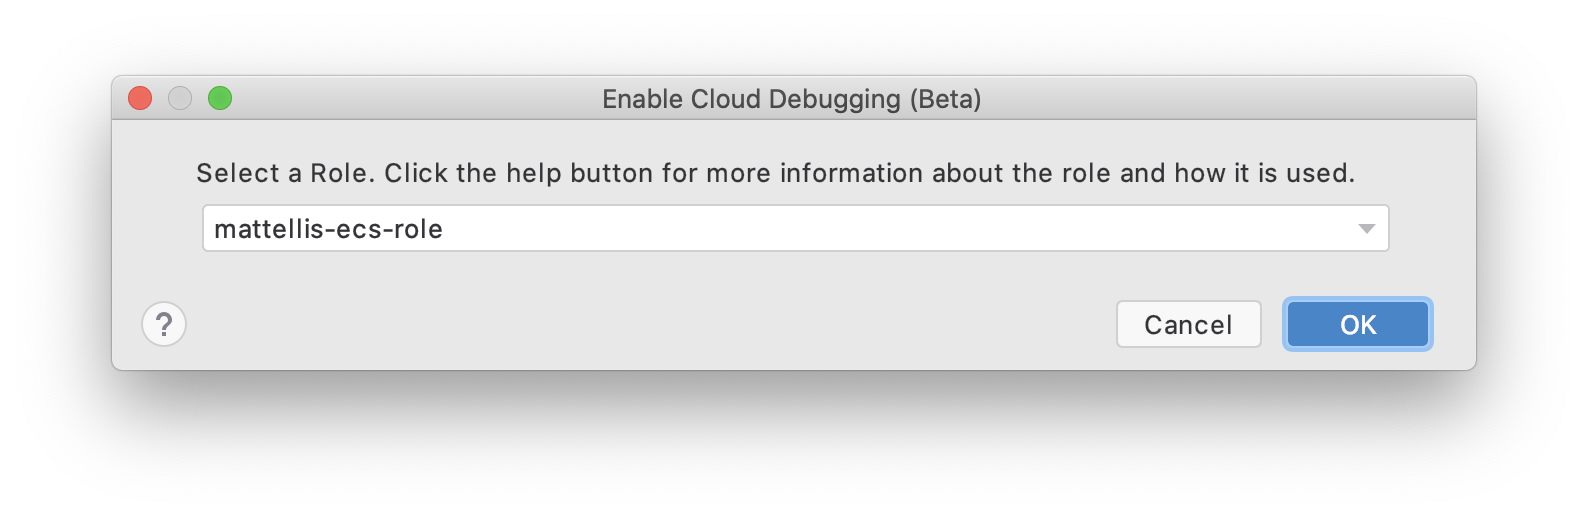
The AWS Toolkit will then ask for a role to use to configure your resources. Check the AWS documentation to make sure the role is configured correctly.
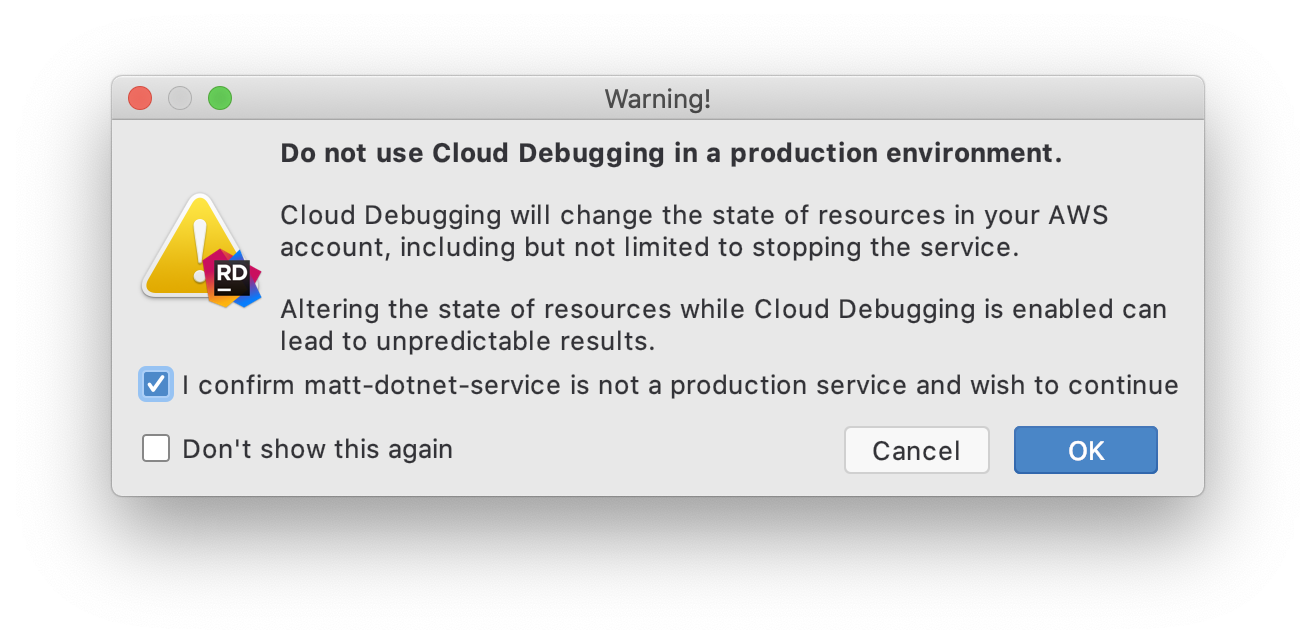
At this point, you’ll get a warning not to use Cloud Debugging on production services.
The AWS Toolkit will reconfigure, stop and restart your existing service, so it shouldn’t be used on something you rely on in production. Instead, Cloud Debugging is intended to allow debugging your application in a production-like environment, hosted in ECS, with full access to AWS services in a way that’s very hard to recreate when running locally.
Once you’ve accepted the warning, your service will be reconfigured. This will take a few minutes, but only needs to be done once. If you refresh the AWS Explorer, you will now see an additional service for your ECS cluster, marked with a debug icon. This is a clone of your production service, configured for debugging. You’ll also notice that your production service is still there, but stopped.
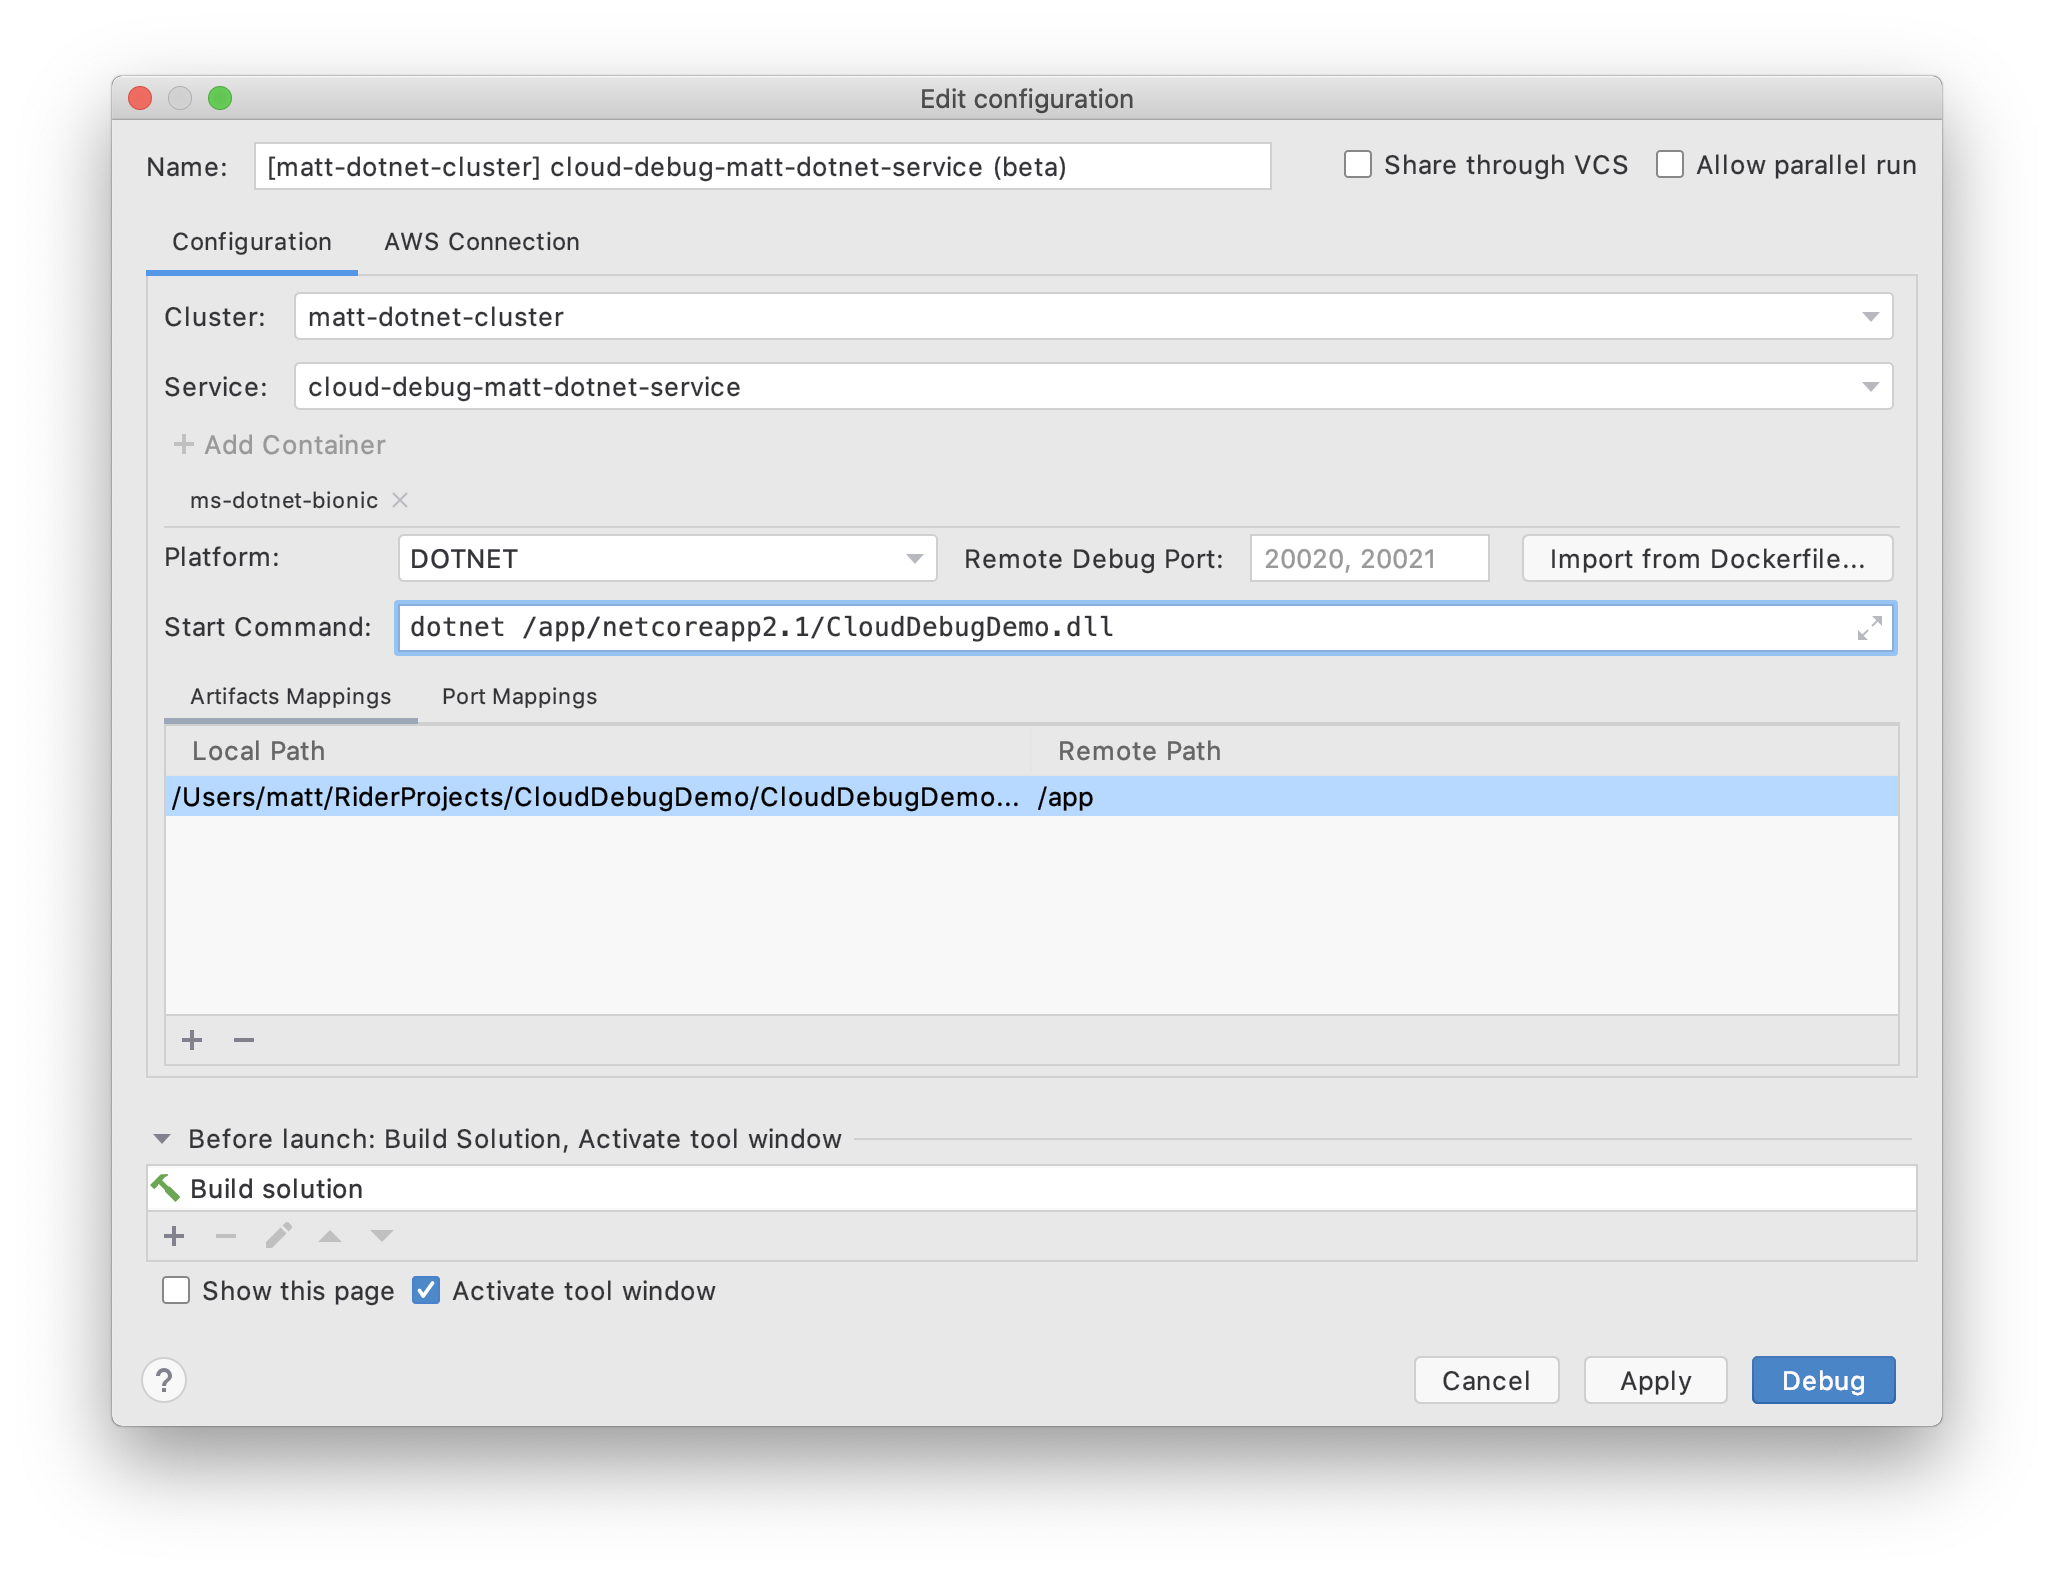
To debug your application, right click and select Debug. This creates a new run configuration with the cluster and service already pre-selected, but it still needs artefact and port mapping, as well as a start command.
If your application is deployed using a Dockerfile, you can import it here, and the AWS Toolkit will read the folder and port mappings, as well as the start command and automatically populate the dialog.
However, it’s also easy to configure manually. Map the output folder of your application (such as CloudDebugDemo/bin/debug/netcoreapp2.1) to the location in your remote container where the app is run from, such as /app. Rider will make sure that this remote application folder is kept up to date and in sync with the local output folder before debugging. This means that any existing files are overwritten – another reminder that Cloud Debugging is not intended to debug production deployed services.
The start command depends on what kind of .NET Core application you’re deploying. Assuming it’s a .NET Core console application called CloudDebugDemo, set this to dotnet netcoreapp2.1/CloudDebugDemo.dll, changing the name of the dll for your application.
A useful tip is to add a Before Launch step that will build the solution before launching the run configuration. This makes sure that the solution is up to date when debugging starts.
Clicking Debug will upload any changes from the local project to the remote application folder. This is an incremental upload, based on rsync – if there are no changes, nothing is uploaded.
The first time the project is debugged, the AWS Toolkit will also upload Rider’s remote debugging toolset. This will also take a few minutes, but again, only needs to happen once.
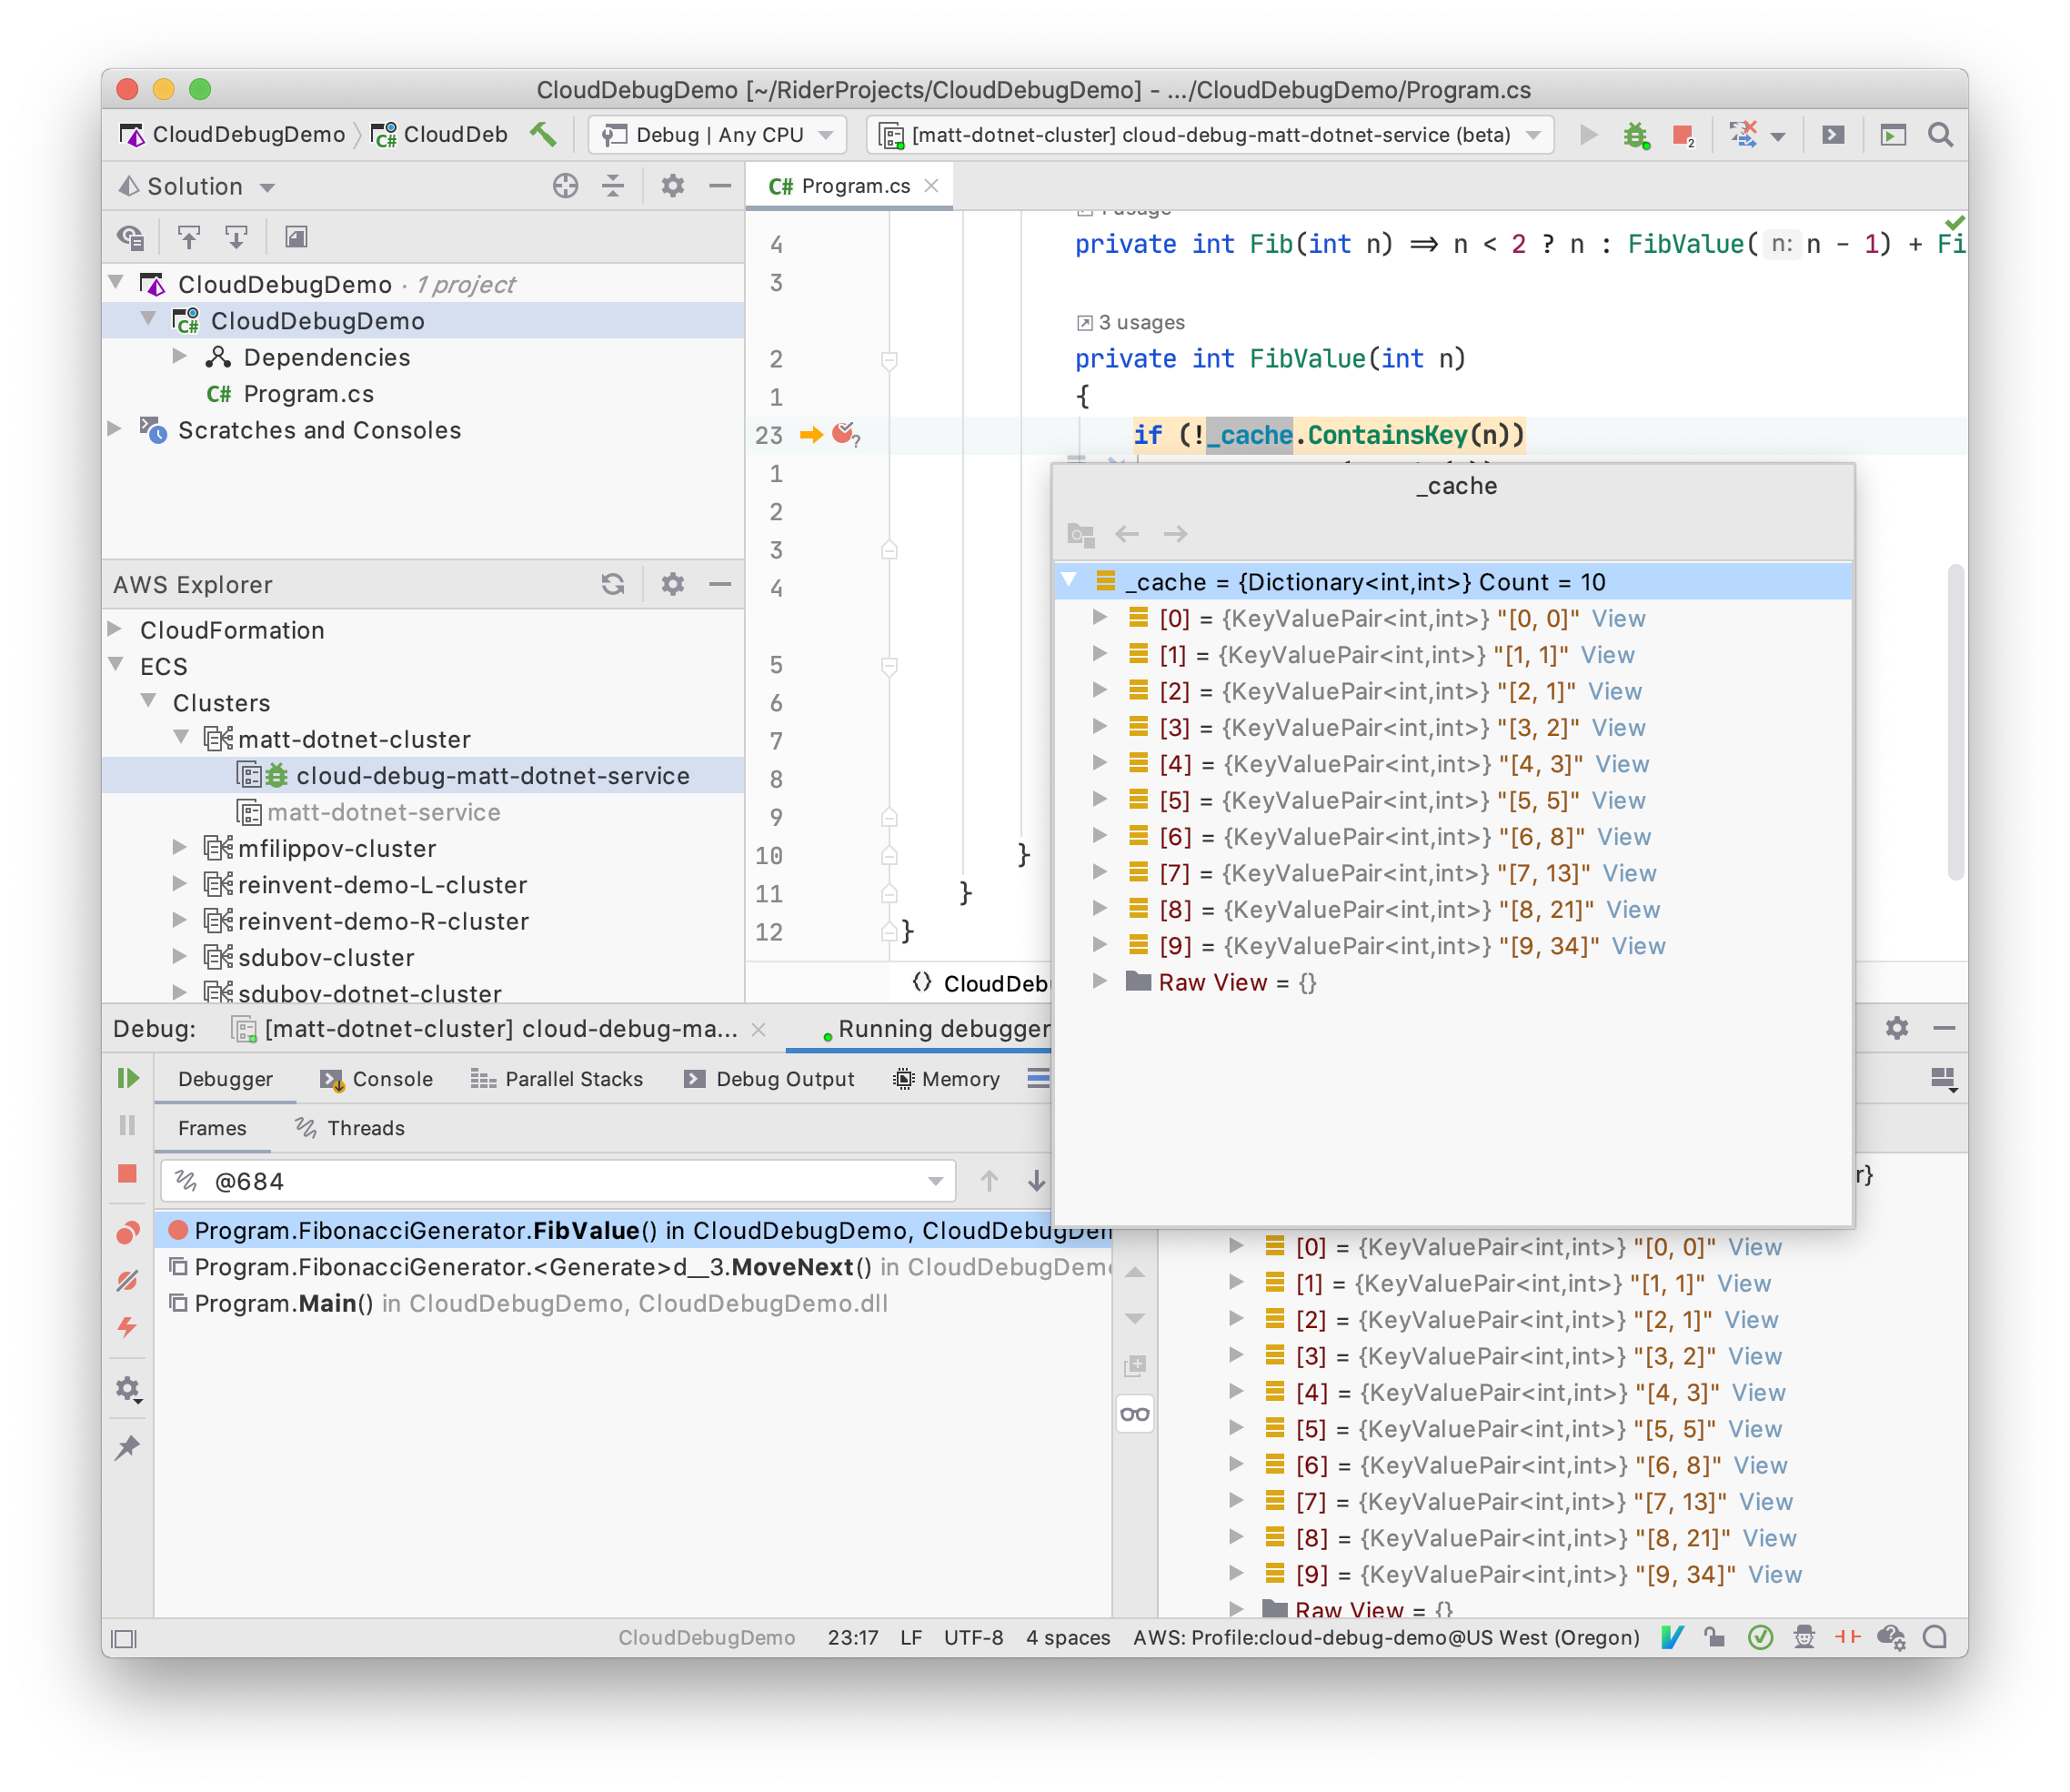
Once everything has finished uploading, the service is started and the debugger is attached. From this point on, you’re debugging your remote application just like you would a local application. All the expected features work, just like you’d expect – step in and out, smart step in, tooltip evaluation, breakpoints, including conditional and dependent breakpoints and also pin to top. Of course, because it’s debugging remotely on a Linux container, there are a few features that don’t work, such as on the fly debugging of decompiled code, and Edit and Continue.
When you’ve finished debugging your application, you can disable Cloud Debugging for your ECS service with a quick right click in the AWS Explorer. This will delete the debug service and restart the original service.
Remember that you’ve now just rolled back to the original version – any changes you made while debugging have been deleted. If you need to, commit your code and redeploy as normal.
That brings us to the end of our tour of the AWS Toolkit for Rider. You should now have the tools you need to create, debug and deploy AWS Lambda applications and remotely debug remote applications running in ECS. Please download the plugin and take it for a spin – search for “aws” in the Marketplace tab of the Plugins settings page. And let us know how you get on!


