.NET Tools
Essential productivity kit for .NET and game developers
dotTrace and dotMemory bring new home screen!

Longtime users of dotTrace and dotMemory may have noticed the brand new home screen that ships with version 2021.1. The change comes as part of our goal to make our products the best profiling tools on the market for all major desktop platforms (we’re using Avalonia to make this cross-platform UI a reality).
We redesigned the user interfaces to help developers jump right into a profiling session. Both products share some UI design elements that should help users transition seamlessly between the two profiling products. Not only do the UI’s look similar, but dotTrace and dotMemory will share the same run configurations, meaning we only need to set up a run configuration once.
Let’s see what each profiling product’s home screen offers, starting with dotTrace.
dotTrace Home Screen
The first thing dotTrace users will notice is the column-based layout, guiding the user to look naturally from left to right labeled from #1 to #3, not including the navigation on the left-hand side.

Starting in the first column, we’ll be able to create a new run configuration or use an existing run configuration from a previous profiling session. Clicking the plus (+) icon will immediately display the run configuration dialog screen.
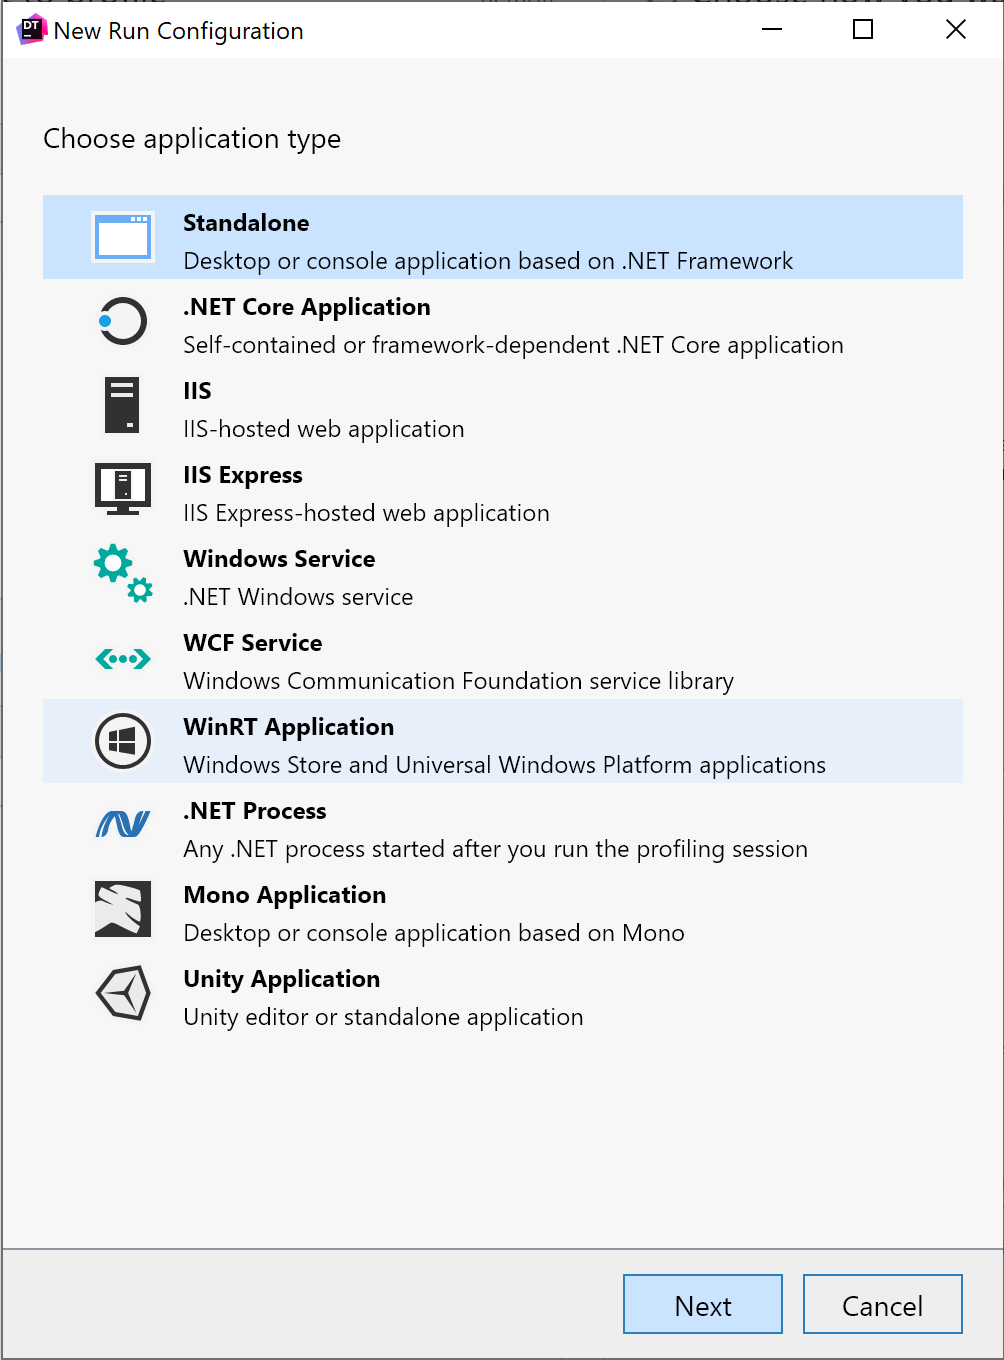
From this dialog, we can choose to profile several kinds of .NET applications:
- Standalone
- .NET Core Application
- IIS
- IIS Express
- Windows Service
- WCF Service
- WinRT Application
- .NET Process
- Mono Application
- Unity Application
Whichever platform we’re developing for, dotTrace can help us find and eliminate problems quickly and efficiently.
If our .NET process is already running, we can use the Running Processes section to find and begin our profiling session. We can use the plus (+) icon to turn a running process into a run configuration for future profiling sessions.
Column #2 displays all the types of profiling configurations we can choose for our target .NET process:
- Timeline
- Sampling
- Tracing
- Line-by-Line
Most users will start with Timeline or Sampling profiling as it has the most negligible impact on application performance while giving us a general idea of our application’s behavior.
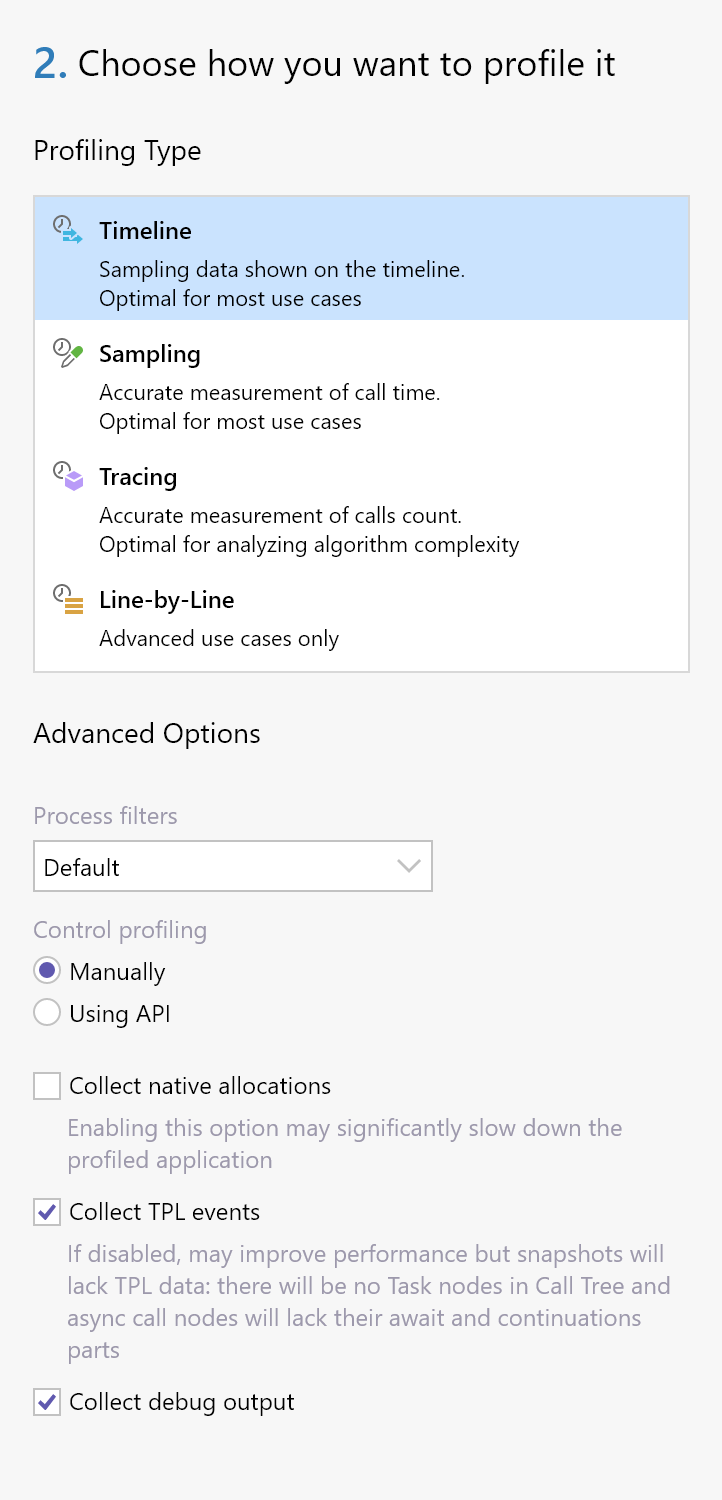
We can set process filters in the Advanced options to exclude any related processes from the profiling session, making sure the session doesn’t pollute our data set with unnecessary information. We may also toggle collection from native allocations, Task Parallel Library (TPL) events, and debug output.
Finally, once we’ve configured our profiling session just the way we like it, we can click the Start button found in column #3.
As we’ve seen, the new UI is intuitive and helpful in guiding the developer in configuring and starting a profiling session. As we’ll see with dotMemory, both UIs share the same layout and intuitive design.
dotMemory Home Screen
Let’s explore the redesign of dotMemory and what users will be using to profile their applications. When first starting dotMemory 2021.1, the UI will greet users with a four-column layout. We have the navigation menu, the process profiling selection column, the profiling filters column, and the start column from left to right. Each actionable column has a number from 1 to 3.

Starting at column #1, Choose the process you want to profile, we can create a new run process run or choose from a currently running process. To create a new process run, we can click any of the green plus icons, which will show the New Run Configuration dialog.
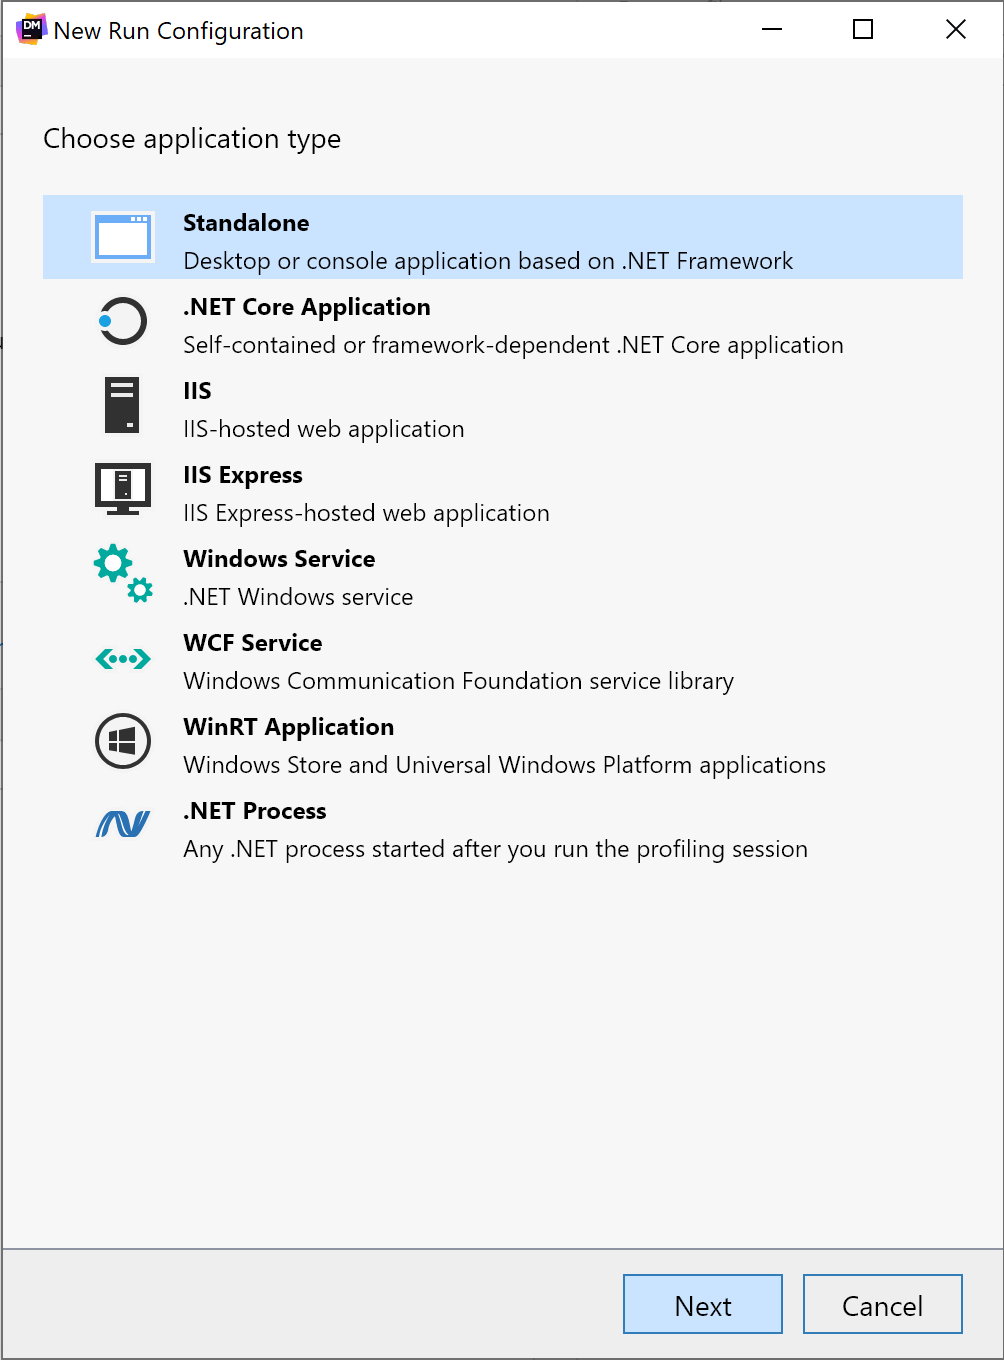
From the dialog, we can select from a menu of run profiles that best-suites our application:
- Standalone
- .NET Core Applications
- Internet Information Services (IIS) hosted web applications
- IIS Express Applications
- Windows Services
- WCF Services
- WinRT Applications
- .NET Process
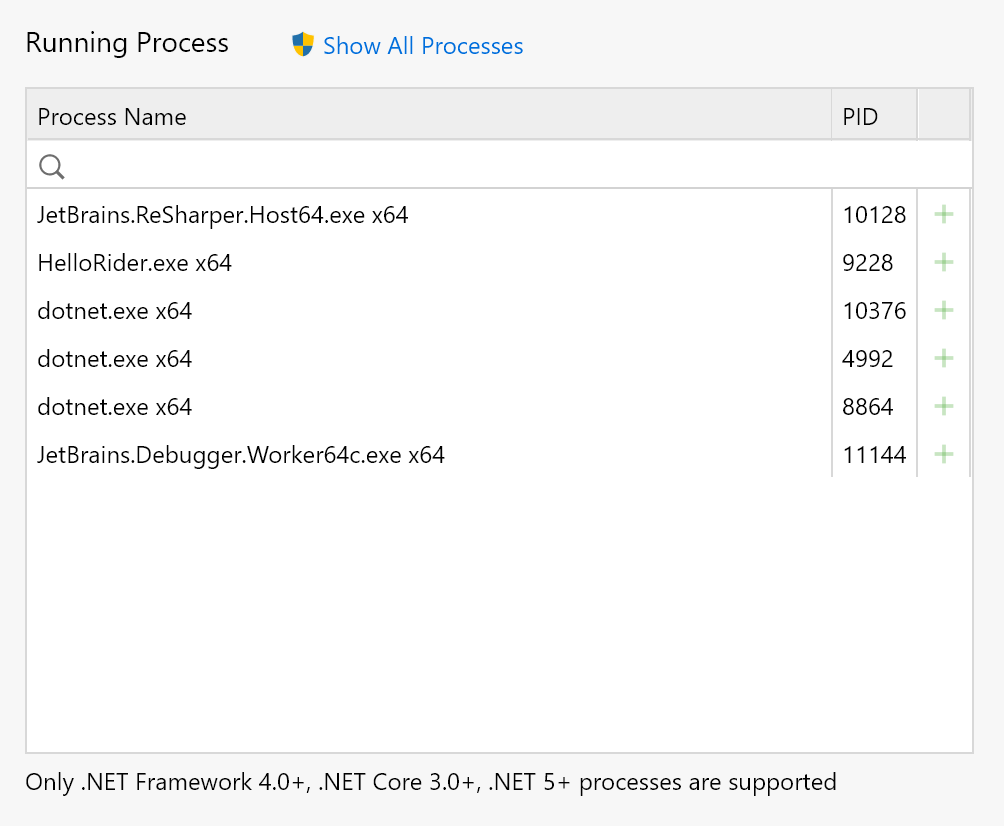
Staying in column #1, below the run configurations, is a selection of currently running processes. We can choose any of the listed processes to jump into a profiling session immediately.
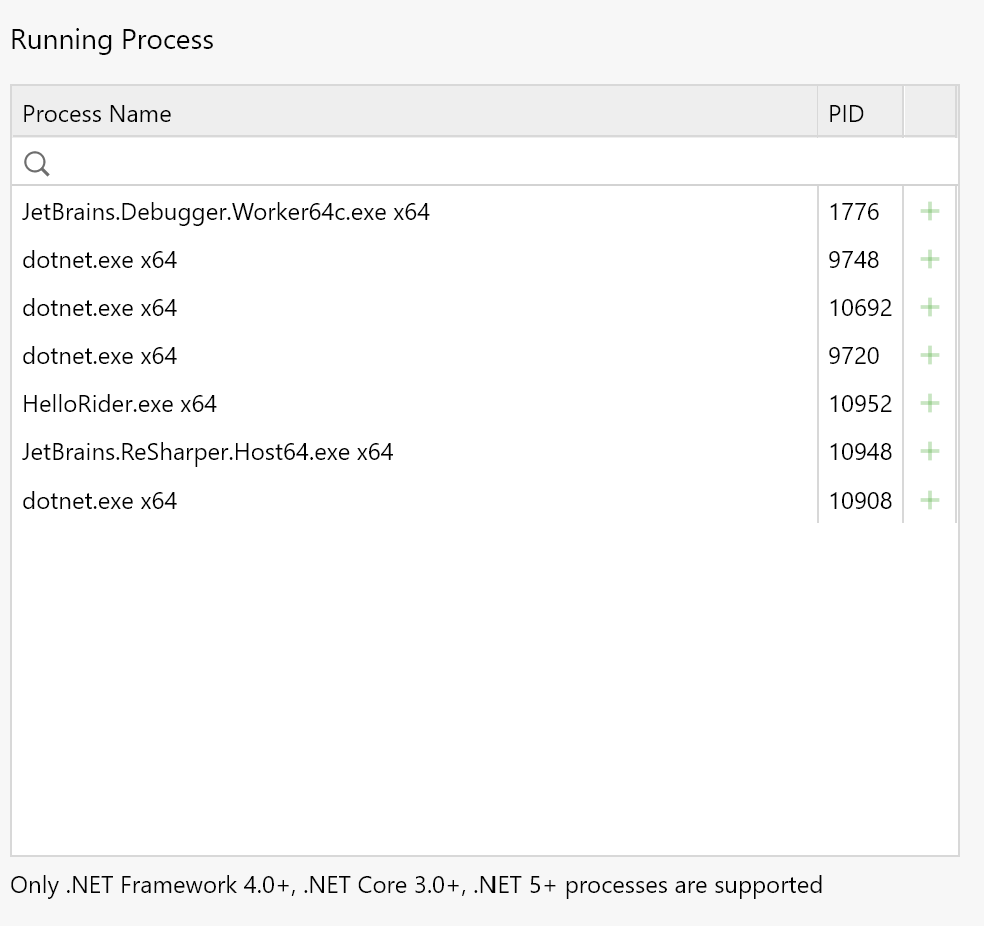
As stated below this process selection box, dotMemory supports only .NET Framework 4.0+, .NET Core 3.0+, and .NET 5+ processes.
Moving on to column #2, we can choose how we want to profile our .NET application. Most users should select Default, but we can also modify the processes filtered from the profiling session.
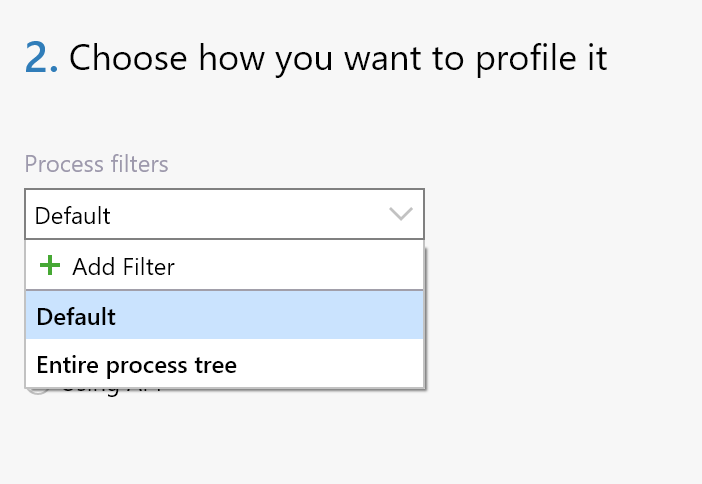
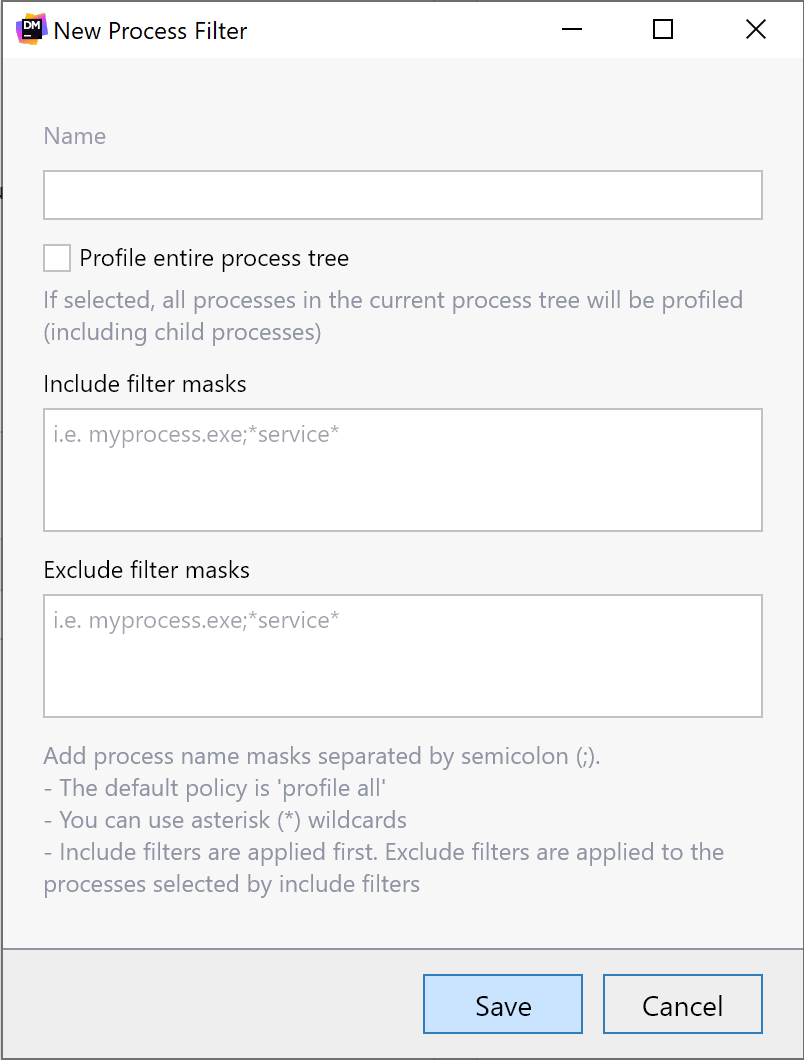
Choosing Add Filter from the selection, we’ll see a New Process Filter dialog. Here, we can choose our new profile’s name and add any filter masks for processes to include or exclude in our session. Filter masks are helpful for any applications that run across several processes.
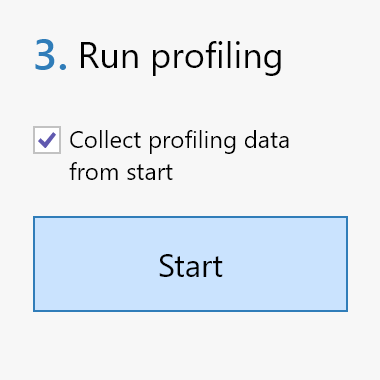
In the third column, we have Run Profiling options. We can choose to start collecting memory allocations and traffic as soon as our application starts or toggle that feature off.
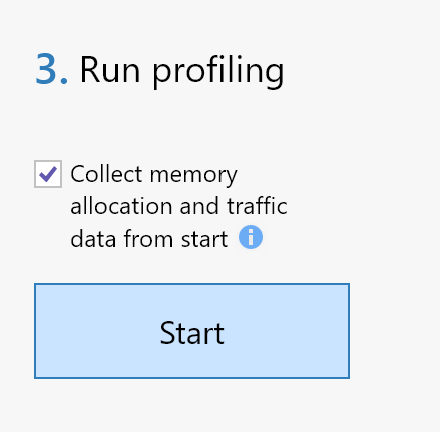
Collecting early memory allocations might help our memory issues start immediately, but collecting allocations can also impact our applications’ performance. There’s no need to worry about the choice since collecting allocations can be toggled on or off during the profiling session.
Conclusion
While not shown in this post, the stand-alone UI for dotCover 2021.1 has also received the same familiar UI treatment.
That about sums up the new home screens for our profiling tools. We hope the change is an indicator of things to come, not only for Windows users but all desktop users interested in profiling their applications.
Let us know what you think of the new user interfaces by downloading the latest versions of dotTrace 2021.1 and dotMemory 2021.1.