.NET Tools
Essential productivity kit for .NET and game developers
Getting Started With dotTrace On macOS And Linux

With the ReSharper tools 2023.1 Early Access Program (EAP) 5 release, we also made the standalone version of the dotTrace performance profiler available on macOS and Linux – for both x64 and ARM64 processors. You can now use dotTrace as a standalone tool to profile your .NET Core, Mono and Unity applications on all three major operating systems.
In this blog post, let’s look at how you can get started with dotTrace on macOS. Note that for Windows and Linux, the workflow will be similar.
Download dotTrace for your platform
To download dotTrace standalone, you can use the JetBrains Toolbox App. it provides convenient access to all of the JetBrains tools, and lets you install stable and early access versions side by side.
Alternatively, download the build for your OS by clicking on the appropriate link:
- dotTrace for macOS x64
- dotTrace for macOS ARM64
- dotTrace for Linux x64
- dotTrace for Linux ARM64
- dotTrace for Windows x64
- dotTrace for Windows ARM64
Choose what you want to profile, and how
After starting dotTrace, you will be greeted by the Home screen. Here, you will choose what to profile, and how to profile it. In addition, the home screen gives you access to earlier profiler snapshots, tutorials, and more. You can let dotTrace launch your application, or profile an already running process.
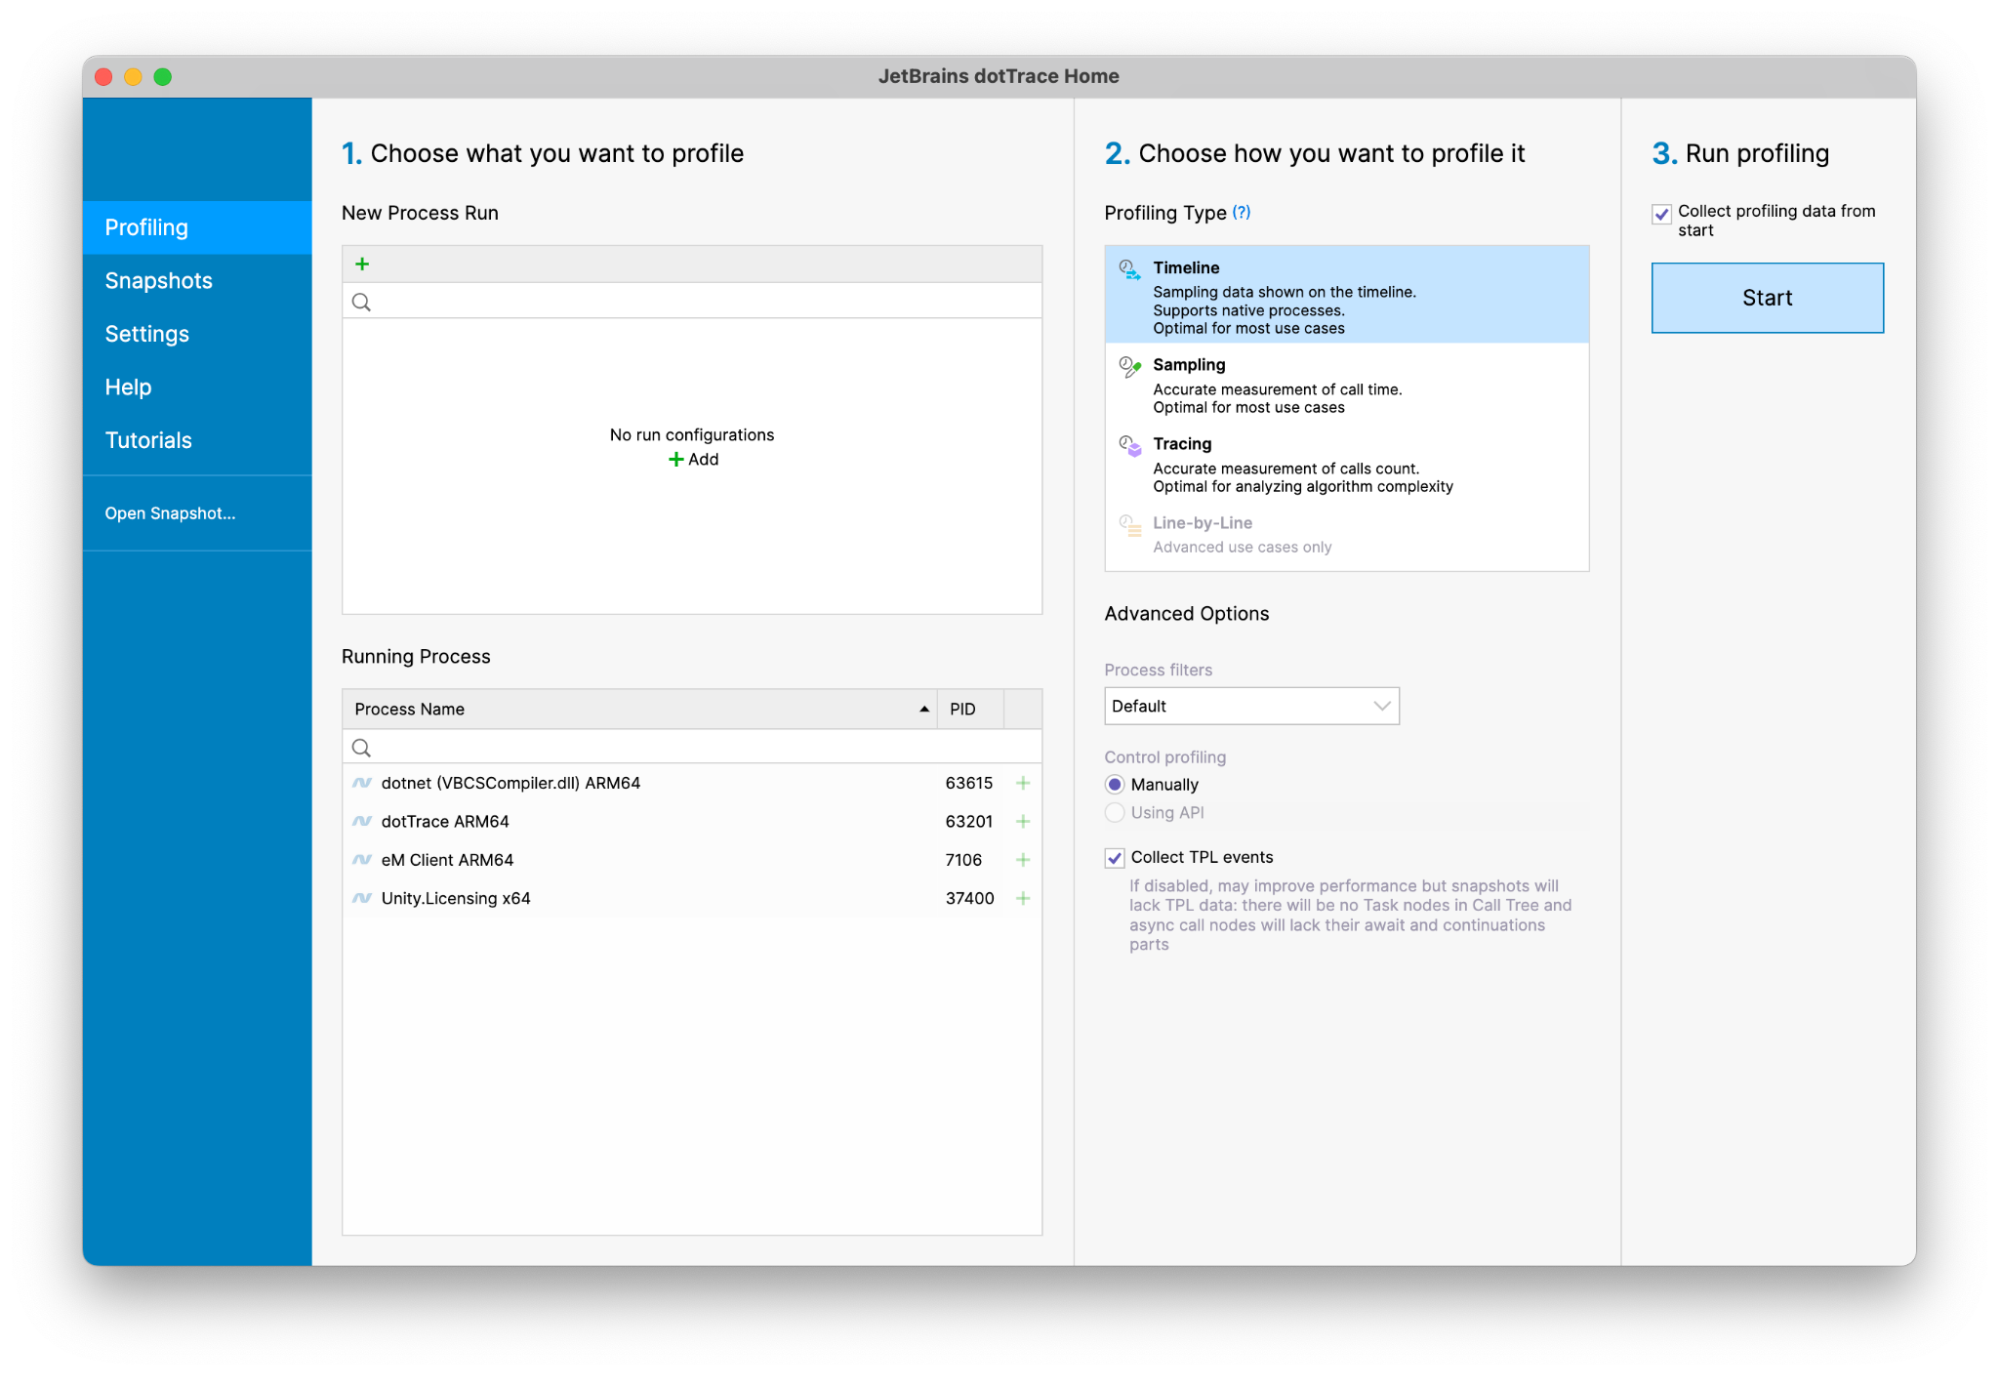
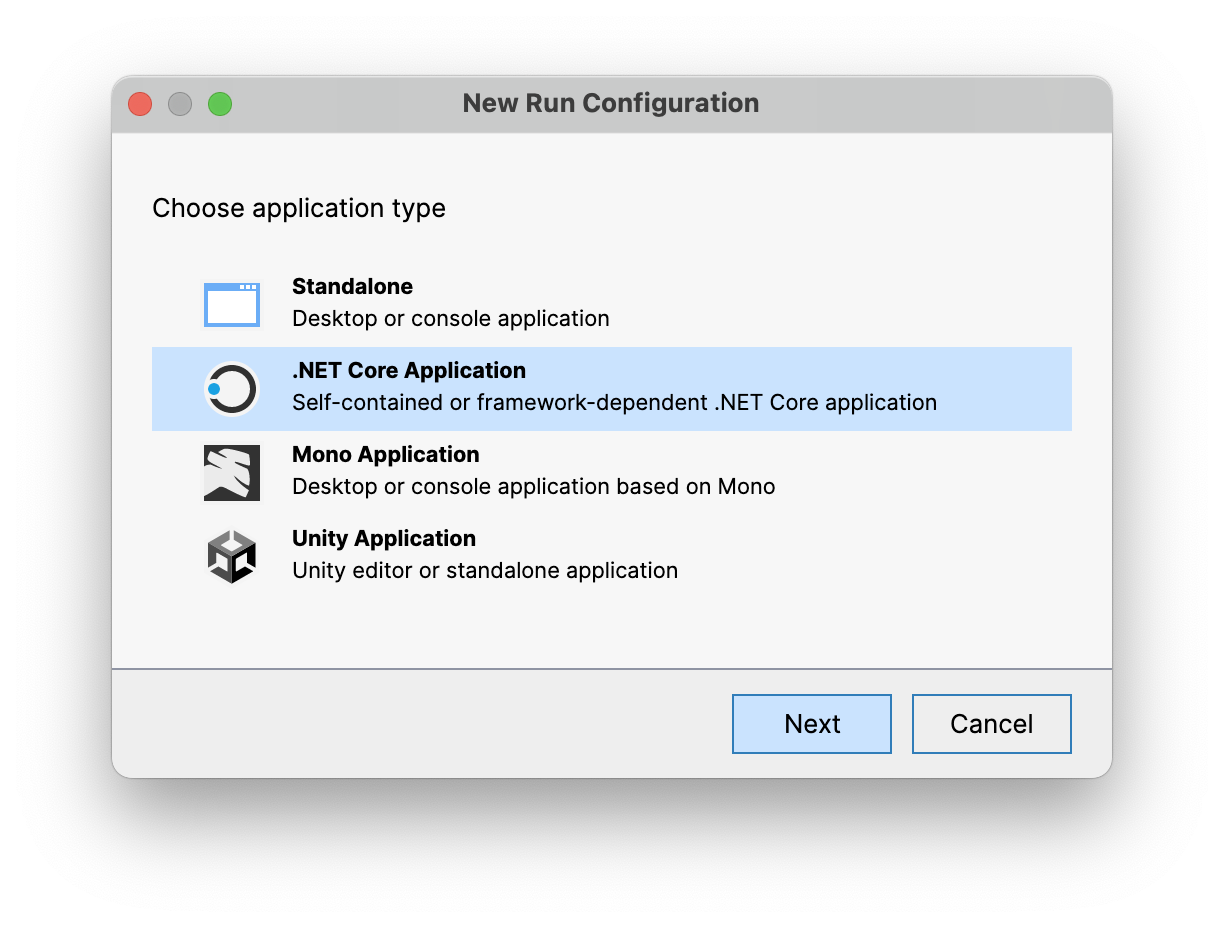
On the left-hand side of the Home screen, start by adding a run configuration. dotTrace on macOS and Linux lets you select a standalone desktop or console application to profile, as well as a .NET Core, Mono or Unity application. On Windows, you’ll be able to select several other application types, including IIS-hosted applications and Windows Services.
When profiling your own applications, don’t use Debug mode to build them. Ideally, use Release mode. The compiler optimizes call paths for you when your application is built in Release mode. It generally improves performance of your application by inlining methods and other techniques, and will give you more relevant results closer to the application you may be running in production.
After selecting the application type and finding the executable to profile, you’ll be able to select the profiling mode.
There are several other profiling modes you can select from: Timeline, Sampling, Tracing, and on Windows, Line-by-Line. Here’s a quick summary of what each mode does supports:
- Timeline and Sampling collect information about method execution times in your application. Timeline collects additional data about application events, distributed over time. This makes it easier to investigate UI freezes, garbage collection issues, thread starvation and so on. Generally, Timeline and Sampling have few overhead to your running application.
- Tracing and Line-by-Line collect information about the number of times a method in your application is called. Tracing does this at the method level, Line-by-Line (on Windows only) tracks call numbers at the statement level. Tracing and Line-by-Line will give you accurate call numbers, but due to the overhead they add, they are unreliable to measure call times.
Generally, your profiling workflow will start with Timeline profiling.
dotTrace lets you pick several other options as well, such as whether you want to profile child processes of your application, make use of the profiling API in your application to control when to capture snapshots from code, and more.
All set! You can now click Start, which will launch the profiler and the application you want to profile.
Controlling profiler snapshots
After you start dotTrace to profile an application, a profiler controller will be shown. The controller lets you start profiling, and decide when to capture a snapshot that you can investigate. You can see the CPU and memory usage of your application in a chart, which may be useful to identify a CPU spike after which you want to capture a snapshot.
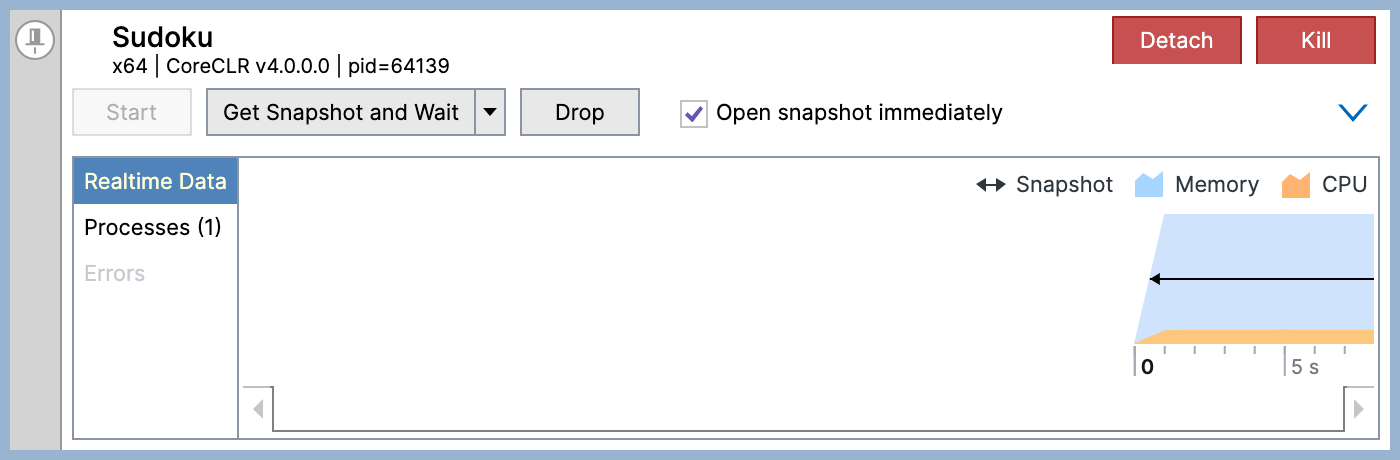
When you’ve captured enough data, click Get Snapshot and Wait to save the snapshot and open it in the dotTrace viewer.
Analyzing a snapshot
The dotTrace viewer shows you information about what happened during your profiling session. On the left-hand side, you’ll see all types of events you can filter on. Center stage is the timeline of your profiling session, where you can zoom in on specific times. The right-hand side of the viewer shows you hotspots in code where a lot of time is spent, and a call tree of all methods.
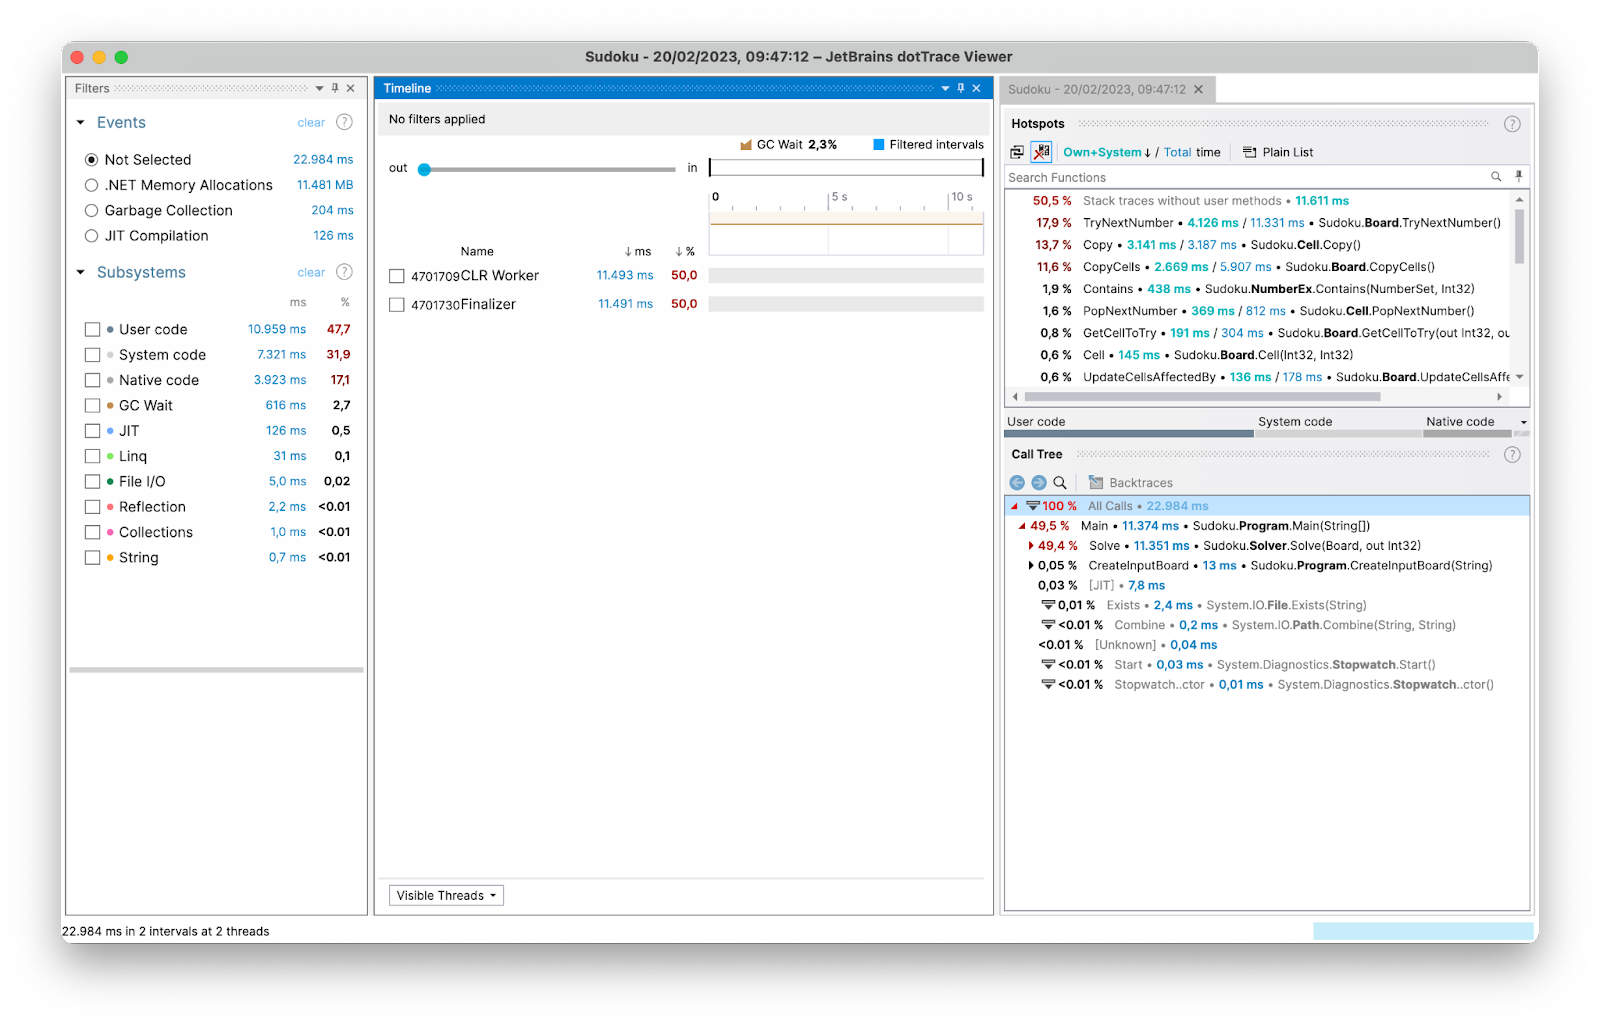
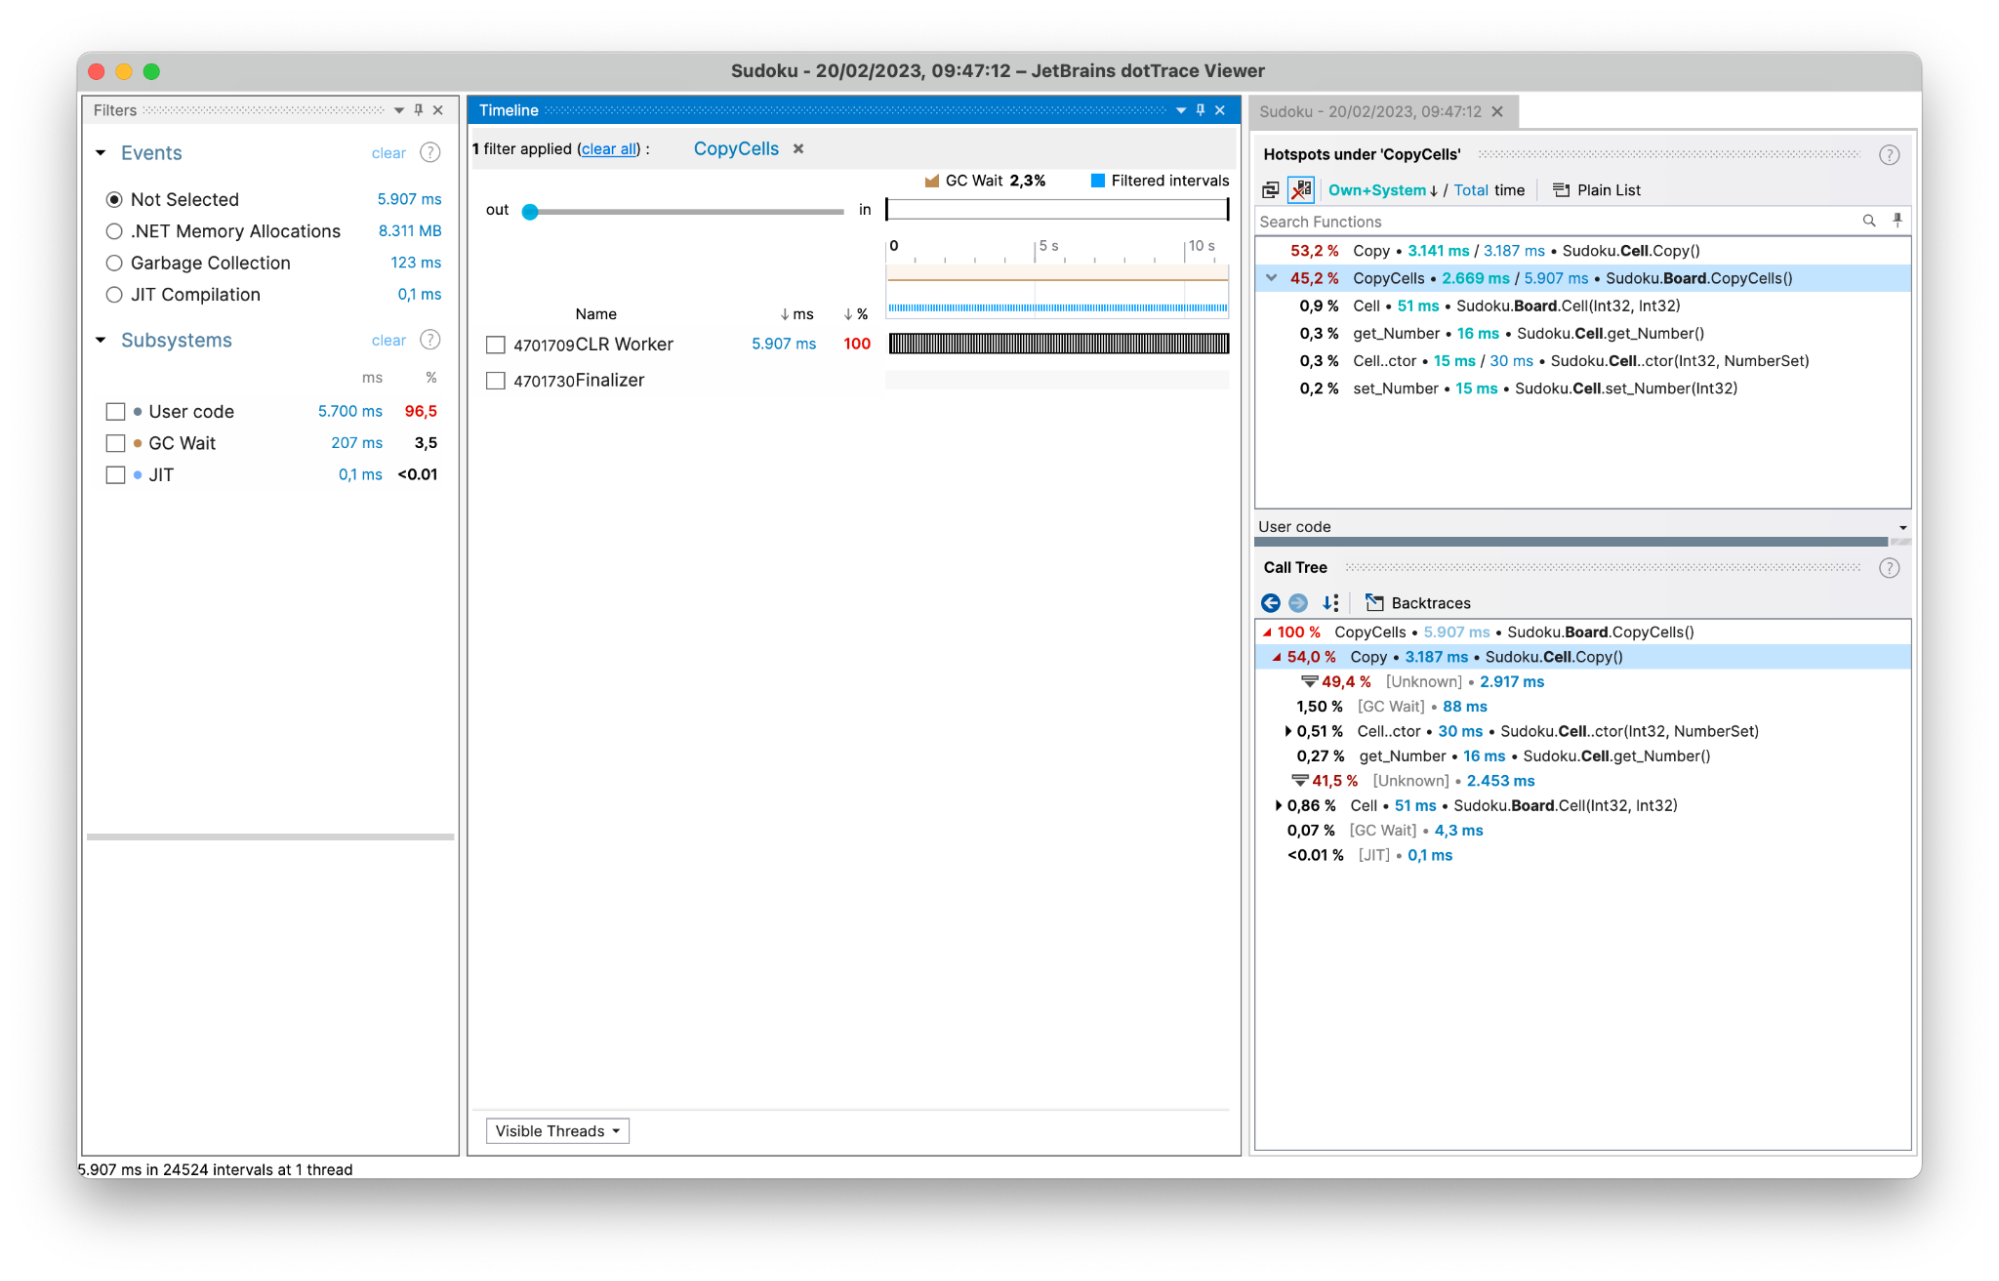
Everything in the dotTrace viewer is a filter. If you zoom in on a period of time, all views will update to show data relevant to that time slice. If you select a specific method call to analyze, you will see the timeline highlights when that method is called, and events will be limited to events that occurred during that time frame.
Check out the dotTrace documentation to learn more about analyzing .NET profiler snapshots.
Summary
The ReSharper tools 2023.1 EAP 5 release added support for the standalone version of the dotTrace performance profiler on macOS and Linux – for both x64 and ARM64 processors. The profiling workflow is the same as on Windows: select the application to profile, pick a profiling mode, and capture and analyze a snapshot.
If you need to profile applications on a remote machine, you can use the dotTrace command-line profiler to capture a snapshot, and use the dotTrace viewer on your machine to analyze it, no matter if you are running Windows, macOS or Linux. And of course, you can profile your applications from within Visual Studio and directly from Rider as well.
Give the dotTrace Early Access Program (EAP) release on macOS or Linux a try, and let us know how it goes!