.NET Tools
Essential productivity kit for .NET and game developers
AI Assistant Comes to ReSharper

We’ve reached a huge milestone! ReSharper 2023.2 will be the first version of the product to contain AI-powered development assistance. This EAP build introduces an early implementation of the ReSharper AI assistant – an AI-driven chat specifically designed to answer programming questions and help you with troubleshooting, refactoring, documenting and other development workflows.
Accessing the AI Assistant
There are several ways you can call on the help of the AI Assistant inside ReSharper:
- By going to the main menu: ReSharper | AI Assistant.
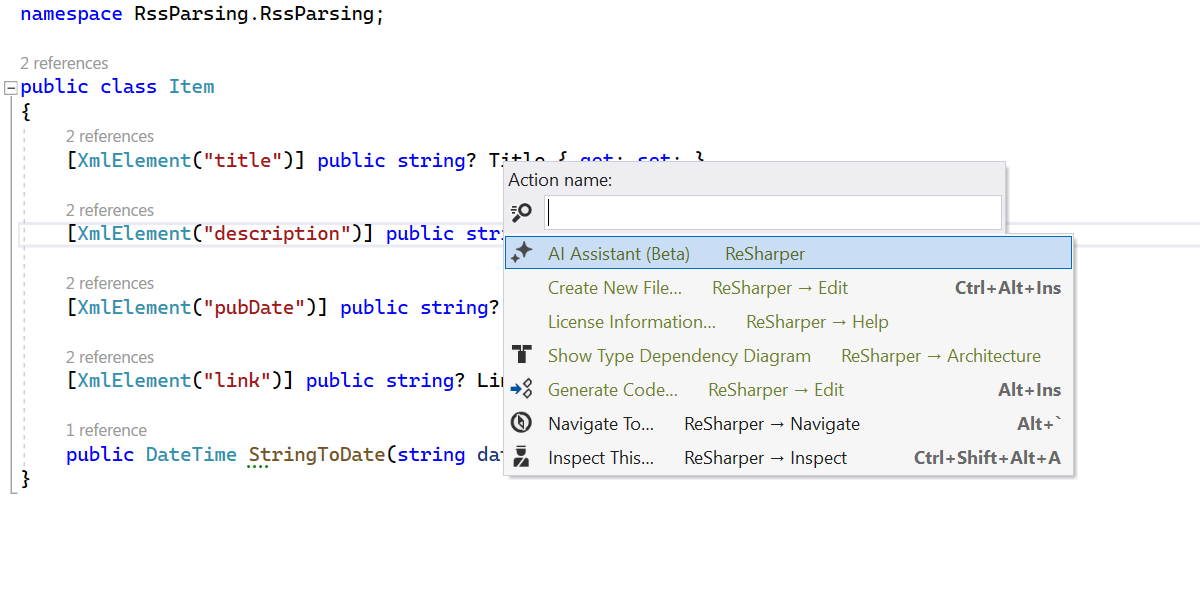
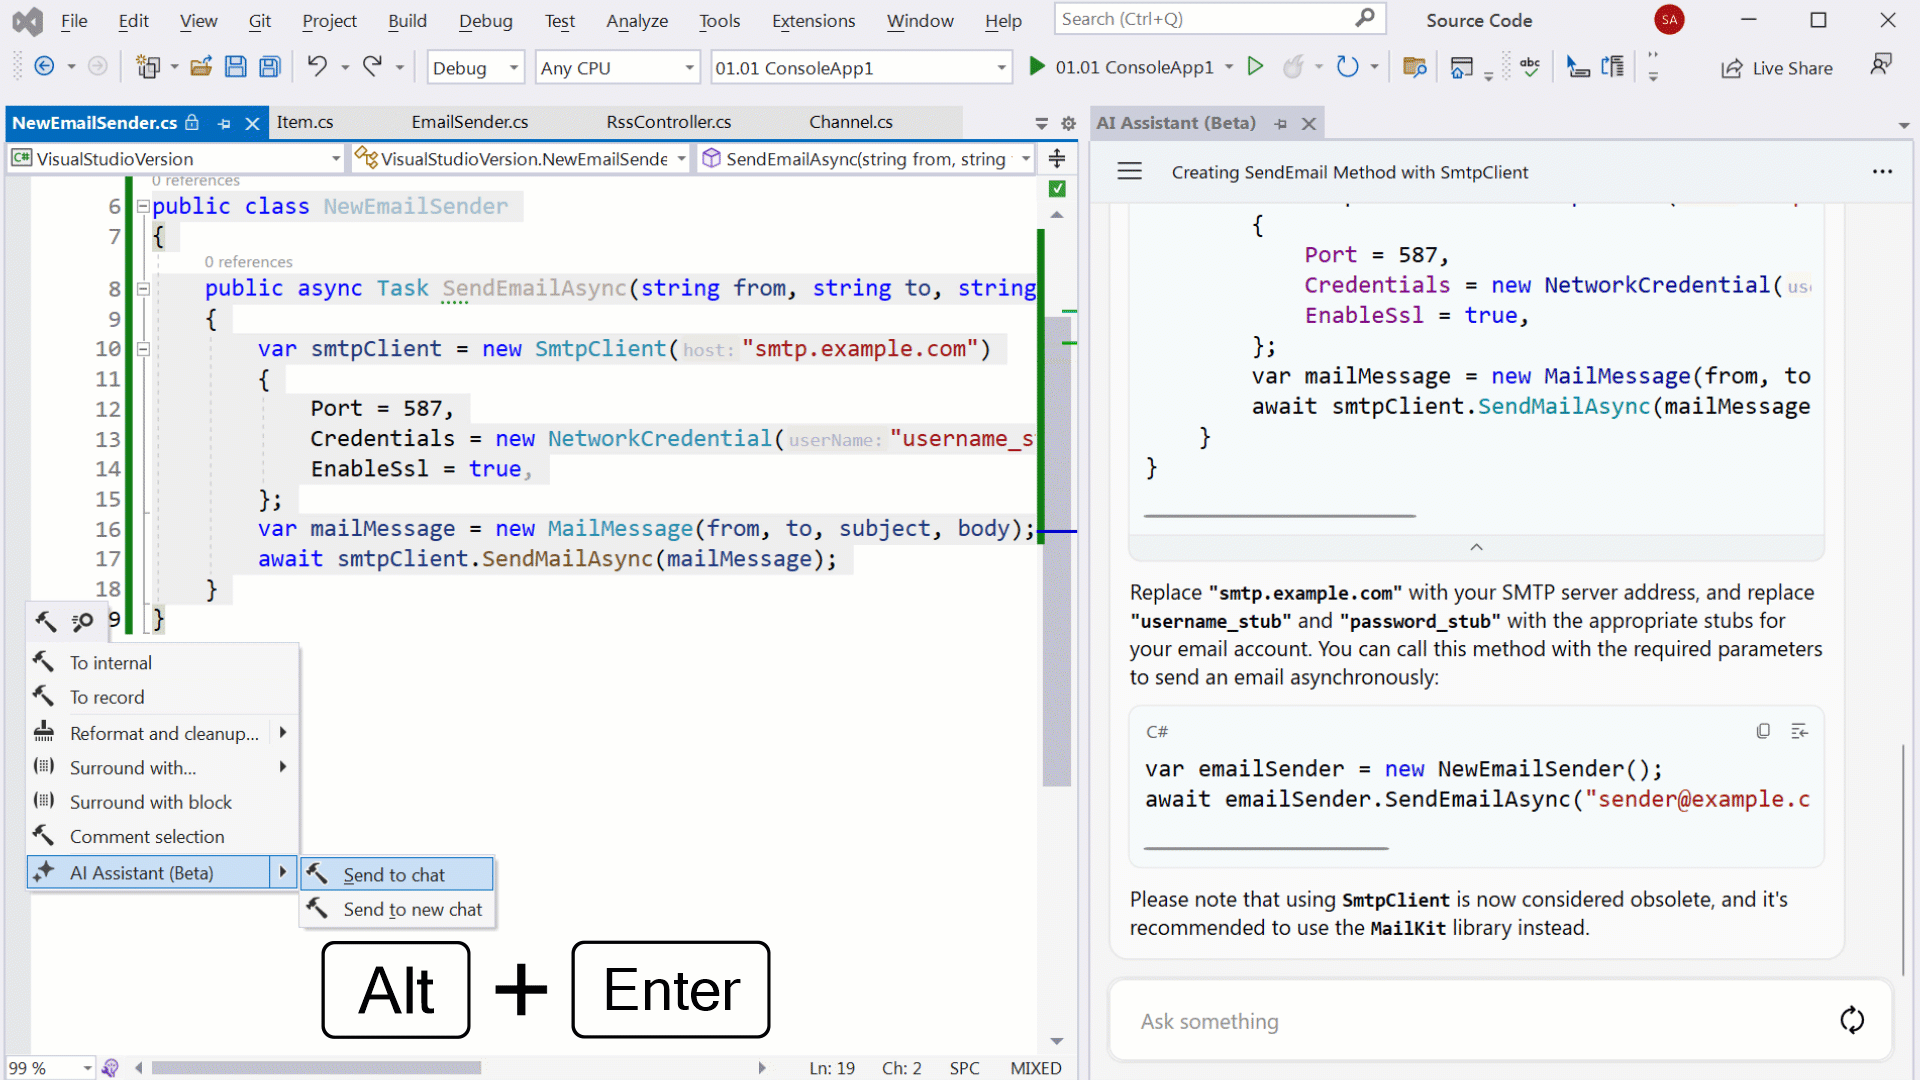
- By using the context menu inside the Editor window.
- By pressing
Alt + Enterand searching for AI Assistant.
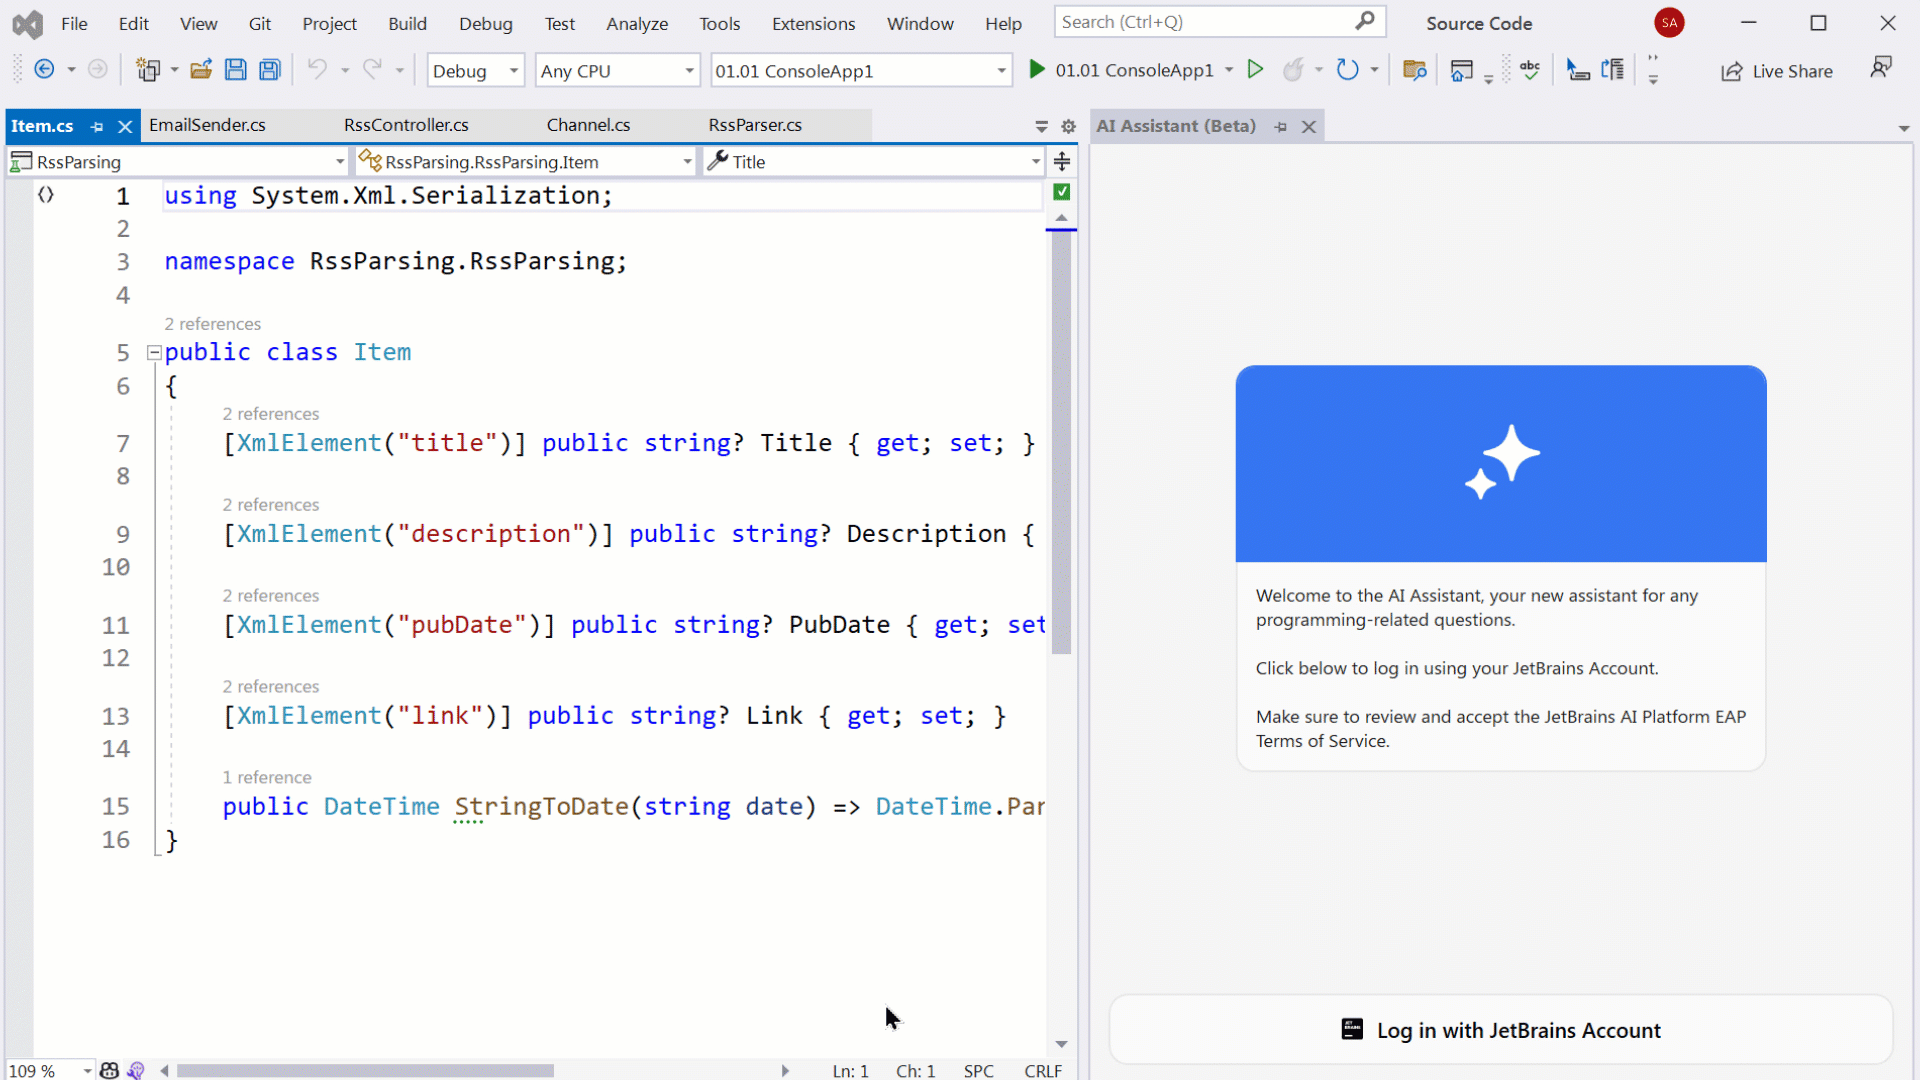
The first time you launch the AI Assistant, you will be prompted to log in to the JetBrains AI service with your JetBrains account. Please note that the JetBrains AI service may not be available for everyone immediately. At first, we will limit the number of users who are able to log in, and when this limit is reached, any additional users who attempt to log in will be added to a waiting list. We will gradually invite more people to try the product in the coming weeks.
Access to the AI service is currently restricted to the territories where the OpenAI service is available. You can check the full list of territories here.
The AI service is free to use during the EAP cycle. We’ll be providing the licensing and pricing model at a later date.
Interacting with the chat
Once logged in, you can start asking the AI your programming questions. We’ve prepared some sample prompts for you to get a feel for how the chat works.
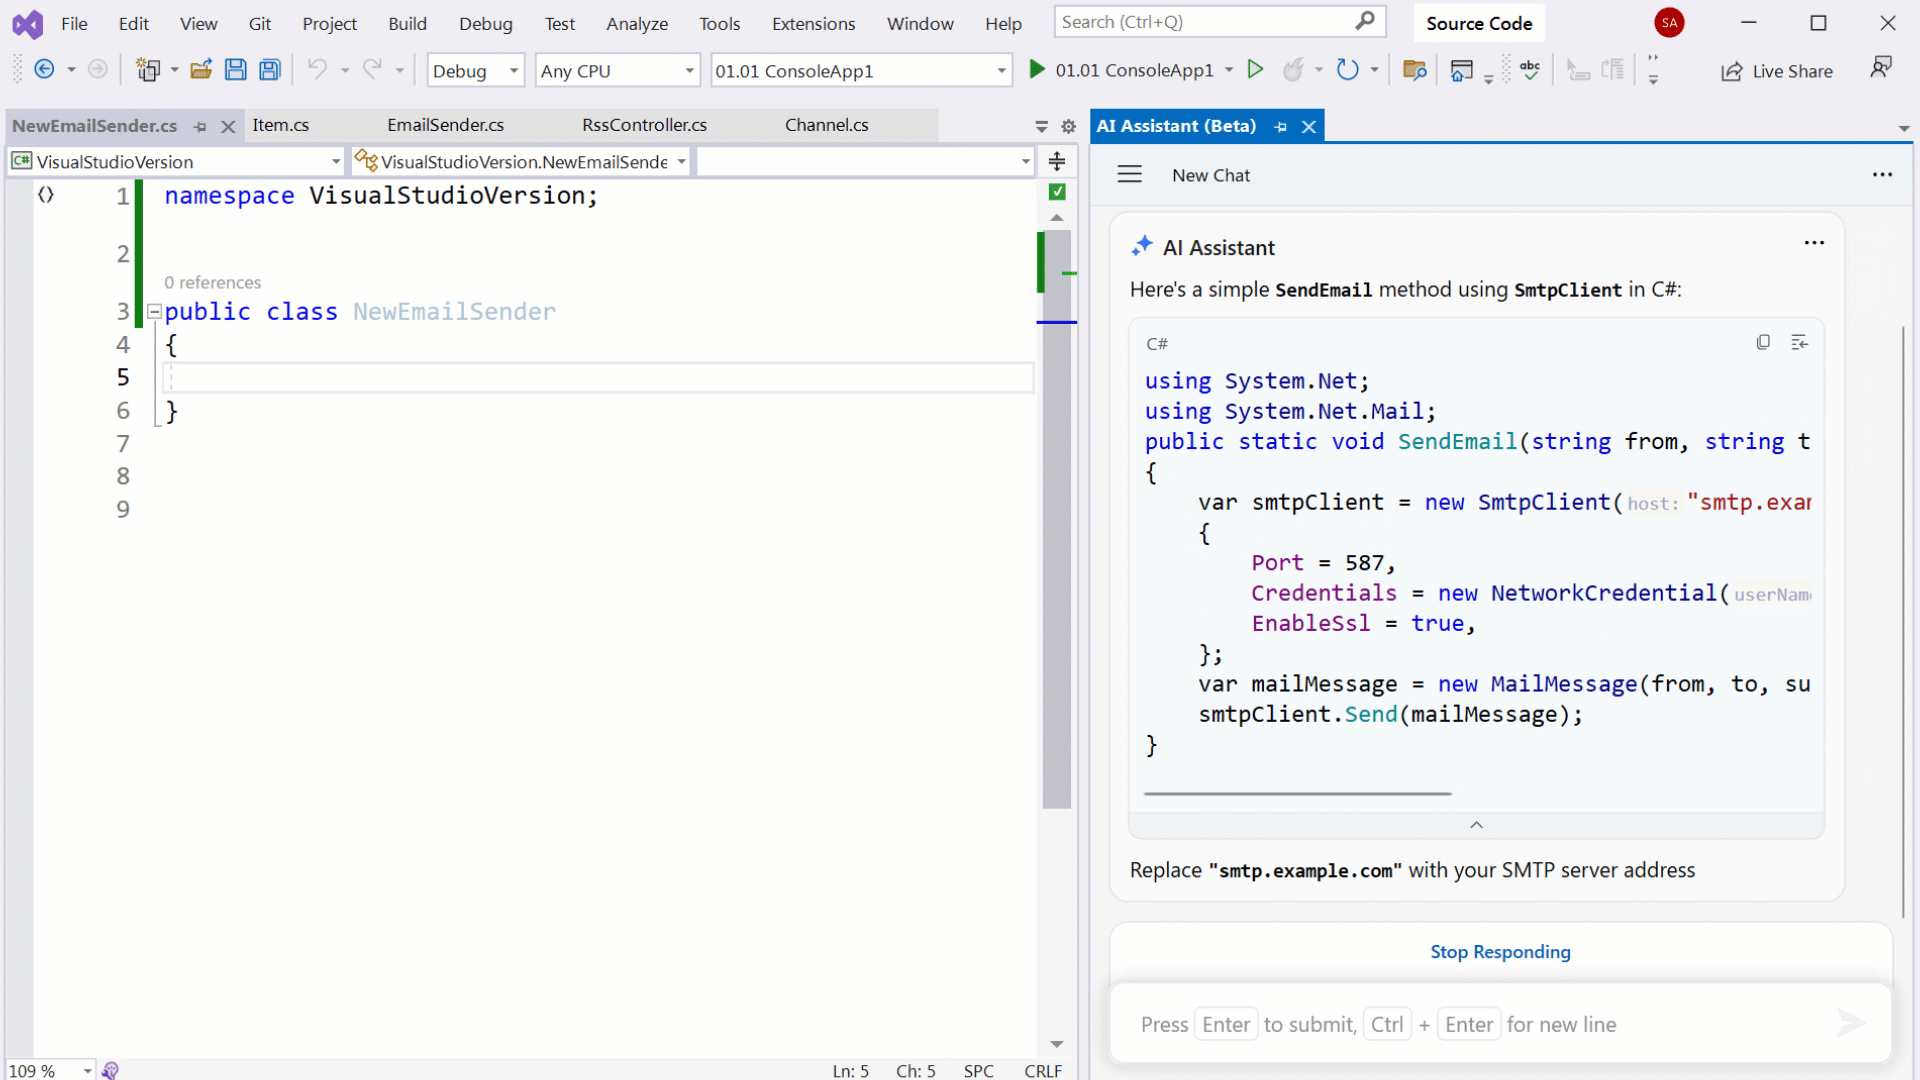
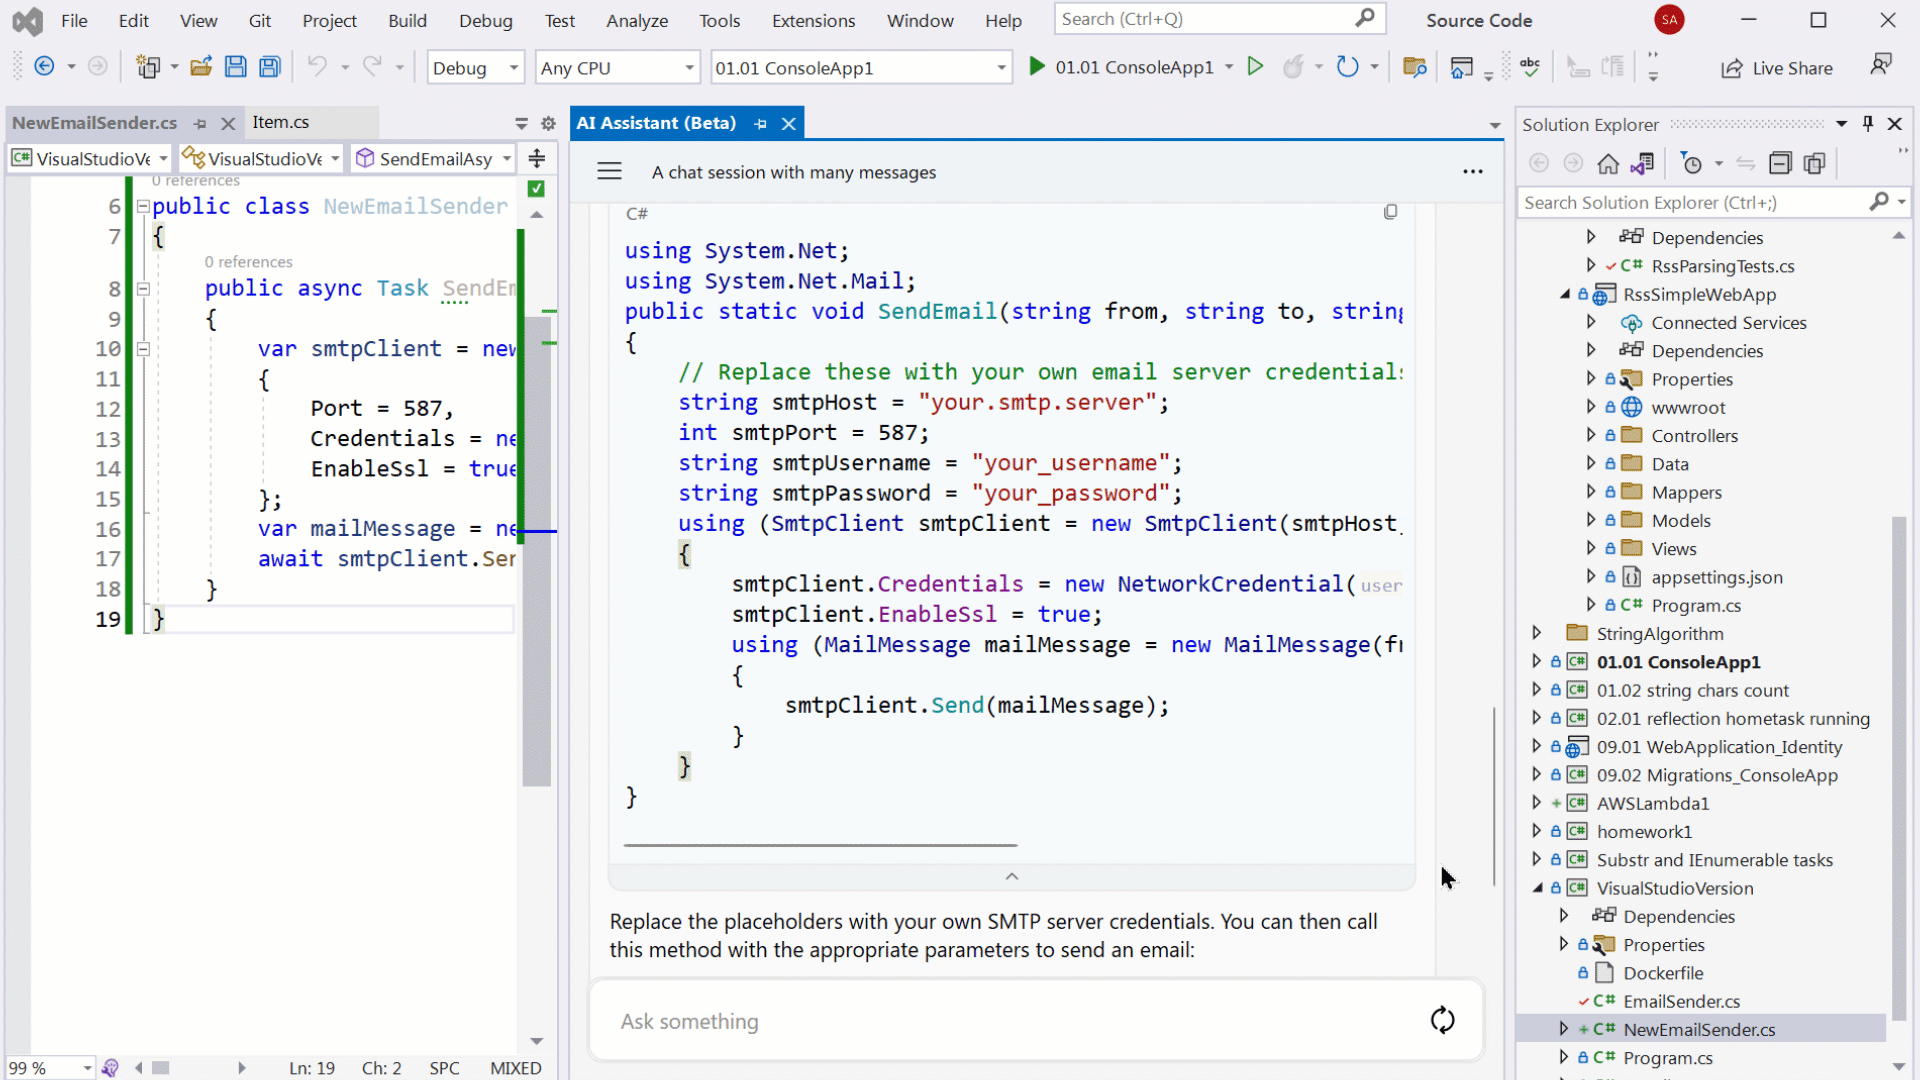
ReSharper’s AI Assistant takes into consideration the language and technologies used in your project. This context-awareness tailors its responses right out of the gate, saving you time and effort.
When the AI shares code with you, the code snippets are properly formatted.
The snippets are easy to manage – you can either copy and paste them to the editor yourself or let the chat insert the provided snippet where your caret is currently placed.
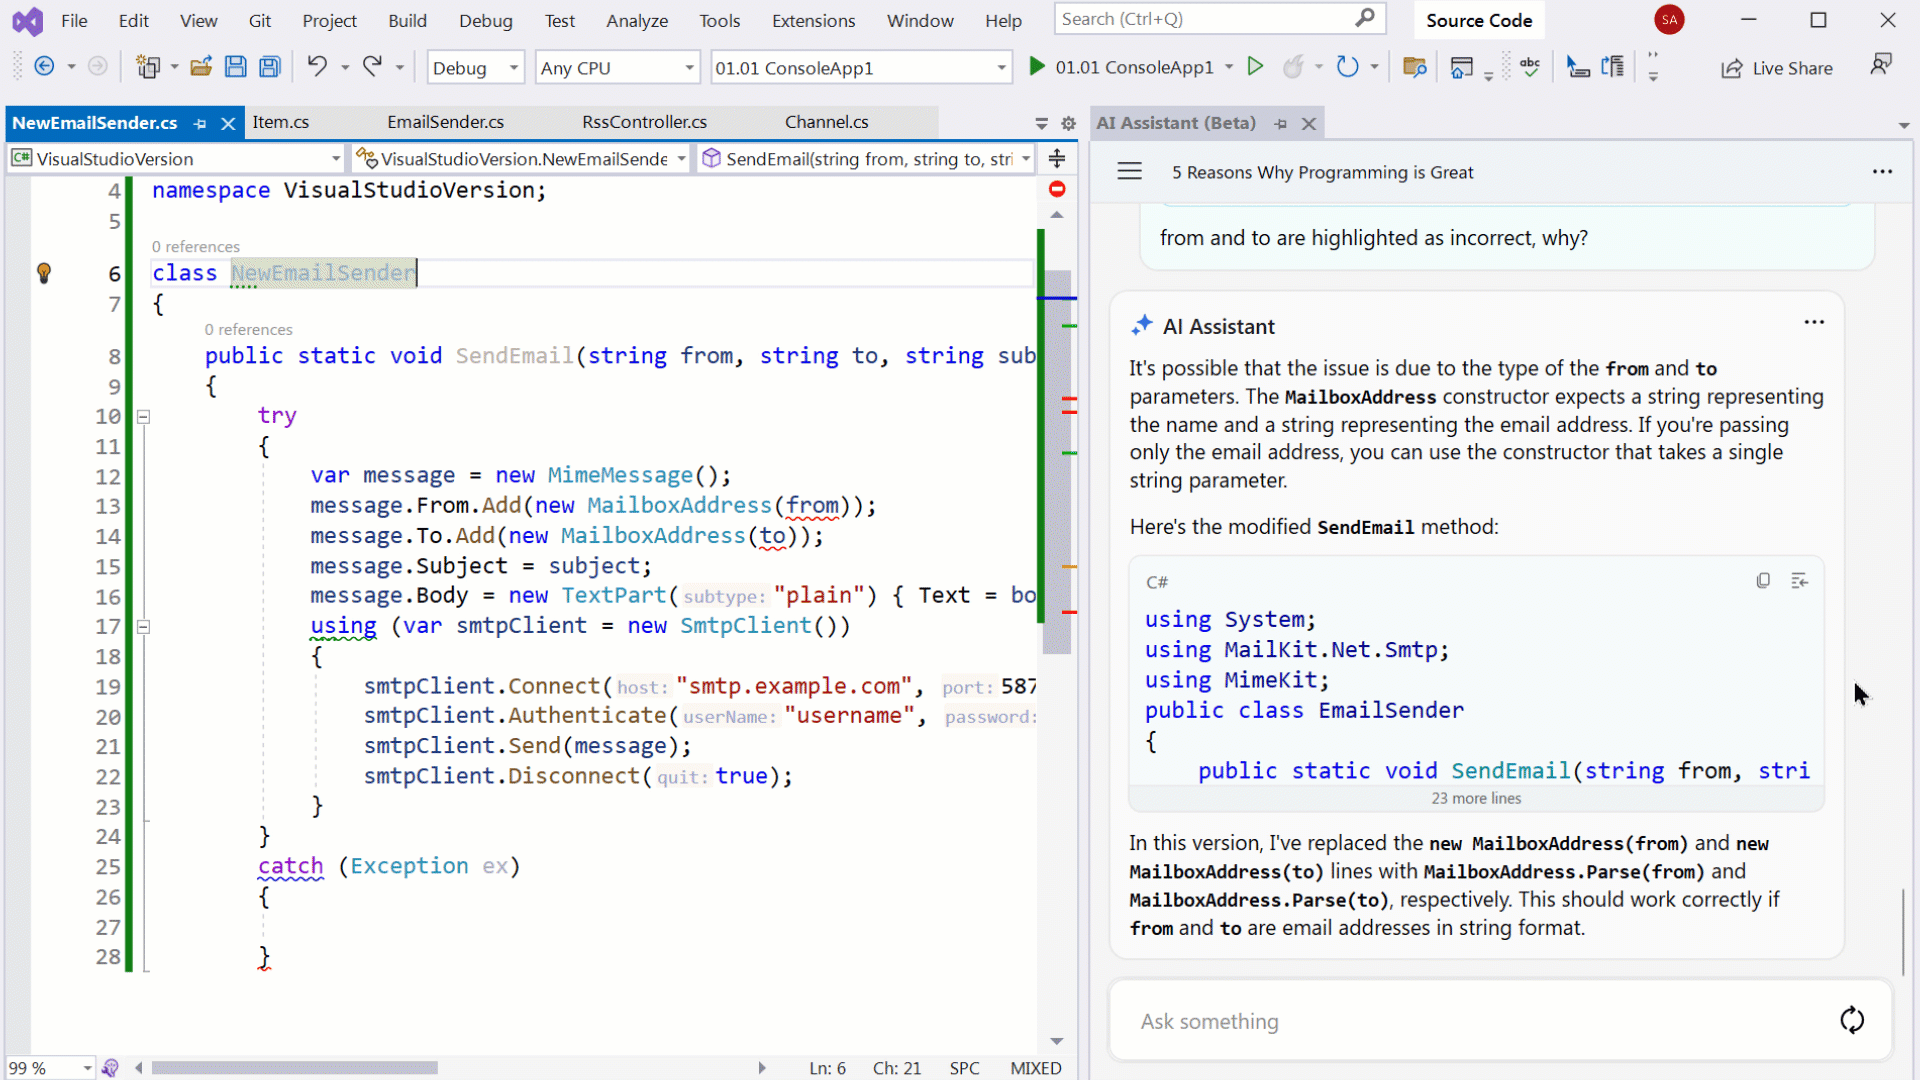
Feel free to include parts of the source code in your queries. ReSharper will detect the code you pasted into the chat and will properly format it, while the AI model will help you refactor, explain, or document it.
Using the AI features requires us to send your requests and source code to the LLM provider. For more information on our data collection policies, please refer to the AI Assistant in JetBrains IDEs blog post.
Tips
Here are some tips for organizing your chats with the AI Assistant inside ReSharper.
Re-prompting
If you feel like your original question to the AI might benefit from more precise wording or additional information, you can edit it instead of retyping the entire question. Click on the “…” symbol next to the message to edit the initial prompt. This will automatically start a new chat session with the AI Assistant, while the original message history will be preserved unchanged in the archive in case you need to refer to it later.
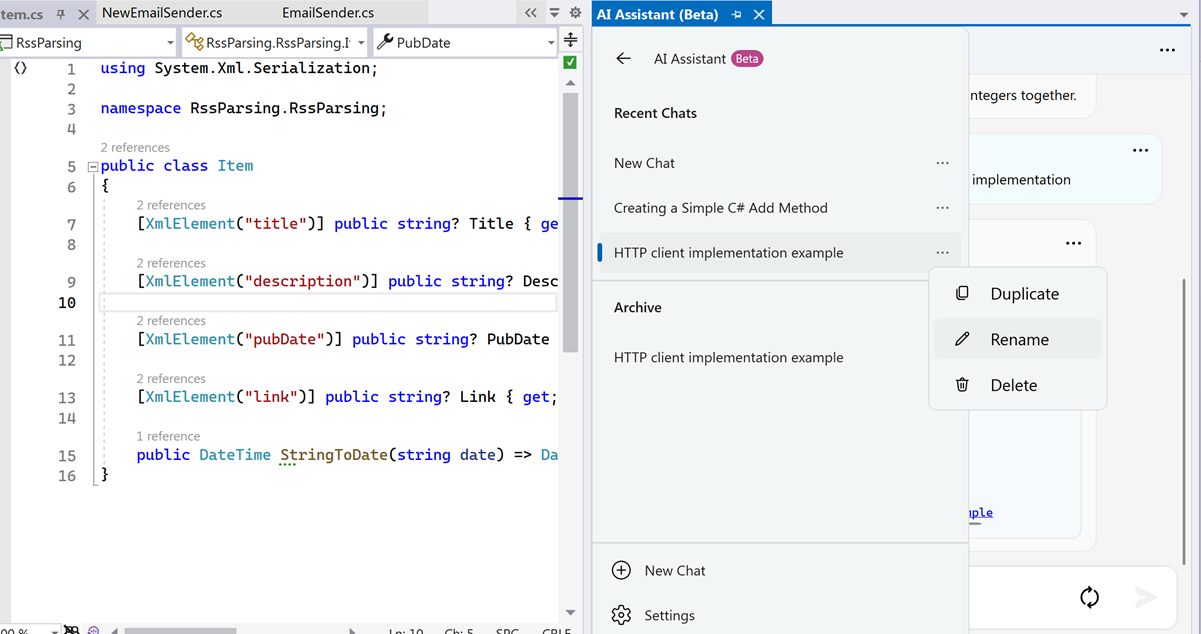
Managing chats
You can easily create, duplicate, delete, and rename chat sessions with the Assistant using the sidebar where all of your chats are stored. If you don’t use a custom name for the chat, one will be generated automatically.
We have many exciting enhancements planned for the ReSharper AI Assistant that will be announced in the weeks leading up to the next major version release. In the meantime, leave your feedback and suggestions in the comments below or on our issue tracker, and keep an eye out for updates.
We also recommend checking out this post about the AI Assistant in ReSharper C++.
And now, on to other exciting updates this EAP build brings.
С# updates
Inspections and quick-fixes for discard handling
EAP 1 brought new inlay hints for tuples, discards, and deconstruction components in deconstruction patterns. Building on that, we’re bringing out new inspections for resolving conflicts between discards and a variable named "_".
The first type of inspections we’re introducing are meant to highlight parts of code that look like discards, but aren’t. You‘ll be offered two quick-fixes for such cases. Make it discard will either turn the entity into a true discard when the context allows, or rewrite the expression to effectively function as a discard. Rename ‘_’ will rename the entity declared as “_” to eliminate the ambiguity.
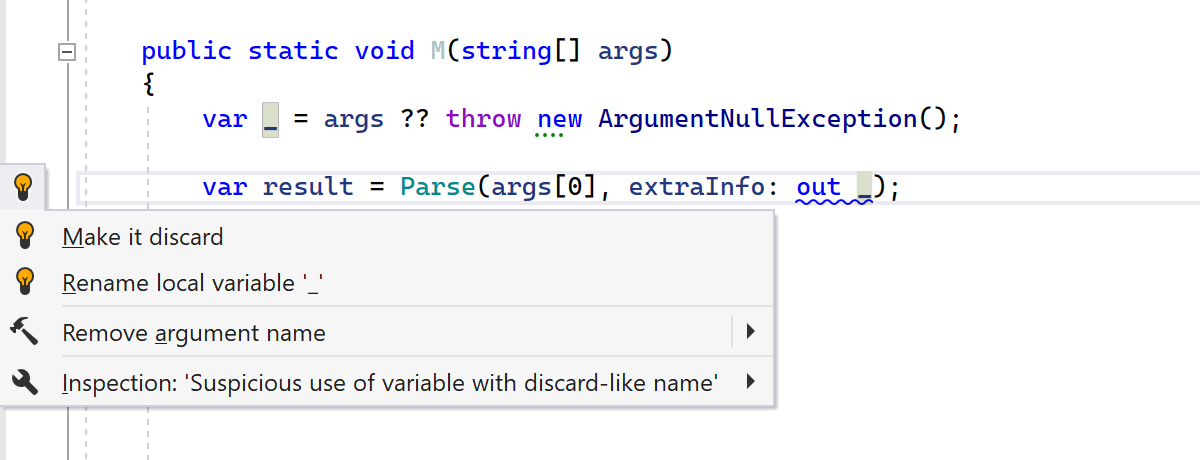
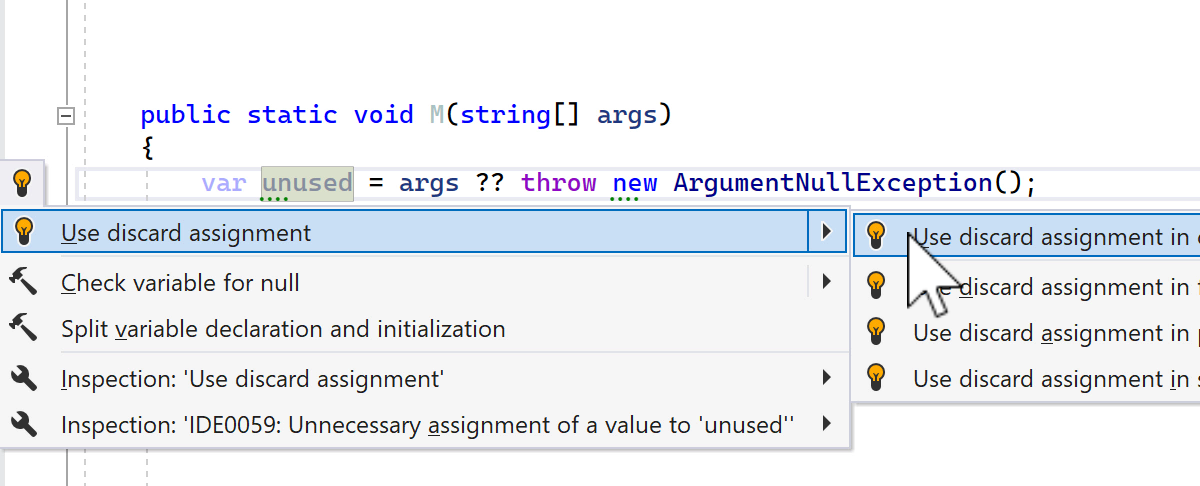
If there is a variable declared like var {name} = ... in your code, and the name consists of “_” or looks like unused{number} or dummy{number} that is actually not in use, then this expression can be replaced by a more succinct _ = ... that maintains the semantics. ReSharper 2023.2 will identify such cases for you and offer a Use discard assignment quick-fix.
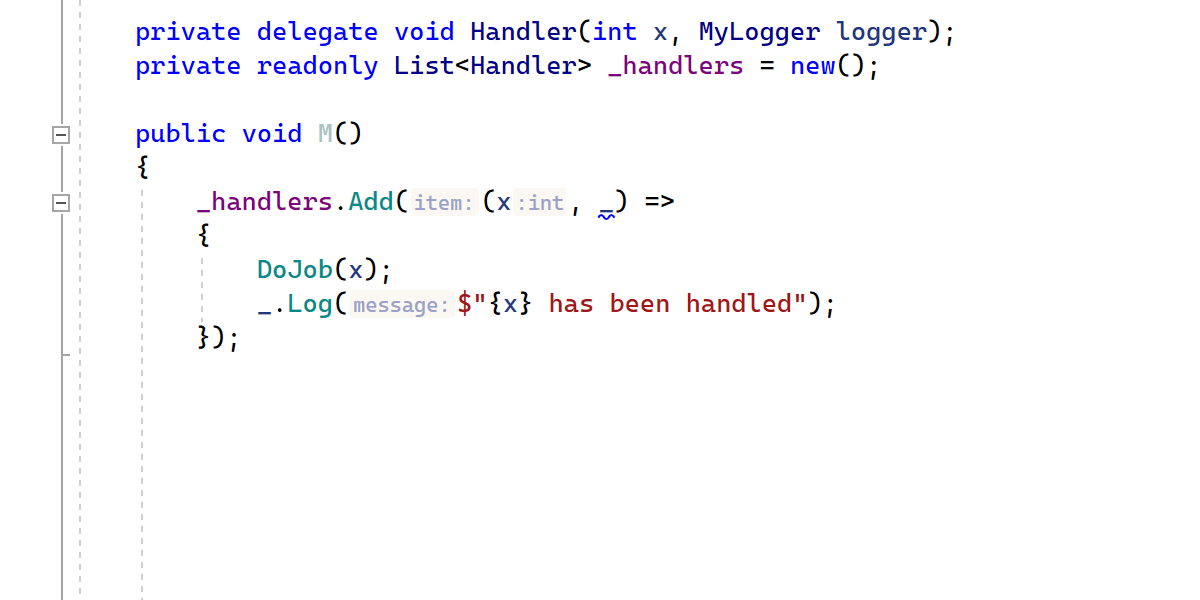
Lastly, ReSharper will identify and highlight lambda and local function parameters named `_` or consisting of several underscores that do have usages, and will suggest renaming them. Parameters with such names are usually only needed as part of the lambda or local function signatures, and their further usages are likely not intentional.
Inlay hints for LINQ
LINQ queries can often be complex, involving multiple transformations and projections. Debugging complex LINQ queries can be time-consuming, especially when dealing with large data sets. To help you easily inspect the output at each step of the query, ReSharper will now display intermediate results as inlay hints during debugging.
With editor adornments showing intermediate results, you should now be able to quickly identify if there are any unexpected values or incorrect transformations happening along the way.
dotTrace
Source View tool window on Linux and macOS
The standalone version of dotTrace on Linux and macOS gets the Source View window. After you select a call in the Call Tree, Source View will show you the source code of the corresponding method.
Other improvements and bug fixes
- For Timeline snapshots, dotTrace Viewer now shows the names of native threads instead of showing them all as Native. This feature will benefit Unity developers, letting them distinguish specific Unity threads. This feature is currently only available on Windows.
- The Source View window in dotTrace Viewer now shows the number of invocations for each line of code.
That’s it for now! For the full list of improvements and fixes that made it into the latest EAP build, please check out our issue tracker. As always, we’d love to hear your opinions and suggestions in the comments below.