

.NET Tools
Essential productivity kit for .NET and game developers
Memory View – Exploring .NET Memory While Debugging with Rider 2018.1

During the past few weeks, the Rider 2018.1 EAP builds came with a number of new debugger features, and today’s build is no different. Rider 2018.1 EAP adds another improvement: a Memory View that lets us explore the managed heap while debugging, allowing us to look into the memory space that is used by our application!
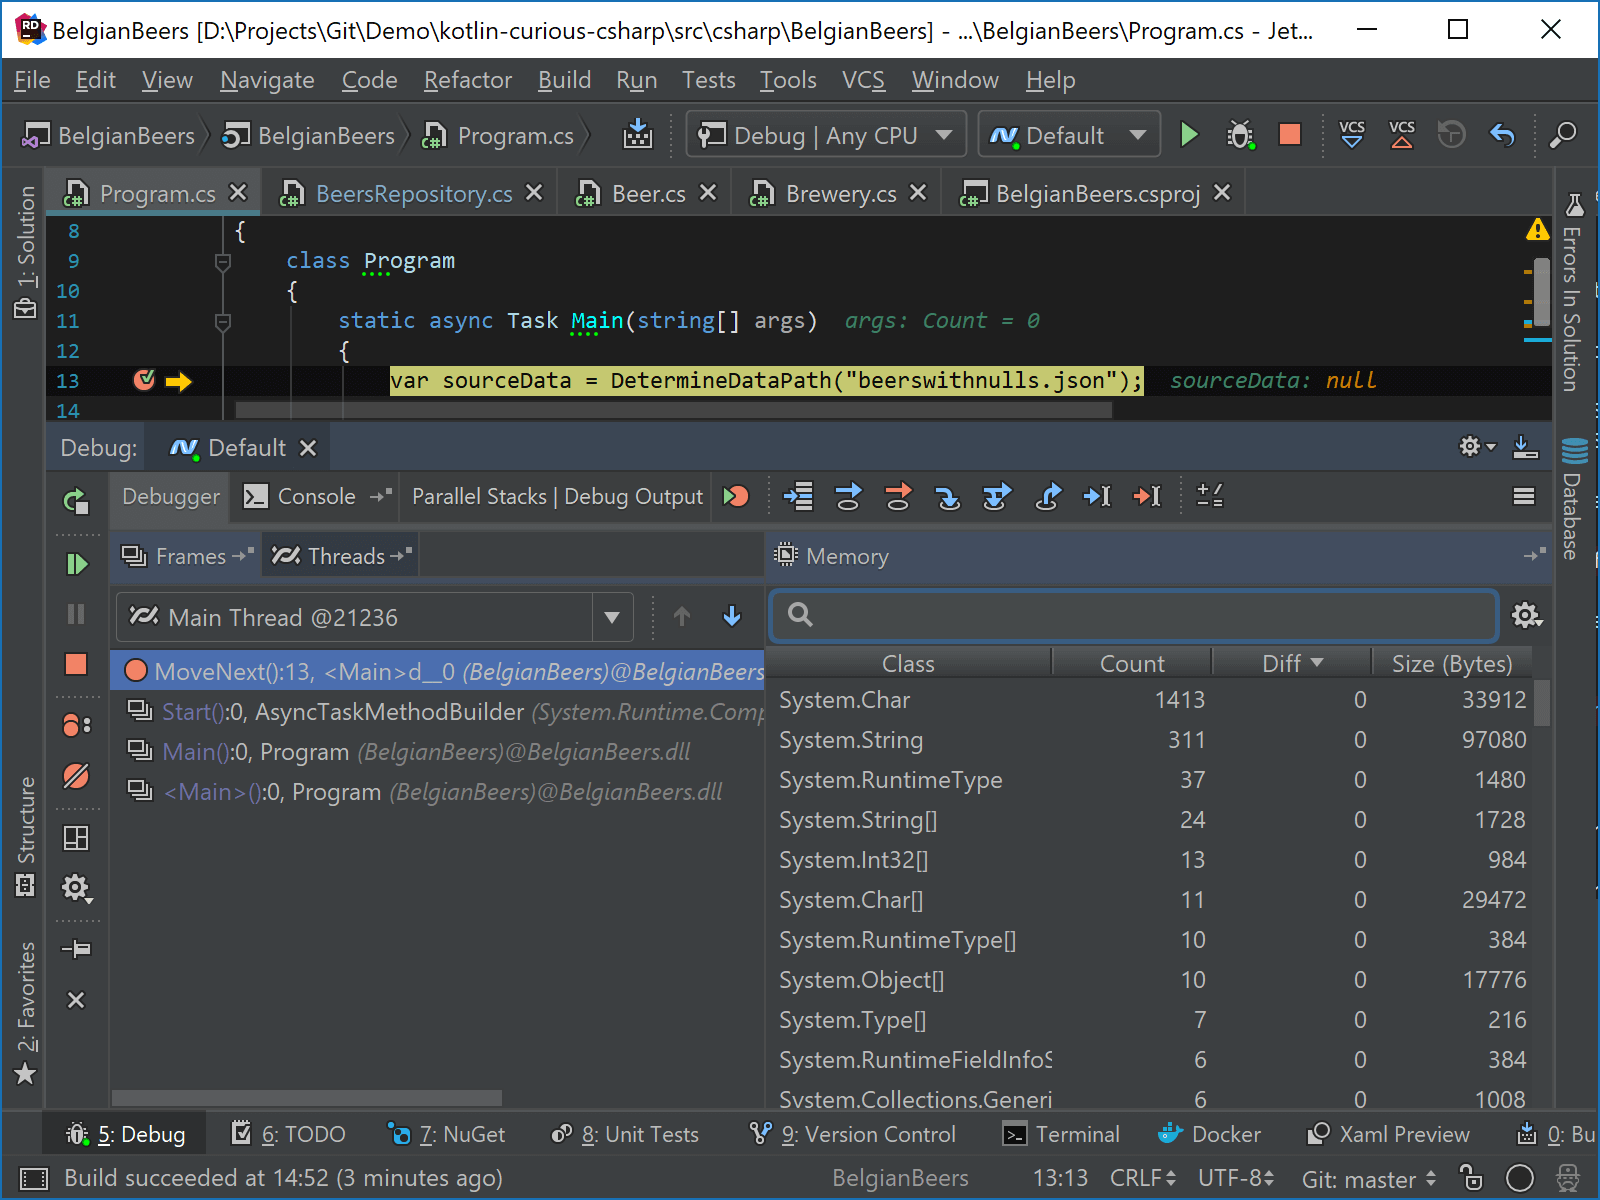
When the debugger hits a breakpoint, we can open the memory view in a separate tab. After clicking the grid, Rider shows us the total number of objects in the heap grouped by their full type name, the number of objects, and bytes consumed.
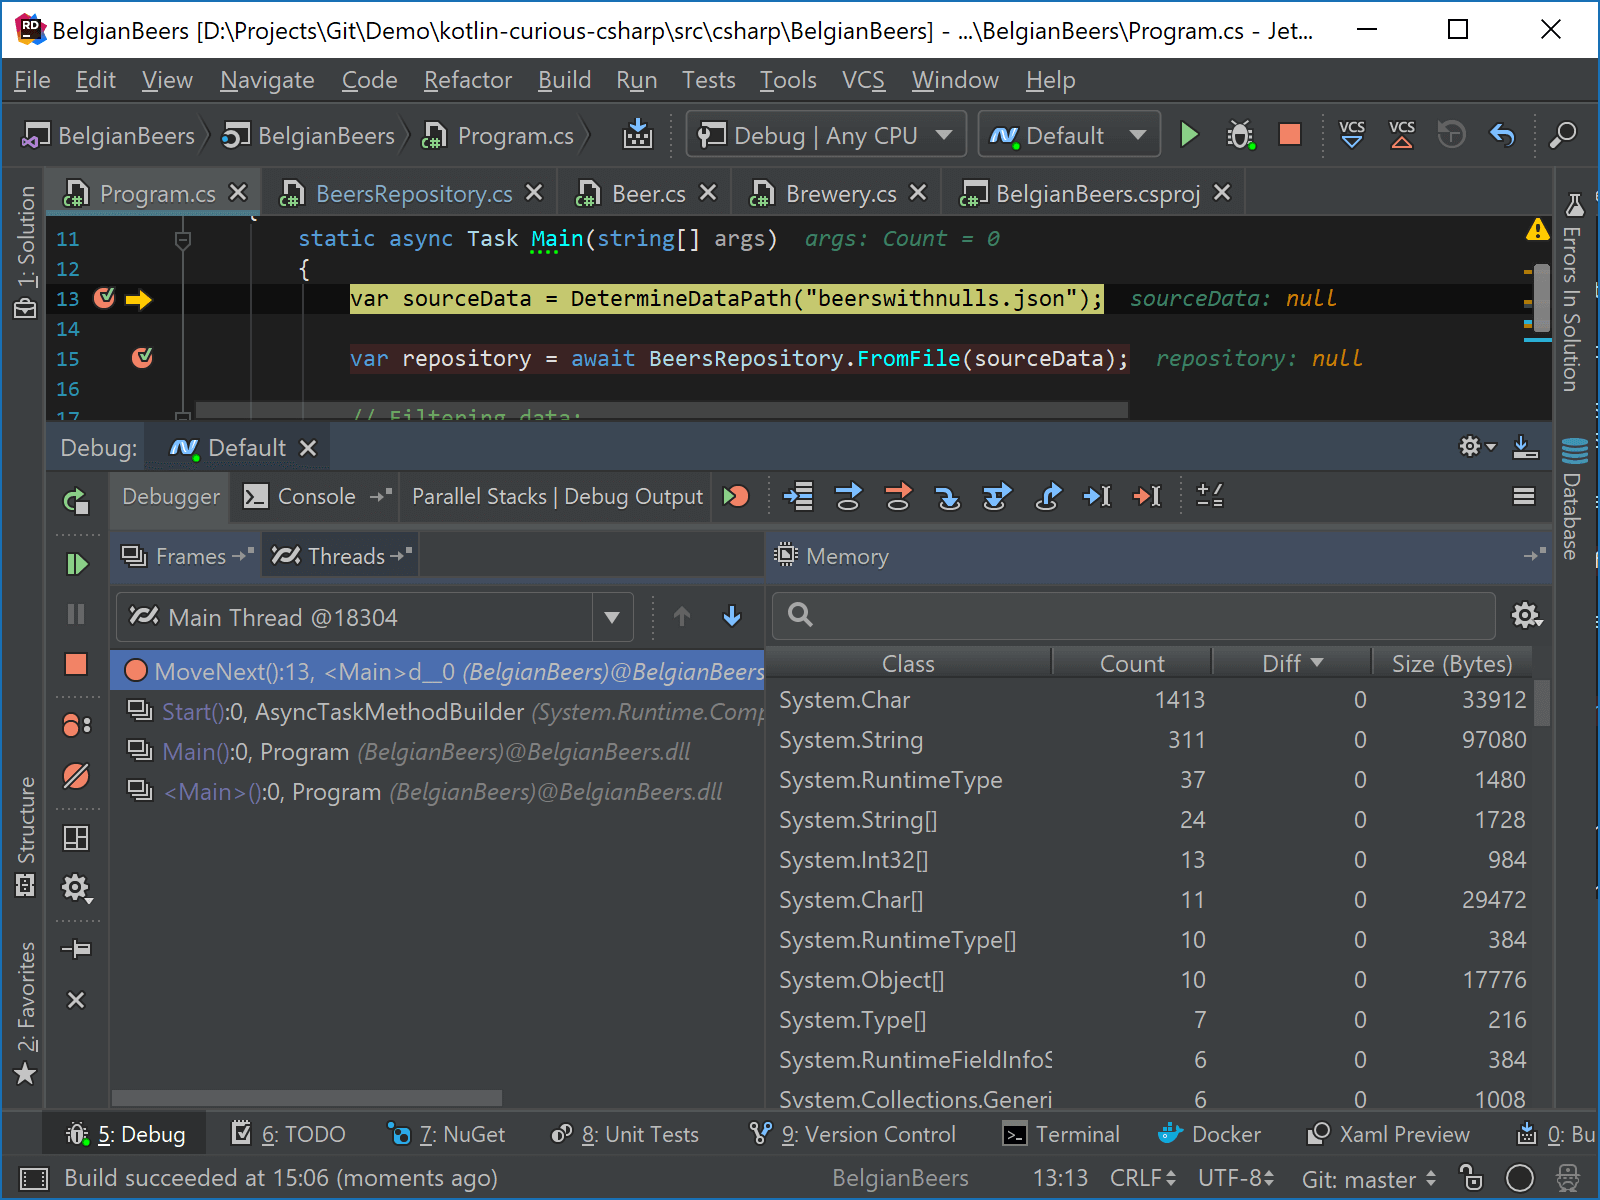
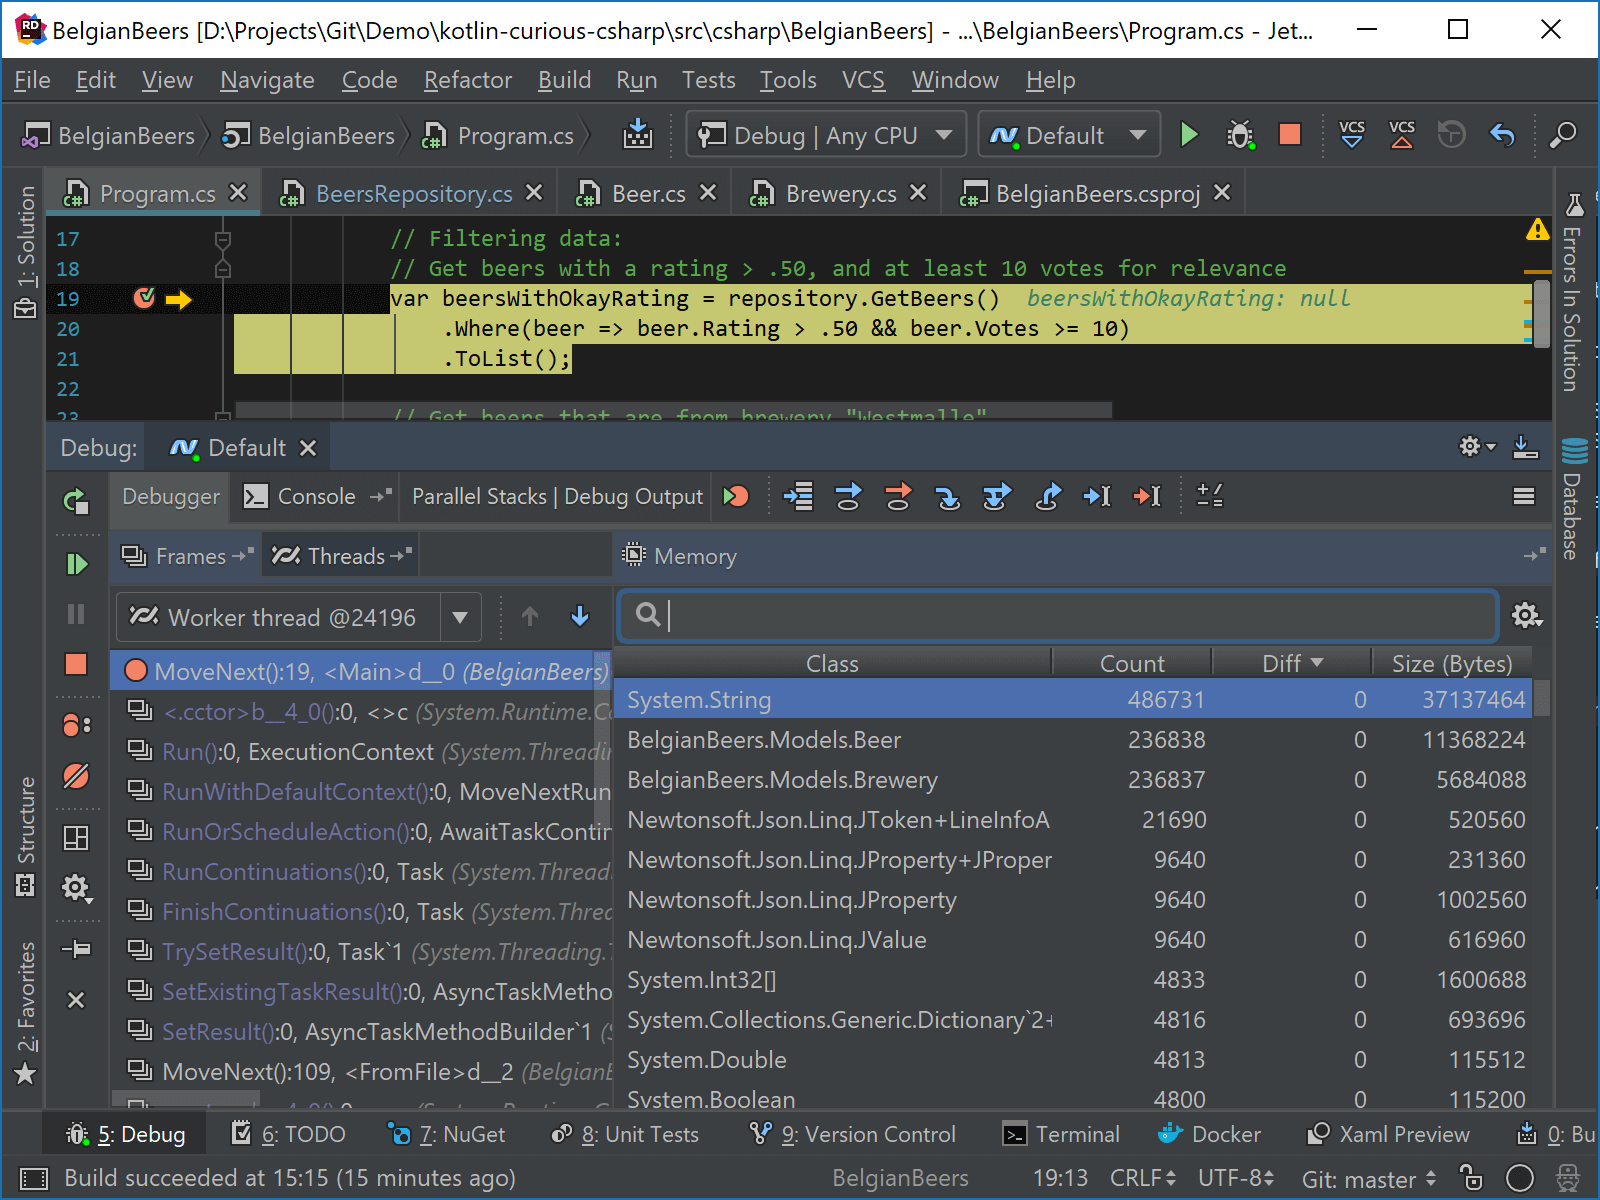
The memory view keeps track of the difference in object count between breakpoints. For example, after loading a large amount of data from a JSON file, we can see the number of System.String instances went up dramatically. This gives us an idea of the memory traffic going on in our application, which could potentially influence performance.
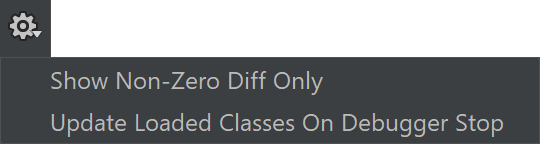
Note the default behavior is that we have to click the view between each breakpoint to update the information. From the toolbar, we can choose to automatically update our view, or choose to only show objects with a non-zero diff.
From the memory view, we can search for specific types. For example, we can search for Beer instances, and then double-click (or Enter) to open the list of instances, where we can inspect details of the instance or copy its value.
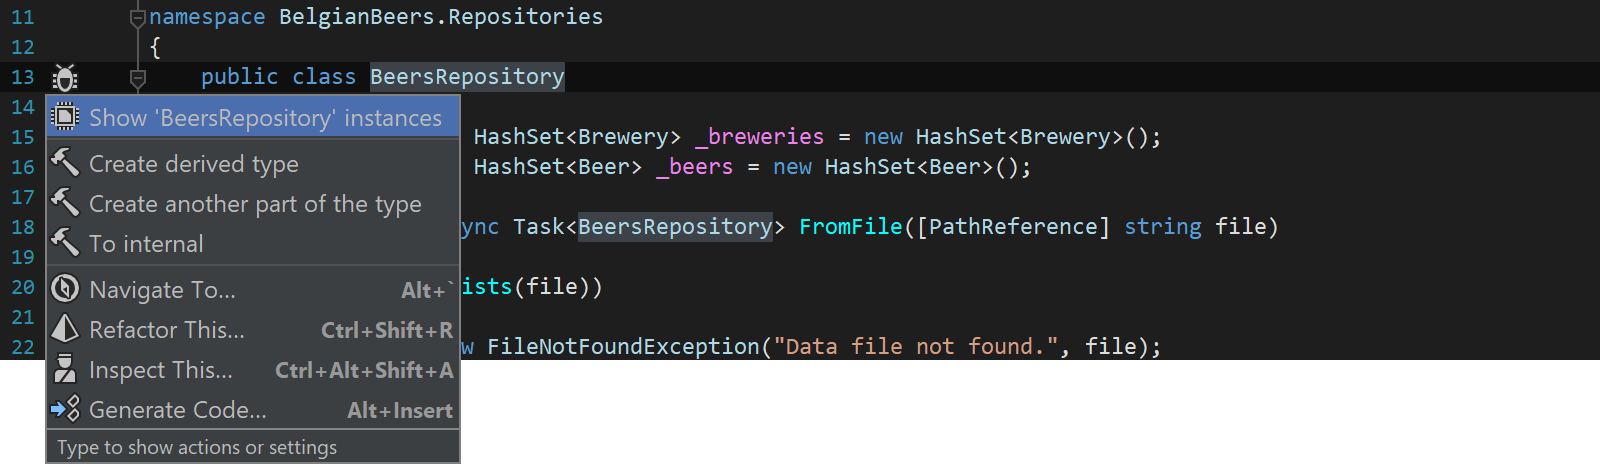
We don’t have to use the memory view to navigate to instances. While debugging, we can use Alt+Enter and show instances of the current type.
The memory view works with the full .NET Framework (4.5+) as well as .NET Core. Mono is not supported.
One last note: while the memory view can greatly help us to explore the effect of our code on our application’s memory space, this is not a full-blown profiler. We recommend using dotTrace and dotMemory to investigate performance and memory for .NET applications.
Give the latest Rider 2018.1 EAP build a try! We’d love to hear your feedback!


