.NET Tools
Essential productivity kit for .NET and game developers
Rider Starts Its Early Access Program for Version 2024.2

The Early Access Program for Rider 2024.2 has just begun! There are several ways for you to get your hands on the first preview build:
- Download and install them from our website.
- Use the Toolbox App.
- Install this snap package from the SnapCraft store if you’re using a compatible Linux distribution.
If you’re curious about our development plans for the upcoming release, please take a look at our most recent Roadmap. You may also want to check out this blog post, where we outline how the EAP program works and the benefits from using it.
Without further ado, let’s take a look at the feature highlights.
Notable fixes
[CVE-2024-37051] We have fixed a security vulnerability related to the JetBrains GitHub Plugin. For more details, please refer to the blog post.
User Experience
New UI becomes the default
Starting with Rider 2024.2, the so-called “New UI” that we first introduced with the 2022.3 releases of JetBrains IDEs has finally become the default for all users.
If you are particularly fond of Rider’s old look, you can enjoy the classic UI by installing the corresponding plugin.
Better UI for the Usages of… popup
Now, whenever you want to find usages of a class, method, or variable in your codebase, the Usages of popup invoked by Cmd/Ctrl + Click will have a more streamlined look with multiple filtering options.

Support for project/solution template parameters with multiple choices
Certain project templates include parameters you may want to configure via multiple-choice selection. For example, a cross-platform application template might have options for various target operating systems or different language locales. To address such cases, Rider now supports the selection of multiple values for a project parameter inside the New Solution dialog.

Version control systems
Enhanced user experience with the Log tool window
All settings related to the Log tool window are now consolidated into a dedicated settings page, making it easy to customize its behavior in one convenient location. You can access this page via Settings/Preferences | Version Control | Log or via a new dropdown menu on the Log tool window’s toolbar.
Additionally, you can now open the Git Log as an editor tab, providing more workspace and easier navigation through the list of commits and related details:
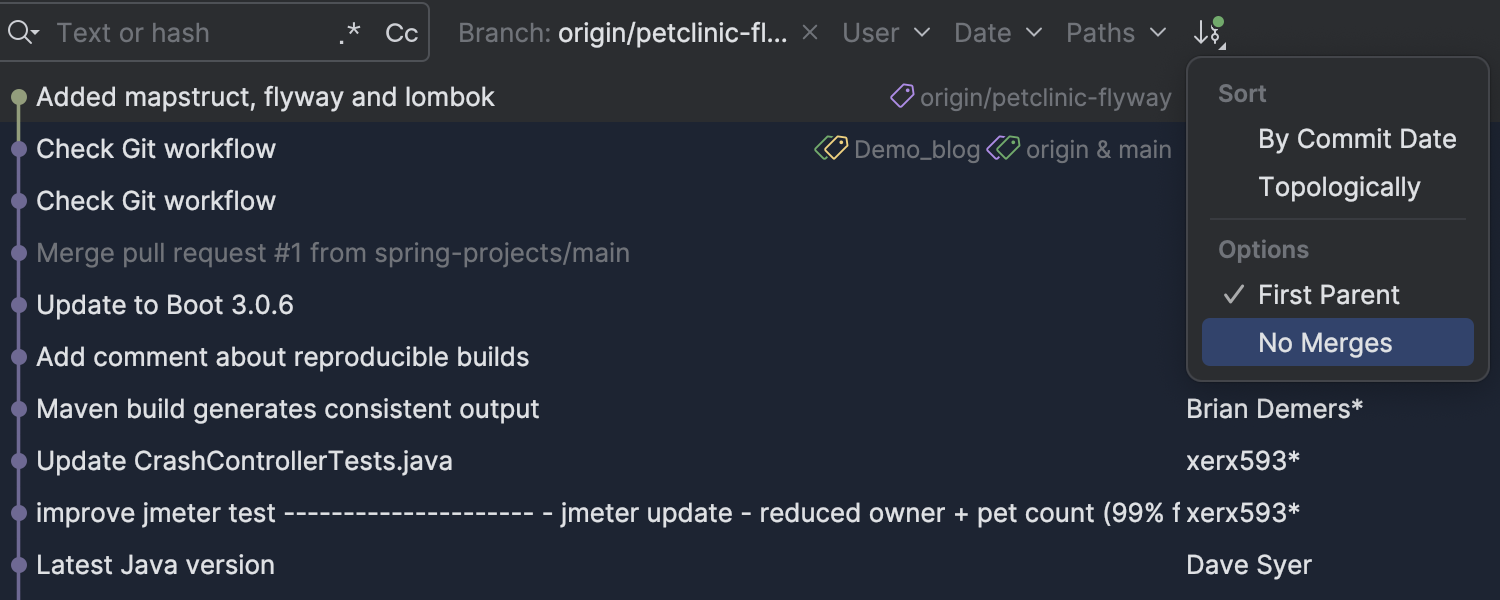
New Graph Options: First Parent and No Merges
Git has a useful option for viewing the history of changes in a branch: –first-parent. Use it with the git log command. This option simplifies the log by hiding individual commits that came with the merge, making it easier to track changes.
We’ve also added filtering with the –no merges command, which displays the history without any merge commits.
Both options can be selected under the Graph Options button in the Git tool window.
You can find more information on the latest improvements to VCS support in this blog post from IntelliJ IDEA.
Web development
The first preview build for Rider 2024.2 includes the latest improvements to web development, namely:
- Recognition of implicitly used configs of tools and frameworks.
- Support for Svelte 5 snippets.
- Support for running tests written in TypeScript using the Node.js test runner.
- Reworked inlay hints in TypeScript files.
For more information on the latest enhancements in web development, please check out this blog post.
Debugging Unreal Engine Applications
The first preview build for Rider 2024.2 includes several improvements to debugging Unreal Engine applications written in C++.
Add to Watches action improvements
The Add to Watches action now generates correct expressions for Natvis items, supporting synthetic Natvis items and container element getters. It includes support for explicit upcasts and downcasts.
Generated expressions are valid C++ code and can be used as part of any other expression, including conditional breakpoints (RSCPP-35792).
Synthetic operators for Natvis data
Rider 2024.2 is now able to generate synthetic operators based on STL and Unreal Natvis data:
- Operators
*,->,!,!=, and==for smart pointers and iterator types. - Operator
[]for array-like containers. - Operators
==and!=for string types, supporting comparisons only with raw string literals.
These operators can be used in any evaluation, including simple expression evaluation, conditional breakpoints, and Natvis (RIDER-106982).
Performance and memory profiling
dotTrace
Timeline snapshot processing with the built-in dotTrace performance profiler is now faster than ever. The latest preview build also comes with improved performance for filtering, call tree and hotspots calculations.
dotMemory
The built-in dotMemory profiler now offers the option to filter object instances by string value. Key points to consider:
- Now when you enter any string value into the filter field in the Instances view of an Object Set, the values that are found will be highlighted in the Value column.
- It’s also now possible to look up object instances by address in the Instances view.
- The filter allows for the use of regex expressions, e.g. ^nAsso.{5,}ID$ matches nAssociatedObjectID.
Decompiler
There is a number of improvements to the decompiler inside Rider available in this build, namely:
- Support for decompiling lambdas with optional and parameter-array parameters (DOTP-8042).
- Improved handling of attributes on lambda expressions.
- Option to specify if you’d like to decompile protected assemblies (RSRP-481584).
- Support for navigating to sources from PDB files containing both SrcSrv and SourceLink (RSRP-496292).
- Correct recognition of preprocessor directives from the target framework or Portable PDB of the associated assembly (RIDER-106794).
- Detection of the Release/Debug build configurations (DOTP-8100).
Click here for more information on these changes.
Other highlights
- Starting with this build, Rider comes with JetBrains Runtime 21, which offers enhanced security and performance, as well as Wayland rendering support for Linux. See the following issue for more details: JBR-5855.
- Rider now shows field offsets and sizes when hovering over fields in C++ code. This enhancement provides immediate visibility into the memory layout of structures, aiding in debugging and development tasks.
Other changes
- Previously, whenever you pressed F5 to resume debugging after hitting a breakpoint, Rider remained in the foreground instead of switching focus to the target process [RIDER-10456]. Some users find this behavior disruptive to their workflow. To address this, we’ve introduced a new option in the settings to keep the target process in focus after resuming debugging.
To enable the Focus target process after resume option, go to Settings/Preferences | Build, Execution, Deployment | Debugger.
- The debugger now displays all of the variable data correctly, even when the thread under evaluation is not at a garbage collection safe point. [RIDER-10885]
That’s it for the first installment of the Early Access Program for Rider 2024.2! For the full list of changes introduced in this build, please refer to our issue tracker.
We hope you’ll join us on the EAP journey over the next few weeks. As you continue testing the newest additions to Rider, please don’t hesitate to share your feedback with us here on the blog, on social media, or via our issue tracker.