.NET Tools
Essential productivity kit for .NET and game developers
How We Made Variable Inspections 87 Times Faster for Unreal Engine in Rider


If you’ve ever expanded a complex Unreal Engine variable in Rider’s debugger and had time to contemplate your life choices, this post is for you.
We’ve rewritten our expression evaluator, and the results are dramatic: Variable inspection is up to 87 times faster on warm runs and 16 times faster on cold ones. The debugger memory usage has dropped to just over a third of what it was. And there’s even a bonus benefit, but more on that at the end.
These improvements are already available for you to test in Rider 2026.1 EAP 1. But how did we get here? Buckle up – things are about to get very technical, but the payoff will be worth it.
The Natvis of it all
Variable visualization is one of the most important features of any debugger. Without it, debuggers show just raw class fields – no array elements, no map contents, just raw pointers to memory, trees, and hash tables. There are many ways to tell debuggers how to display types nicely: pretty printers, data formatters, Natvis, and others.
If you use the MSVC C++ toolchain to build your programs, there’s a 99% chance you’re using Natvis. Natvis allows you to describe how to visualize your types. You can specify which items to show and describe that a type should be visualized as an array. Or, if you have a hash table, you can write complex expressions with temporary local variables, invisible to the debugged program, for extracting elements. Natvis also supports intrinsics – user-defined functions that prevent code duplication and make expressions more structured.
To understand what Natvis does, let’s look at a simple example with std::string using the standard stl.natvis:
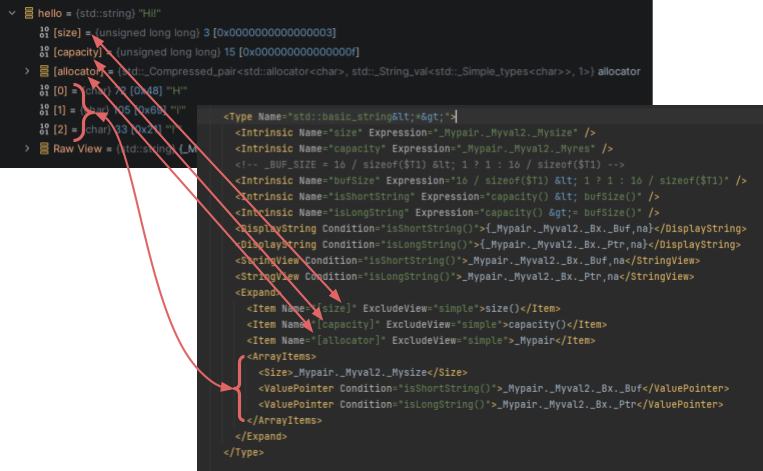
As you can see, the debugger must evaluate at least 6 expressions when you expand a simple string object.
The LLDB challenge
Rider supports Natvis, and uses it when you debug native C++ applications on Windows. But here’s the tricky part: Rider uses LLDB as its native C++ debugger, and LLDB doesn’t support Natvis natively. Instead, LLDB supports data formatters, which allow writing arbitrary Python code.
We thought we had it all figured out when we developed a special data formatter that implements Natvis support under Rider’s hood. The formatter parses Natvis files – matching types, creating items, generating summary strings, and building child hierarchies… Except we ran into some problems.
We had to use LLDB’s expression evaluator to evaluate Natvis expressions. This evaluator uses Clang under the hood, which is powerful but brings significant issues:
- Maintenance pains: Clang parsers are notoriously difficult to maintain. Sometimes, valid Natvis expressions simply wouldn’t compile, and debugging these failures was extremely challenging.
- Performance problems: It’s slow – very slow.
- Limited intrinsic support: There’s no simple way to register and call intrinsics.
- Memory pollution: Declaring temporary variables for expressions injects those variables into the debugged process.
To work around these issues, we accumulated hacks everywhere. We had hacks in Clang, tried inlining intrinsics, and used top-level function declarations (an LLDB feature) for intrinsics that couldn’t be inlined. To improve performance, we cached Clang parsing results. But all these workarounds were unreliable and unstable.
If you use Rider for Unreal Engine, you’ve probably noticed that after updating the Unreal Engine version, TMap or TArray visualization sometimes stops working. This happens because Unreal.natvis becomes more complex with every update, and LLDB’s expression evaluator can’t handle the new expressions properly. Additionally, using LLDB’s expression evaluator within LLDB data formatters is fundamentally problematic.
Building our own solution
To eliminate these issues, we decided to rethink how we work with Natvis entirely. Our first step: develop an alternative expression evaluator for Natvis without Clang. We knew about lldb-eval – another custom expression evaluator for LLDB that’s fast and powerful – but we wanted complete control, so we implemented our own evaluator from scratch.
Yes, we threw out an entire time-tested system and rewrote everything. Before you question our sanity, let us show you why it was worth it.
The results
We didn’t create artificial synthetic projects for testing. Instead, we used a standard Lyra game demo and created a script that recursively dumps variable children, emulating the scenario where you expand variables to see their contents. The script processes 6,000 values with two measurement scenarios: cold debugger (the very first evaluation, like a fresh debug session) and warm debugger (with all caches warmed up).
| Cold | Warm | Debugger RAM usage | |
| Standard LLDB evaluator | 115 seconds | 7 seconds | 9 GB |
| Our new evaluator | 7 seconds | 0.08 seconds | 3.5 GB |
That’s 16 times faster on cold starts and 87 times faster on warm runs! Plus, it takes just over a third of the memory as before. The difference is immediately noticeable during debugging. On massive Unreal Engine projects, the improvement is even more dramatic.
The bonus benefit we promised you
Our new expression evaluator delivered two additional benefits we did not foresee.
? Core dumps finally work properly . The standard LLDB evaluator performs poorly with core dumps – almost every expression from Unreal.natvis fails, resulting in terrible visualization. With our new evaluator, Natvis works completely and reliably. The difference is striking:
Performance is better across the board. Since this is a general expression evaluator, we also use it for:
- Normal expression evaluation (Add to Watches actions)
- Conditional breakpoints
While the performance boost here isn’t as dramatic and depends on the specific expression, even simple expressions make conditional breakpoints at least 20% faster. For complex expressions, the difference can be even larger!
What do you think?
These improvements are already available for you to test in the Early Access Program builds for Rider 2026.1. Give one of the EAP builds a try (they’re free!) and let us know how much faster your debugging sessions become.
If you enjoyed this story, perhaps you’d also like a to know how we made LLDB’s stepping time 50 times faster in Rider. Cheers!