

.NET Tools
Essential productivity kit for .NET and game developers
ReSharper Ultimate 2016.3 EAP 4

Another week, another ReSharper Ultimate 2016.3 EAP build! EAP 4 is out now, and brings a number of new features.
dotTrace and .NET Core
EAP 4 adds initial support for profiling CoreCLR based .NET Core applications to dotTrace. Initial support means that there are a number of rough edges, not only because the CoreCLR itself has some issues with supporting profiling. Notably:
- Windows only. This feature is aimed at the CoreCLR, and as such doesn’t add profiling for Mono based .NET Core apps. We currently have no plans to support profiling on Mono. Also, because dotTrace is a WPF application, it only runs on Windows.
- Sampling and tracing modes only. The CoreCLR is missing functionality required by dotTrace’s Timeline mode.
- Attach to process is not supported by the CoreCLR. All profiling sessions must begin by starting the process.
- Requires the COMPLUS_ReadyToRun=0 environment variable to be set. This is to work around issues with the implementation of profiling in the CoreCLR. Future EAP builds will remove the need for this step.
To get started, first set the COMPLUS_ReadyToRun environment variable, as mentioned above, and then start dotTrace. Then:
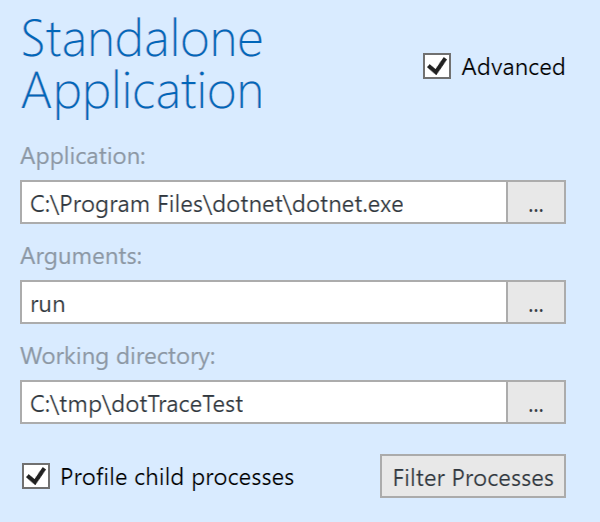
- Select “Standalone” as the application type.
- Add C:\Program Files\dotnet\dotnet.exe as the application.
- Check “Advanced”.
- Set the “Arguments” field to run, and point the “Working directory” field to your project folder (where project.json lives).
- Check “Profile child processes”.
- Select “Sampling” or “Tracing”.
- Check or uncheck “Start immediately” to either start profiling immediately, or control with the popup window.
- Click Run.
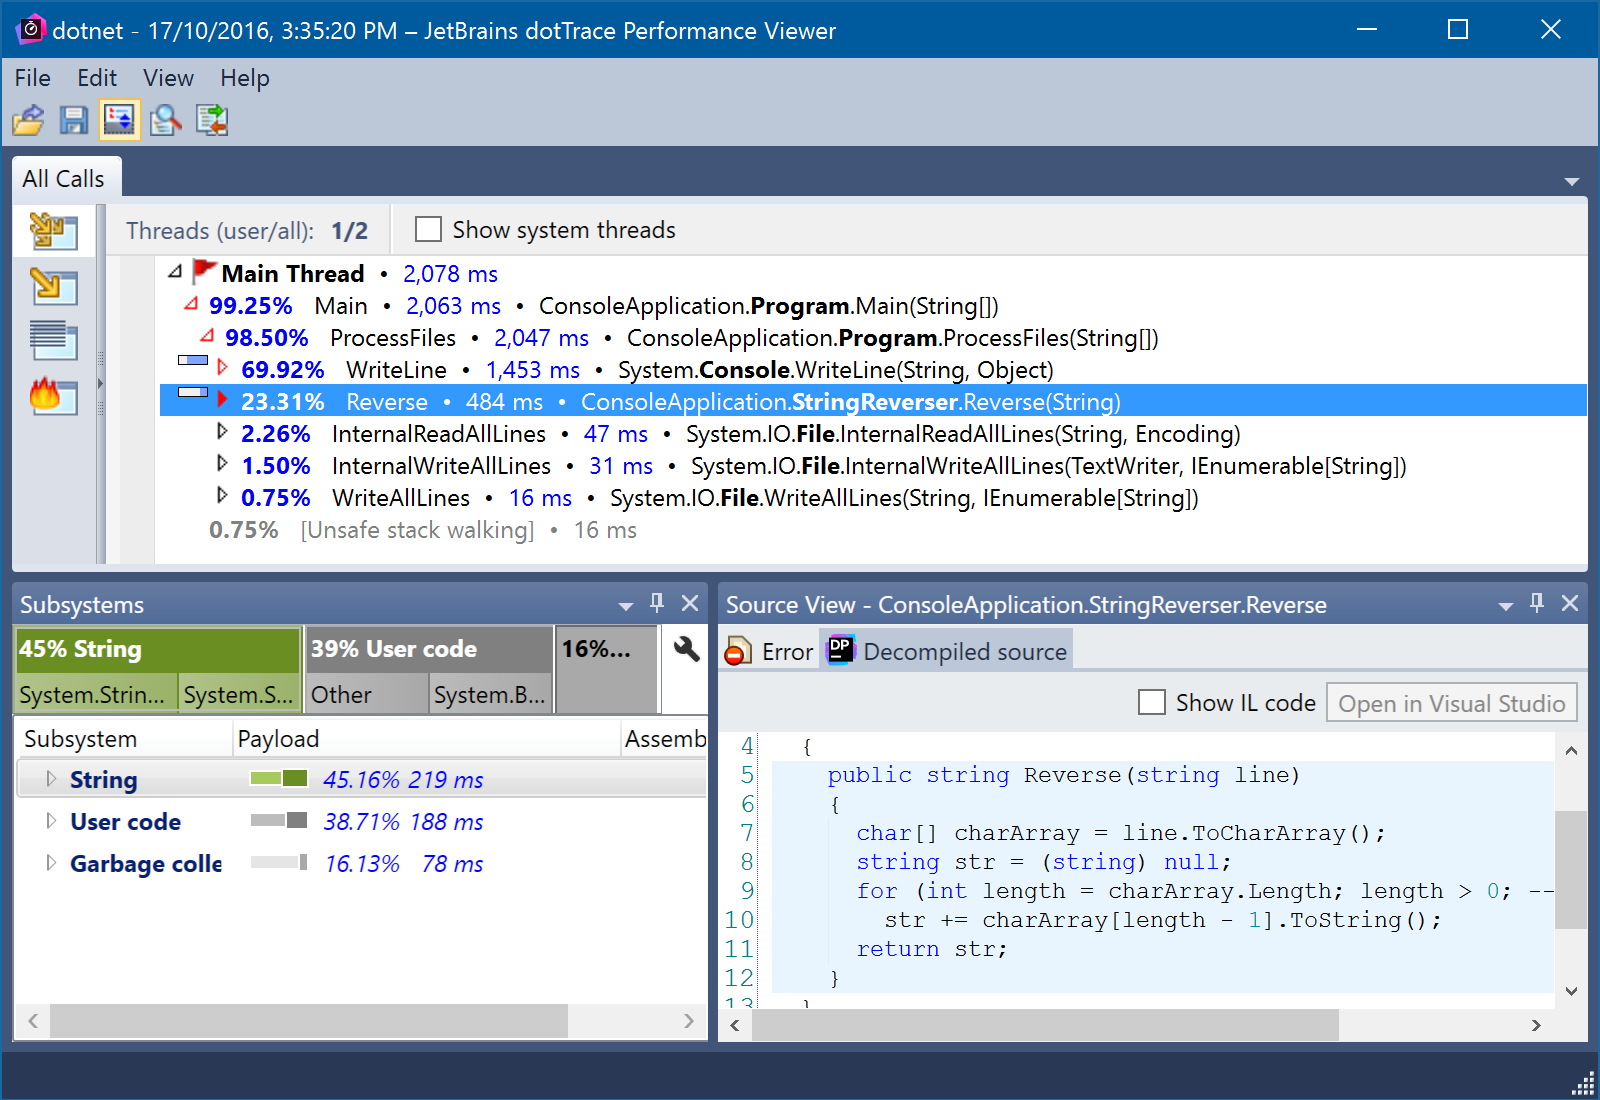
The application is then profiled, as normal. Once the application finished, or you collect a snapshot via the control panel, the snapshot is available in the Snapshots section of dotTrace. You can click Open and view the results, with all of the expected dotTrace functionality, listing method names, decompiling source, what-if analysis and so on.
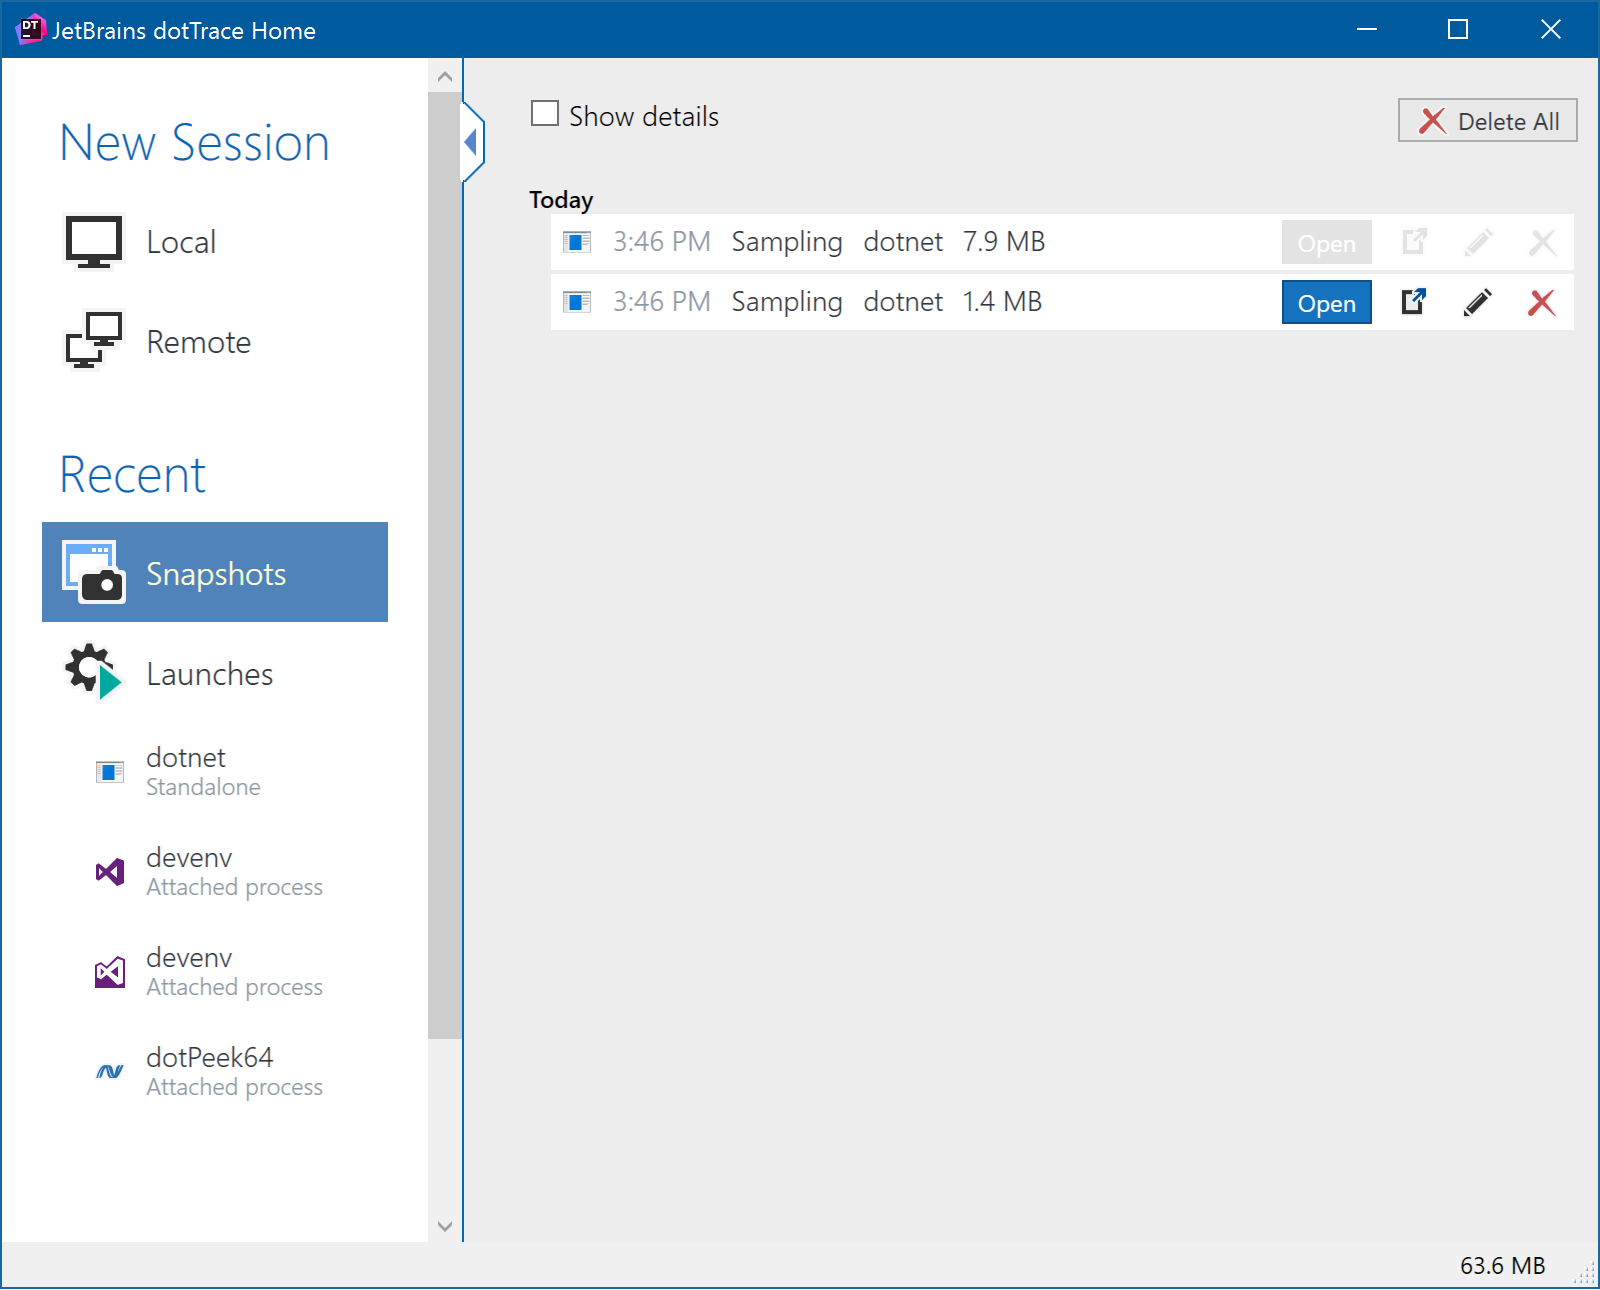
PLEASE NOTE: .NET Core applications execute your user code in a child process of the initial dotnet run process. By default, dotTrace will automatically open the snapshot results of this initial process, which doesn’t contain any of your user code! To view the results for your code, you have to navigate to the Snapshots section of the dotTrace main home screen and open the child process results manually. (Alternatively, instead of profiling dotnet run, you can profile dotnet my.dll, with the working directory set to the output directory for the assembly. dotTrace will automatically open the correct snapshot.)
This build has been focused on getting the engine working with the CoreCLR. We’re very much interested in your feedback on the user experience. Please comment on these issues: DTRC-23694 and DTRC-23696.
ReSharper
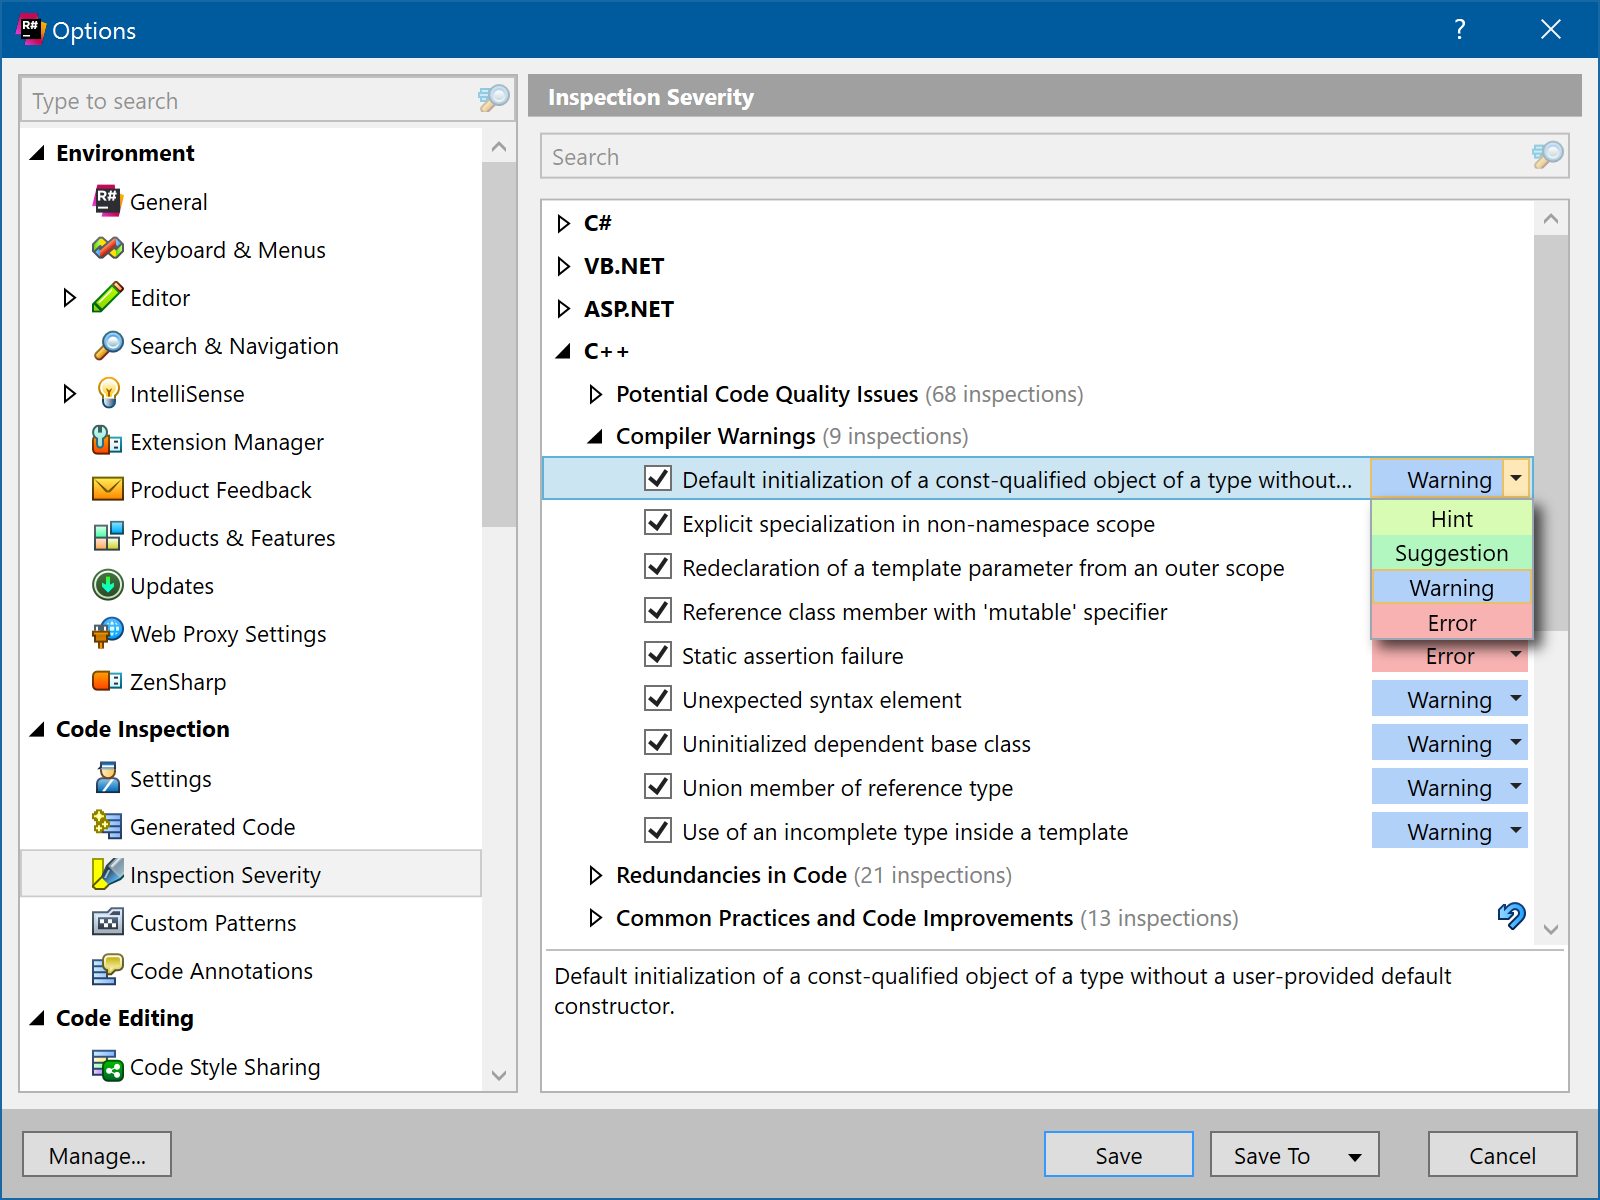
Inspection severity options redesigned
We always sweat the small stuff at JetBrains, and we have a couple of features for ReSharper that are small, but we think are important. For example, the inspections severity options page has been redesigned, mainly because we were running out of space for new languages with the old design!
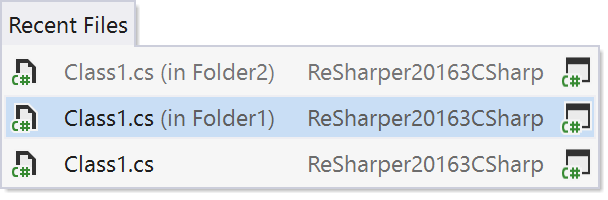
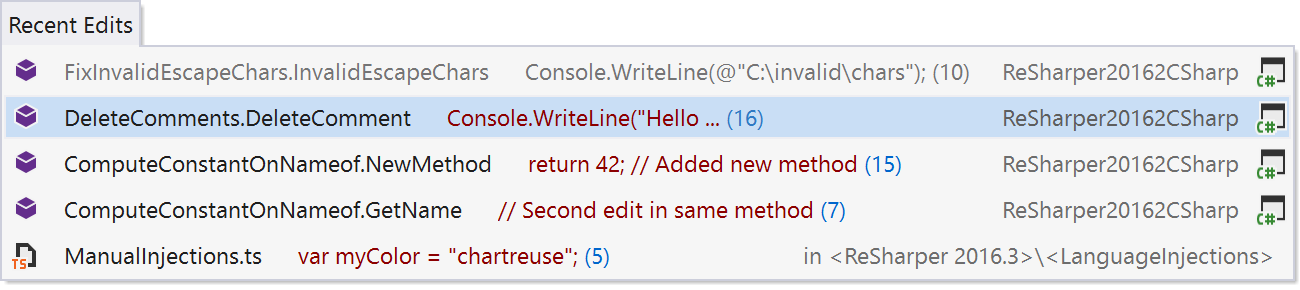
Revised Recent Edits and Recent Files
We’ve also tweaked how the Recent Files and Recent Edits popups work and show their results. Specifically, Recent Files can now delete entries with the Delete key, and both the Recent Files and Recent Edits popups will now also show the path of the file, to avoid confusion with similarly named files. Finally, the Recent Edits popup will also merge edits in the same method.
Join Lines
And we’ve added one more very small but very useful editing feature – Join Lines. It simply joins two lines. That’s all! It’s a feature that a number of us miss from IntelliJ, so we’ve added it. It even has the same keyboard shortcut – Ctrl+Shift+J, at least, in the IntelliJ keymap scheme. And this is where we need your feedback. We haven’t added a shortcut for this in the Visual Studio scheme. You can easily do this yourself, by going to Tools → Options → Keyboard and assigning a shortcut to the “ReSharper.ReSharper_JoinLines” command. If you’d like to suggest a default shortcut for the Visual Studio scheme, please add a comment to issue RSRP-461295.
Visual Basic 14 smart name resolution
And finally, we’re fixing a “red code” issue with Visual Basic 14, which ships as part of Visual Studio “15”. Just like VB, we’ll now use “smart name resolution“, by inferring which namespace you meant from conflicting choices based on the type you’re using. For example, if you use Threading.Thread, you clearly meant System.Threading.Thread, and if you use Threading.Dispatcher, we understand that you mean System.Windows.Threading.Dispatcher.
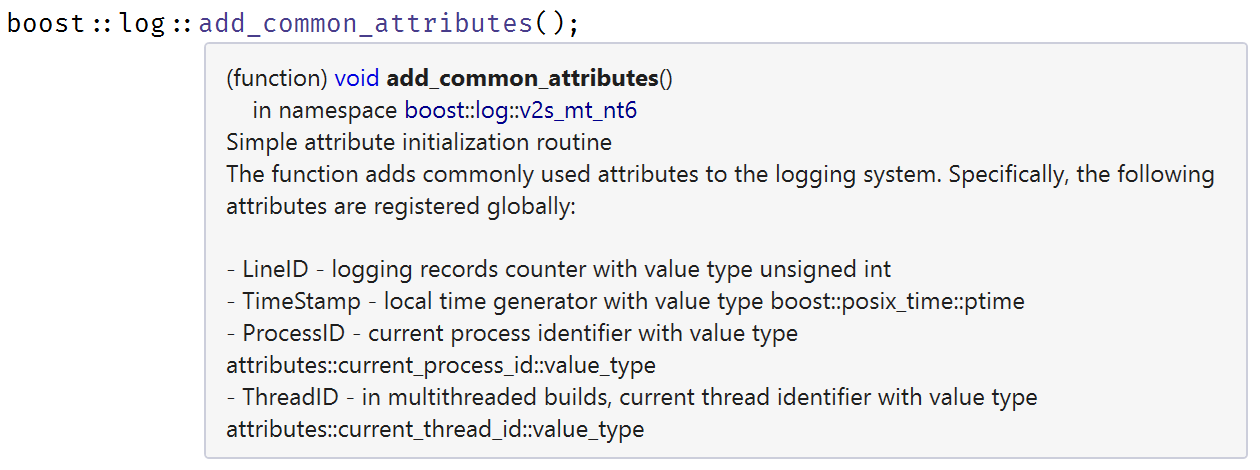
ReSharper C++ and its tooltips
Starting in EAP 4, ReSharper can now display rich, syntax highlighted tooltips for C++ code elements. The tooltips will display method and field signatures, as well as formatting any doxygen doc comments.
To enable, make sure the the check the “Replace Visual Studio tooltips” option is checked in the Editor → Appearance options page.
Download
As ever, please download the EAP and take it out for a spin, and let us know about any issues you encounter.


