

.NET Tools
Essential productivity kit for .NET and game developers
Redesigned filters in dotTrace 2016.3

If you are a long-term user of dotTrace Timeline Viewer, you’ve likely noticed some UI changes in dotTrace 2016.3. What has changed exactly and, more importantly, why were these changes made? Read on to find out.
Events filter
Before 2016.3, it was not obvious where you should start examining a snapshot. Potential sources of performance drops were spread around the UI: Memory Allocation in Analysis Subject, separate Garbage Collection filter, File I/O in Interval Filters, and so on.
We’ve decided to leave just one place for all events that may affect performance — the Events filter. As a result, you no longer need to observe the UI trying to identify the best starting point. It’s all here.
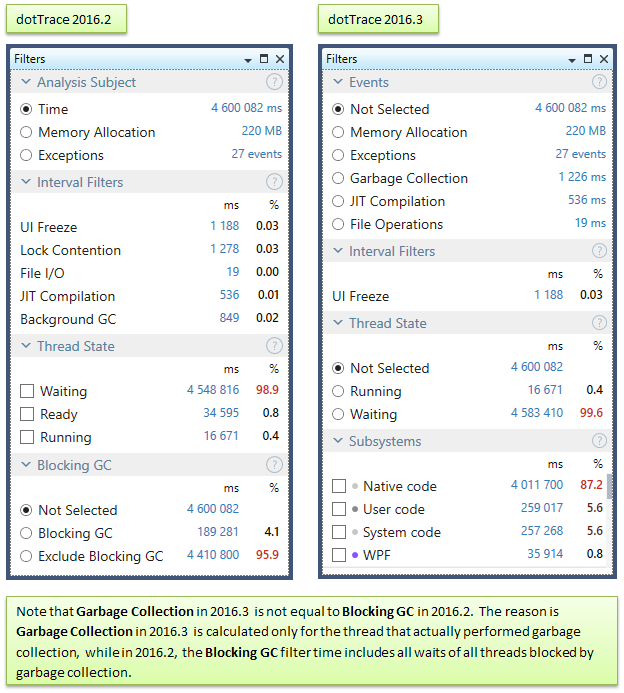
Note also that Events have got a lot of filters from Interval Filters (currently only two filters are left in Interval Filters, UI Freeze and Incoming HTTP Requests). The reason for doing this (besides the one given above) was that most of these events don’t normally intersect with each other, because they represent blocking activities (e.g. file operations, lock contentions, and SQL requests). Selecting one of the Intervals Filters would usually disable others. So, keeping such filters there didn’t really make a lot of sense. The rare cases when these events intersect with each other are now covered by Subsystems (make sure to learn more about this super-helpful feature in a separate post).
In summary, the new Events filter is now a single place that allows users to select a particular event and answer the question “What do I want to analyze?”.
Thread State filter
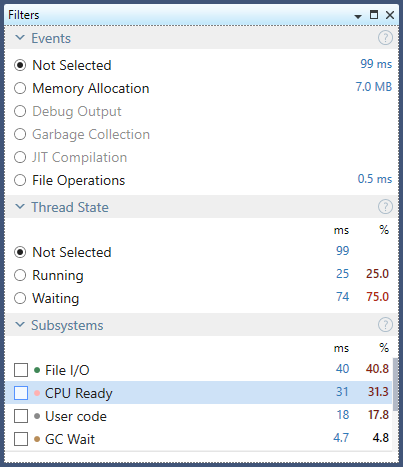
The next change, which isn’t so dramatic, is moving the Ready state from the Thread State filter to Subsystems. Why?
First of all, the meaning of this state was not obvious for some users. Now, Thread State turns into a simple switch which makes it an ideal tool for work/wait analysis. For example, it can be helpful to distinguish between cached file I/O (Running) and disk I/O (Waiting) or detect spinwaiting inside lock contentions (Running).
The second reason is that Subsystems seem to be a perfect fit for the Ready state. The general idea behind Subsystems is to have a single place that shows how time in the current scope is distributed among various activities. So, the Ready subsystem can quickly answer the question “Was that lag caused by CPU starvation?”.
We believe these UI changes make dotTrace even easier to use. As usual, we suggest that you download ReSharper Ultimate and try the updated dotTrace for yourself. Let us know what you think!


