.NET Tools
Essential productivity kit for .NET and game developers
Rider advanced debugging with breakpoints

A big part of our developer life is spent debugging code. Whether we like it or not, sometimes the only way to understand code is to run it and step through it step by step and see which values are being stored in variables, what is the result of a method call, and so on. This information comes in handy when exploring a codebase and when diagnosing and troubleshooting an issue in code.
In our previous posts about debugging, we’ve seen how we can run and debug a .NET project and set a breakpoint to inspect the call stack and variables that are currently in scope and how we can step through code. There are a few more tricks to know when it comes to debugging: exception breakpoints, conditional breakpoints, hit counters, and more! These advanced breakpoint types help reduce the time required to debug a certain application state or logic flow, letting us be more productive while debugging.
In this series:
Keyboard shortcuts described in this post are based on the Visual Studio keymap.
Let’s first look at the different breakpoint types supported in Rider!
Configuring breakpoints
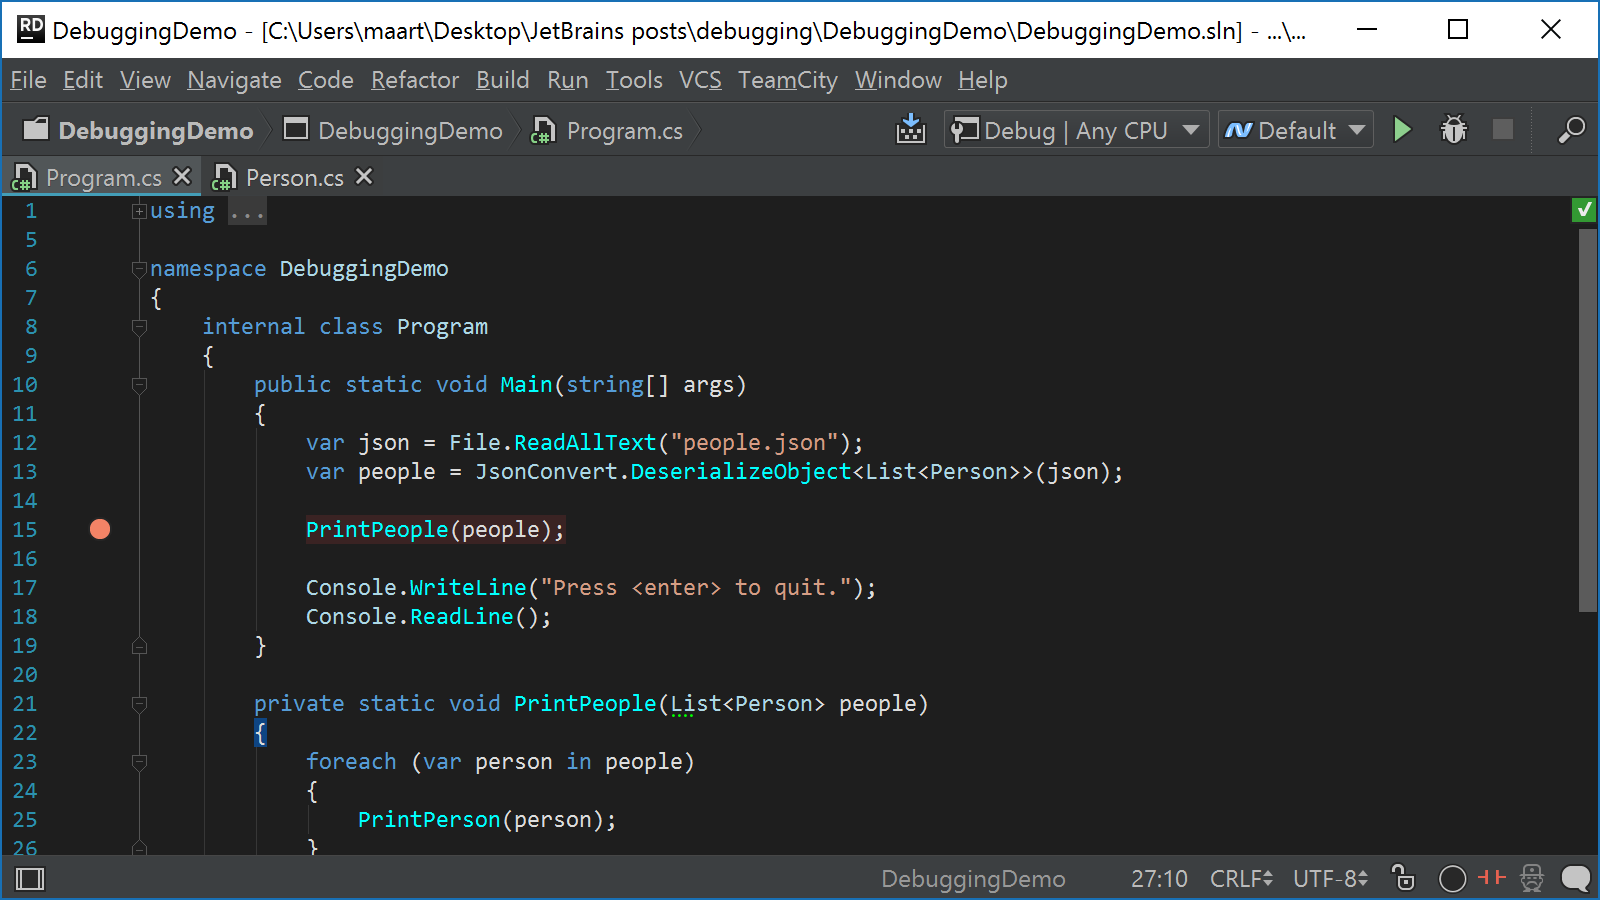
Breakpoints can be set by clicking the left gutter, which will display a red bullet when the line is considered a breakpoint. Breakpoints can also be toggled using the F9 key.
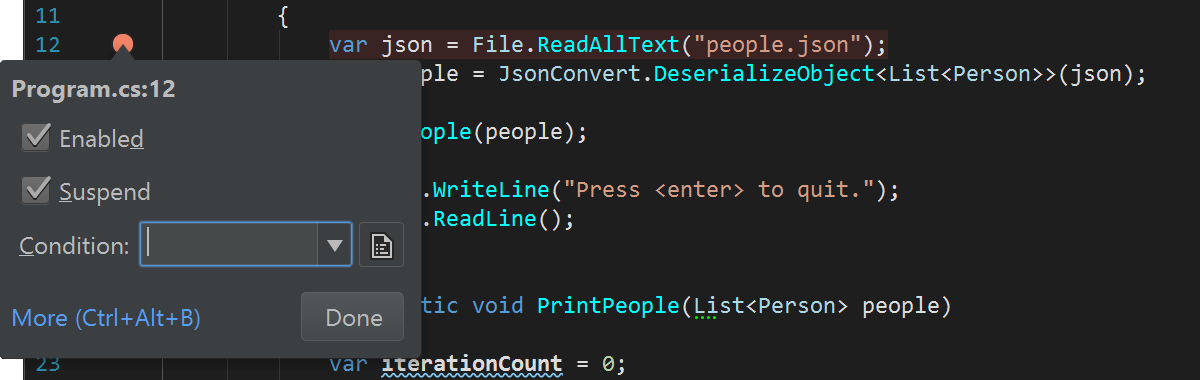
We can access details for breakpoints from several places. For any given breakpoint, there’s a right-click context menu we can use to enable/disable the breakpoint, and set whether the application should be suspended when the breakpoint is hit.
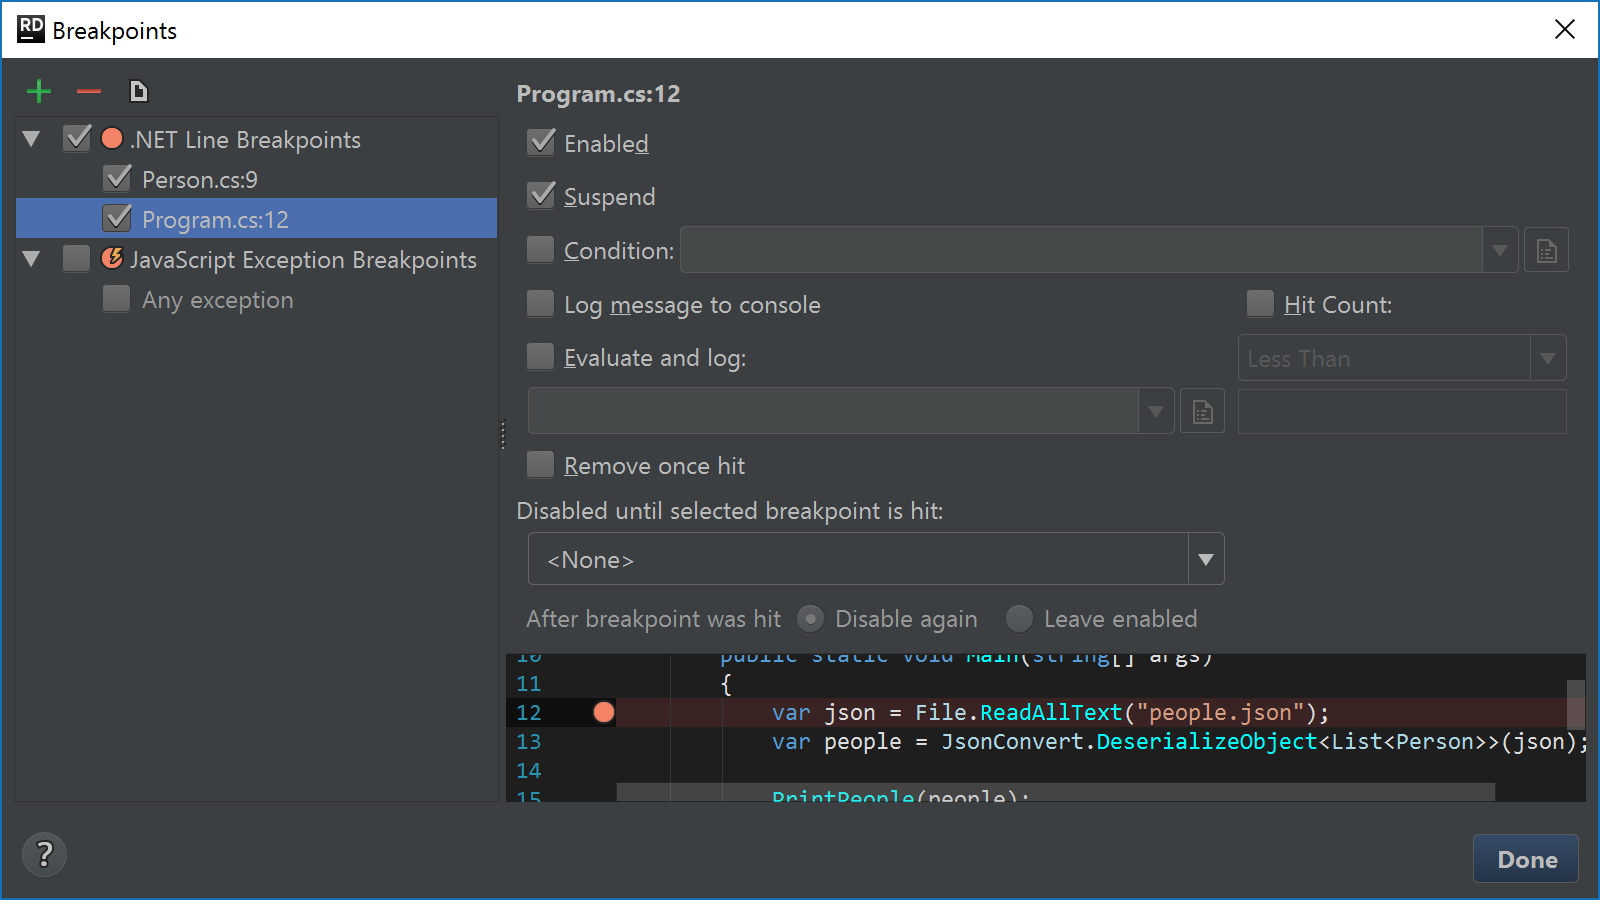
We can use the Run | View Breakpoints… menu (Ctrl+Alt+B) to get an overview of all breakpoints in our solution. Note that the favorites tool window (Alt+2) also displays breakpoints. From the Breakpoints window, we can enable/disable breakpoints and configure various other options, both for .NET code as well as JavaScript.
Let’s go over the different options by looking at when and why we would use them.
Conditional breakpoints
Suppose that in our application’s codebase, we’re only interested in pausing execution at a breakpoint when a certain condition is true. For example, we may only want to pause execution at a breakpoint in a loop when we’re working with a specific value to debug one specific case based on that value.
We can set a condition by using the context menu (or from the breakpoints window, Ctrl+Alt+B) and enter the condition that should be true for the breakpoint to pause program execution. The condition can be written in C# and has code completion support. Pressing Shift+Enter will popup a window with a larger editor in case the condition is too long for the text area.
When we now debug our program, the debugger will only pause execution at this breakpoint when person.Name.Contains("Maarten").
One thing to keep in mind is that the condition must be valid code in order to be evaluated. This means:
- We can only access variables that are available in the scope of the current breakpoint.
- When a value can be null, it is wise to also add a null check when writing the condition.
Log/evaluate but don’t pause the application
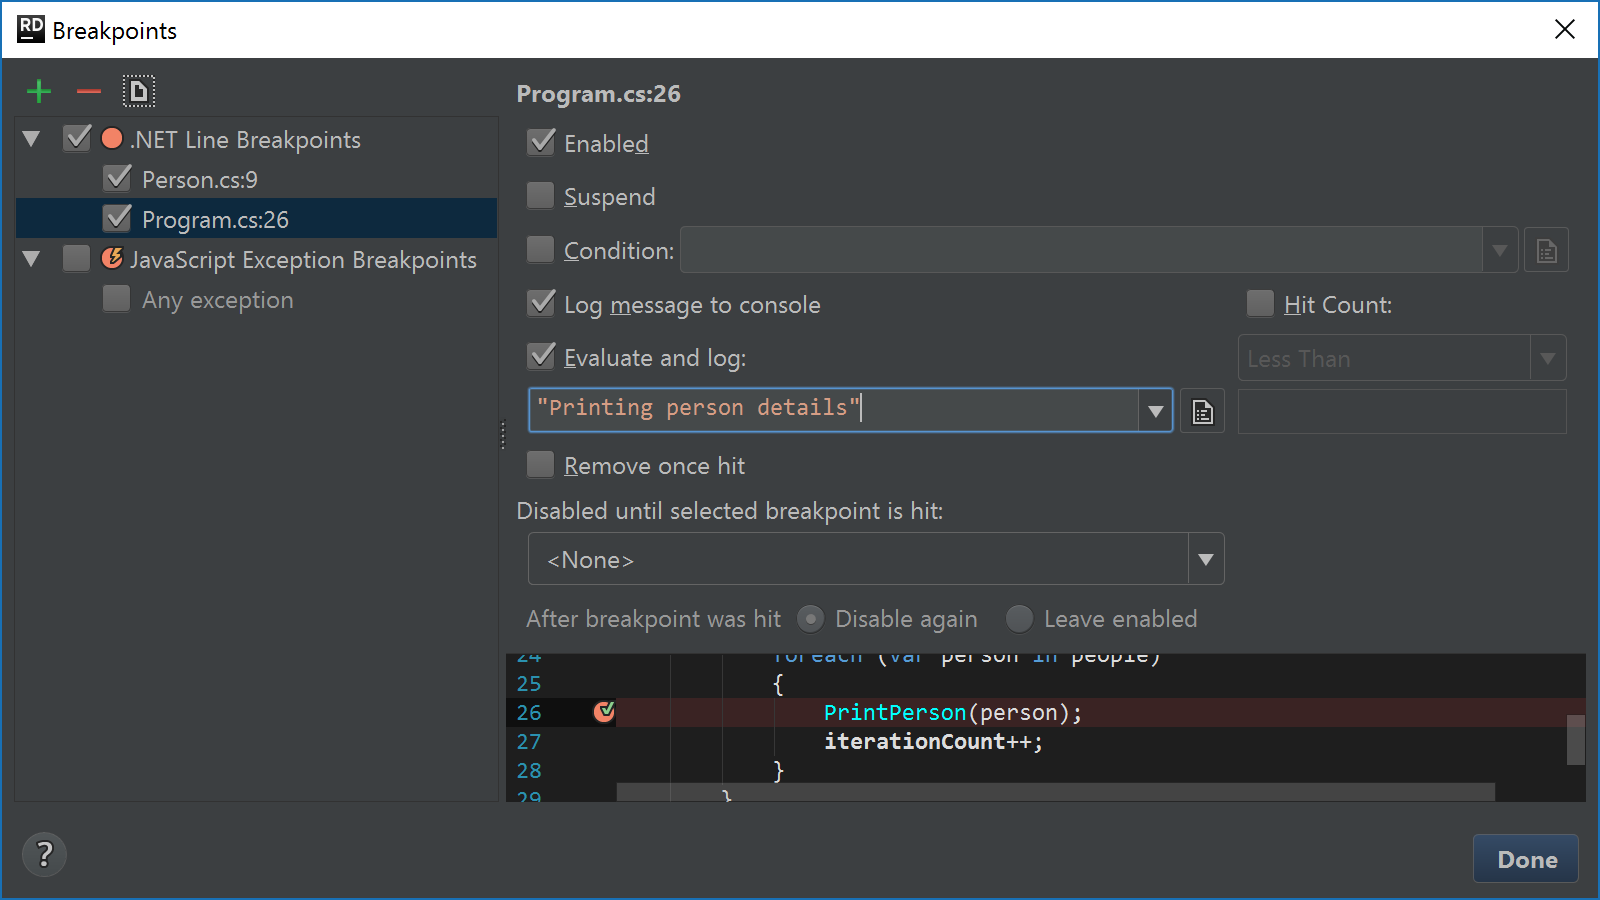
Sometimes we just want to know something happened, without pausing execution. Or we may want to write a log message when a line of code is executed. Rider lets us do such things, easily! From the breakpoints window (Ctrl+Alt+B), we can uncheck Suspend (no pause in program execution) and then enable:
- Log message to console will tell Rider to write some info to the console output when the breakpoint is hit.
- Evaluate and log will do the same, but instead of writing that our breakpoint is hit, an expression can be evaluated and printed to console output.
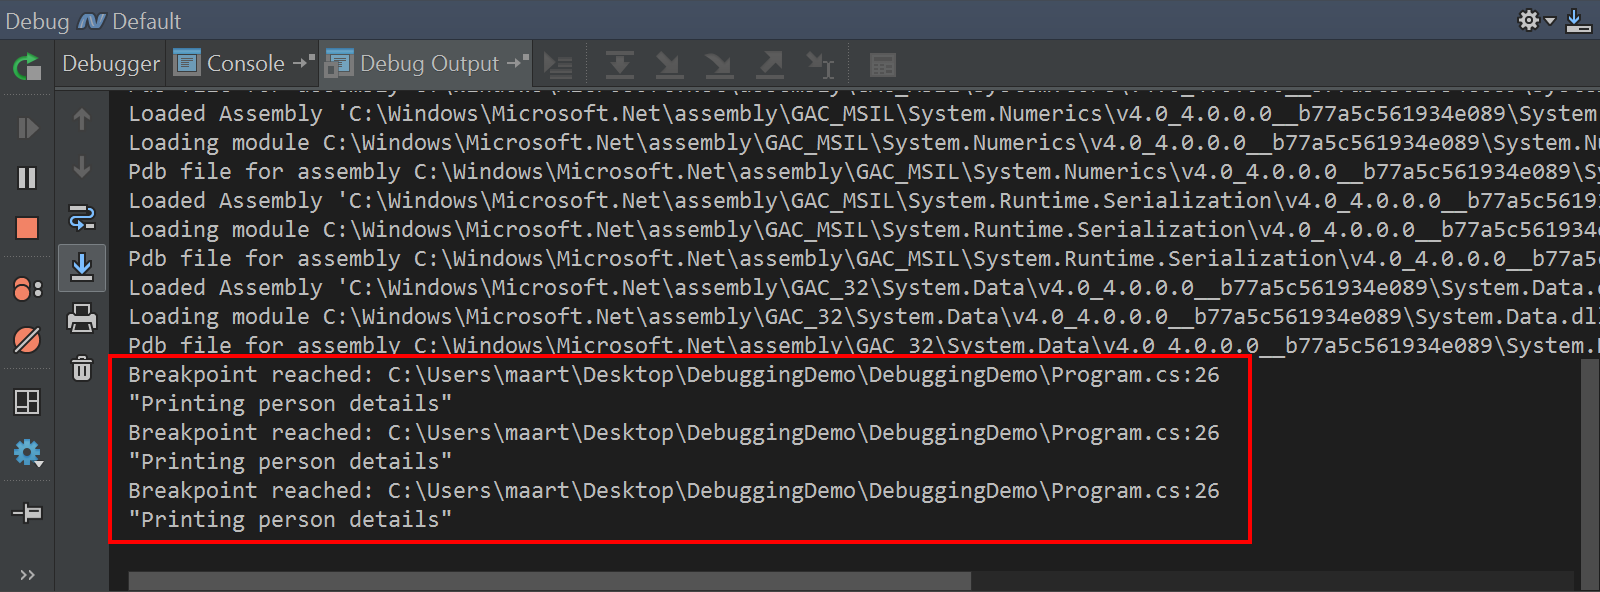
When debugging our application, this breakpoint will now no longer pause program execution but instead log a message to the Debug Output tab:
Wait… Isn’t this just what we can also do with a logger inside our application? It sure is, except that in this case we can enable logging messages on the fly without having to add additional logging in our application code and recompile all the time. This helps us focus on the task at hand (debugging) instead of potential yak shaving to add a logger into the class being investigated.
Hit counters
When working with loops or when iterating over a collection of items coming from the database, it can be useful to only pause program execution the first couple of times, or only after we’ve iterated over more than 1.000 items.
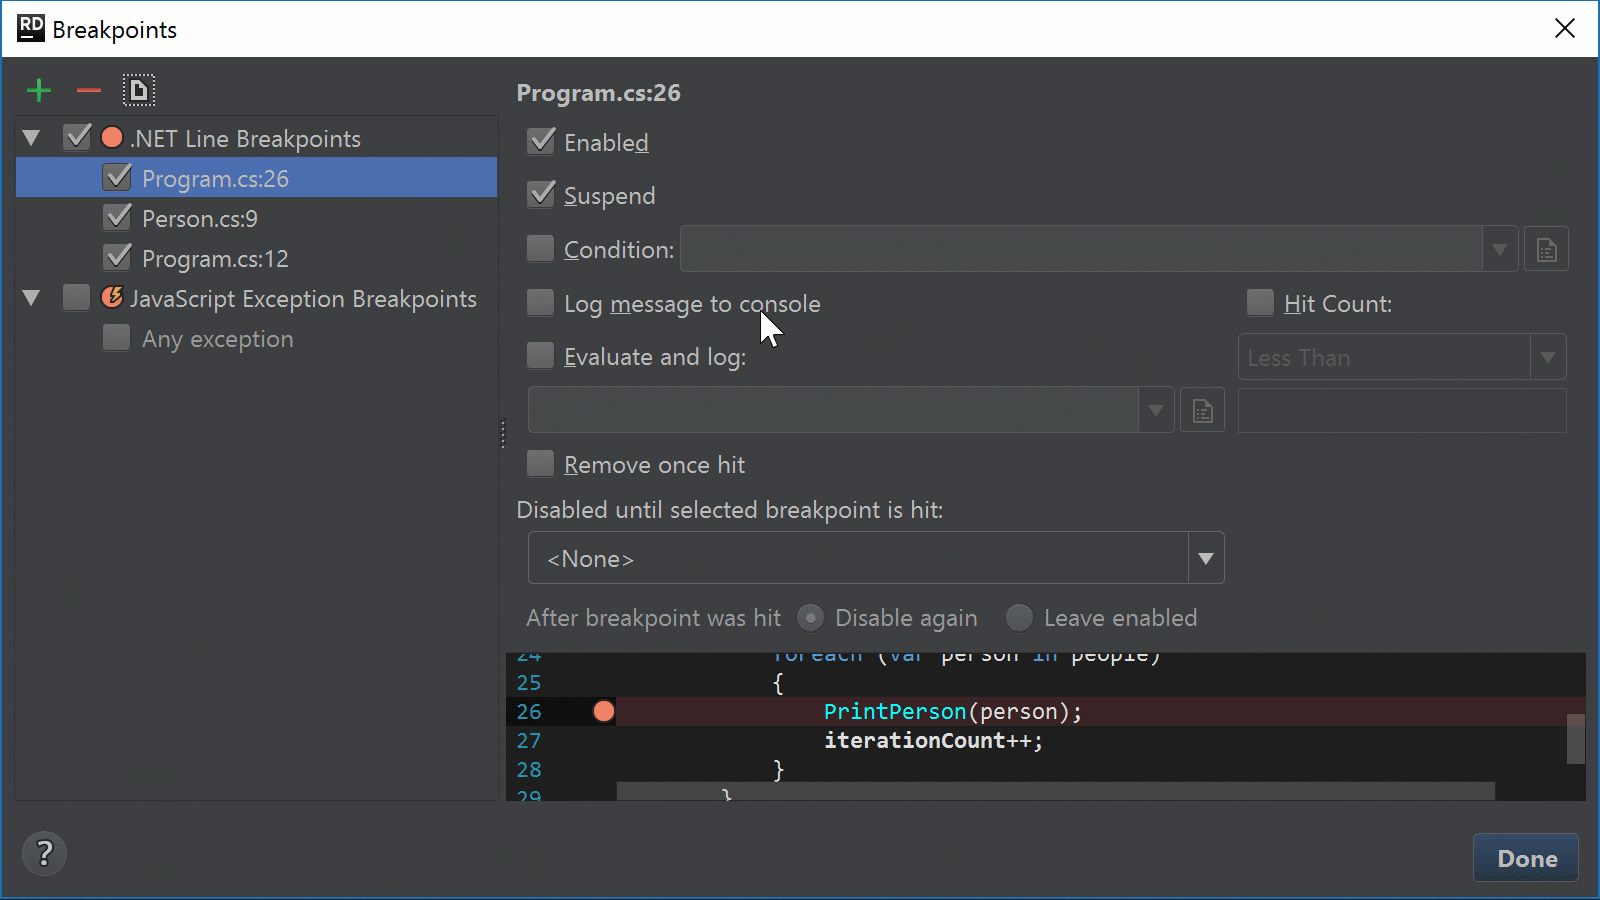
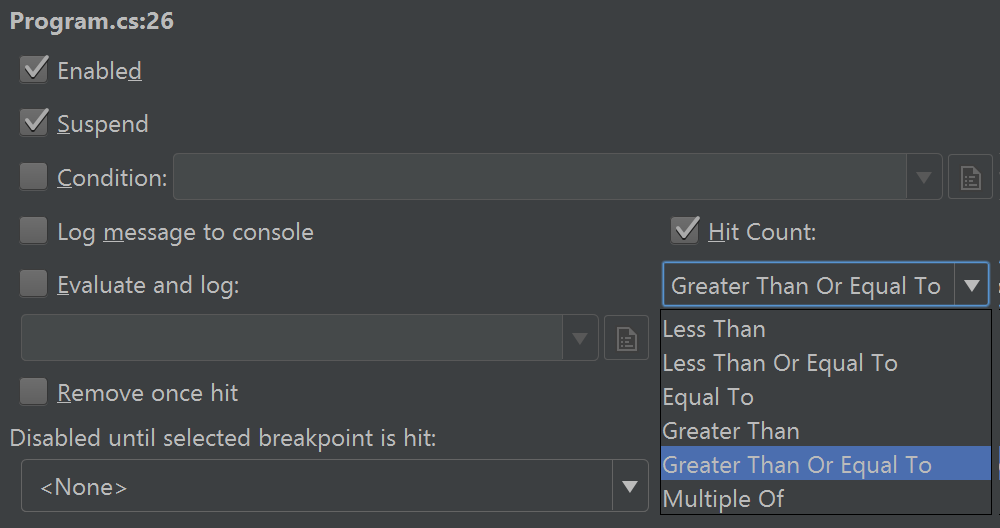
The breakpoints window (Ctrl+Alt+B) lets us configure when our breakpoint should be enabled: when the number of hits is less than, equal to or higher than a given number:
When debugging the application, Rider will keep track of how many times this breakpoint has been hit and based on the hit count configured, it will pause program execution or log to console.
Breaking just once: temporary breakpoints
Sometimes we may want a breakpoint to only be hit once, for example on the first iteration of a loop or the first time some operation is executed. We can do this by enabling Remove once hit in the breakpoints window (Ctrl+Alt+B):
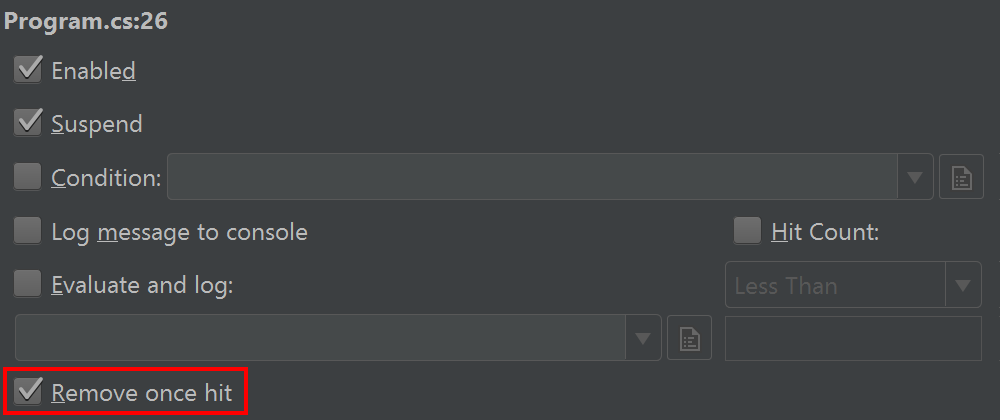
When debugging, Rider will only pause application runtime once for this breakpoint and removes it after it has been hit.
Disable breakpoint until another breakpoint is hit: dependent breakpoints
One of my personal favorite features of Rider’s debugger are dependent breakpoints. We can configure a breakpoint to be disabled until another breakpoint was hit first. There are a number of examples where this could be useful.
Here’s a simple example. When iterating over a collection, we’ve added a conditional breakpoint that checks whether person.Company.Name == "JetBrains". Note that this breakpoint does not pause program execution, but just logs when the condition is true.
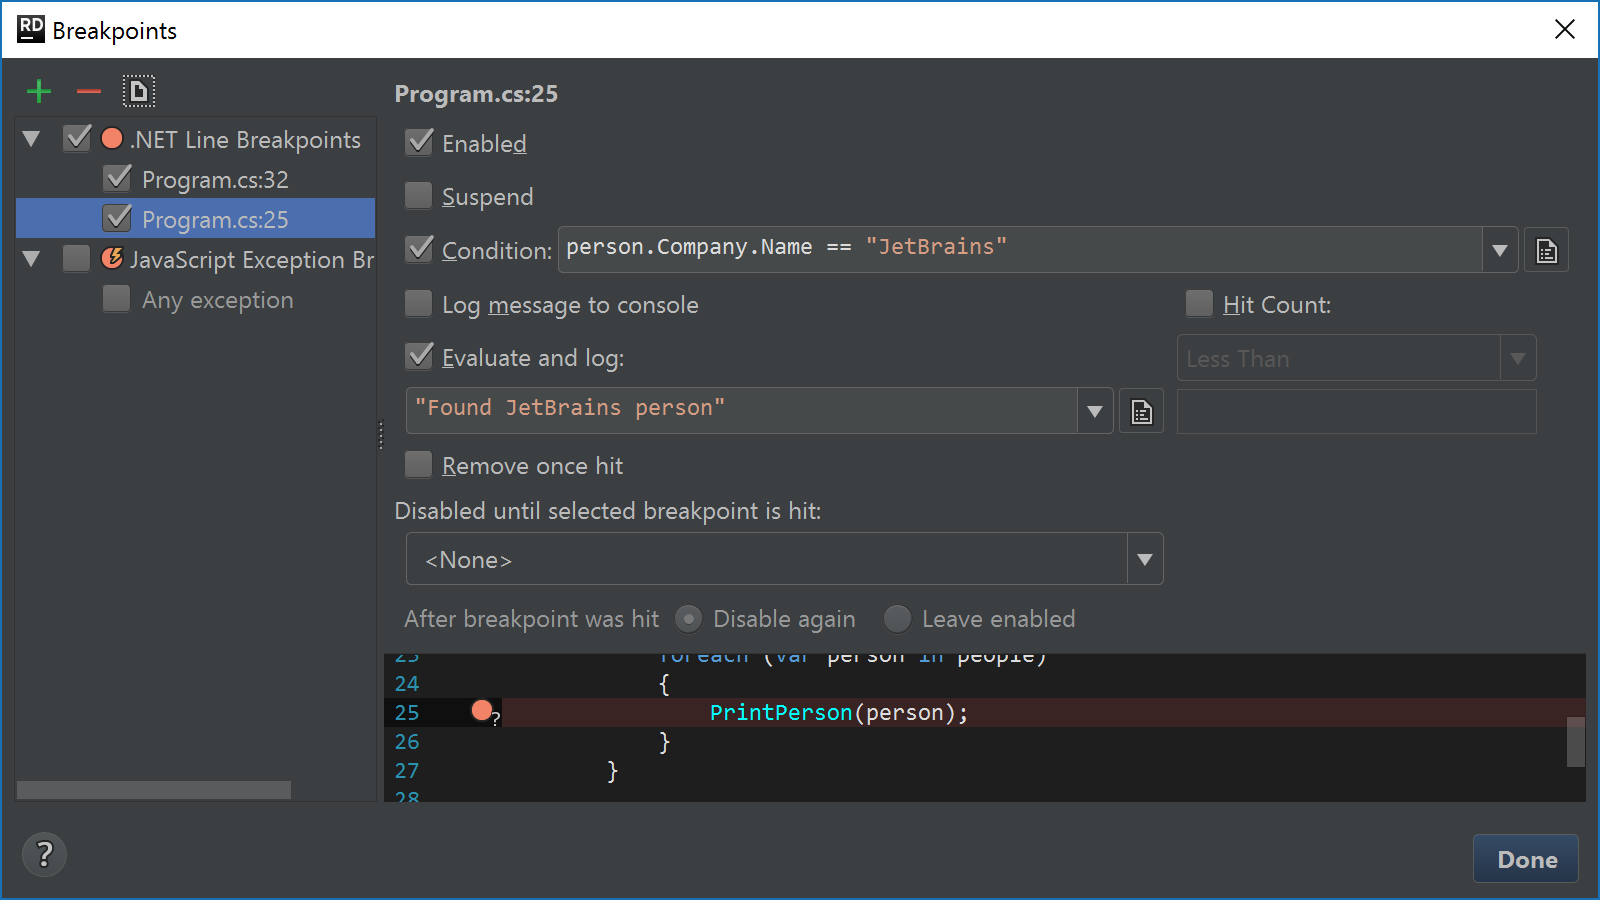
Our second breakpoint depends on this first breakpoint: we are only interested in pausing our application after we’ve encountered the first item in our collection that has the company “JetBrains” specified:
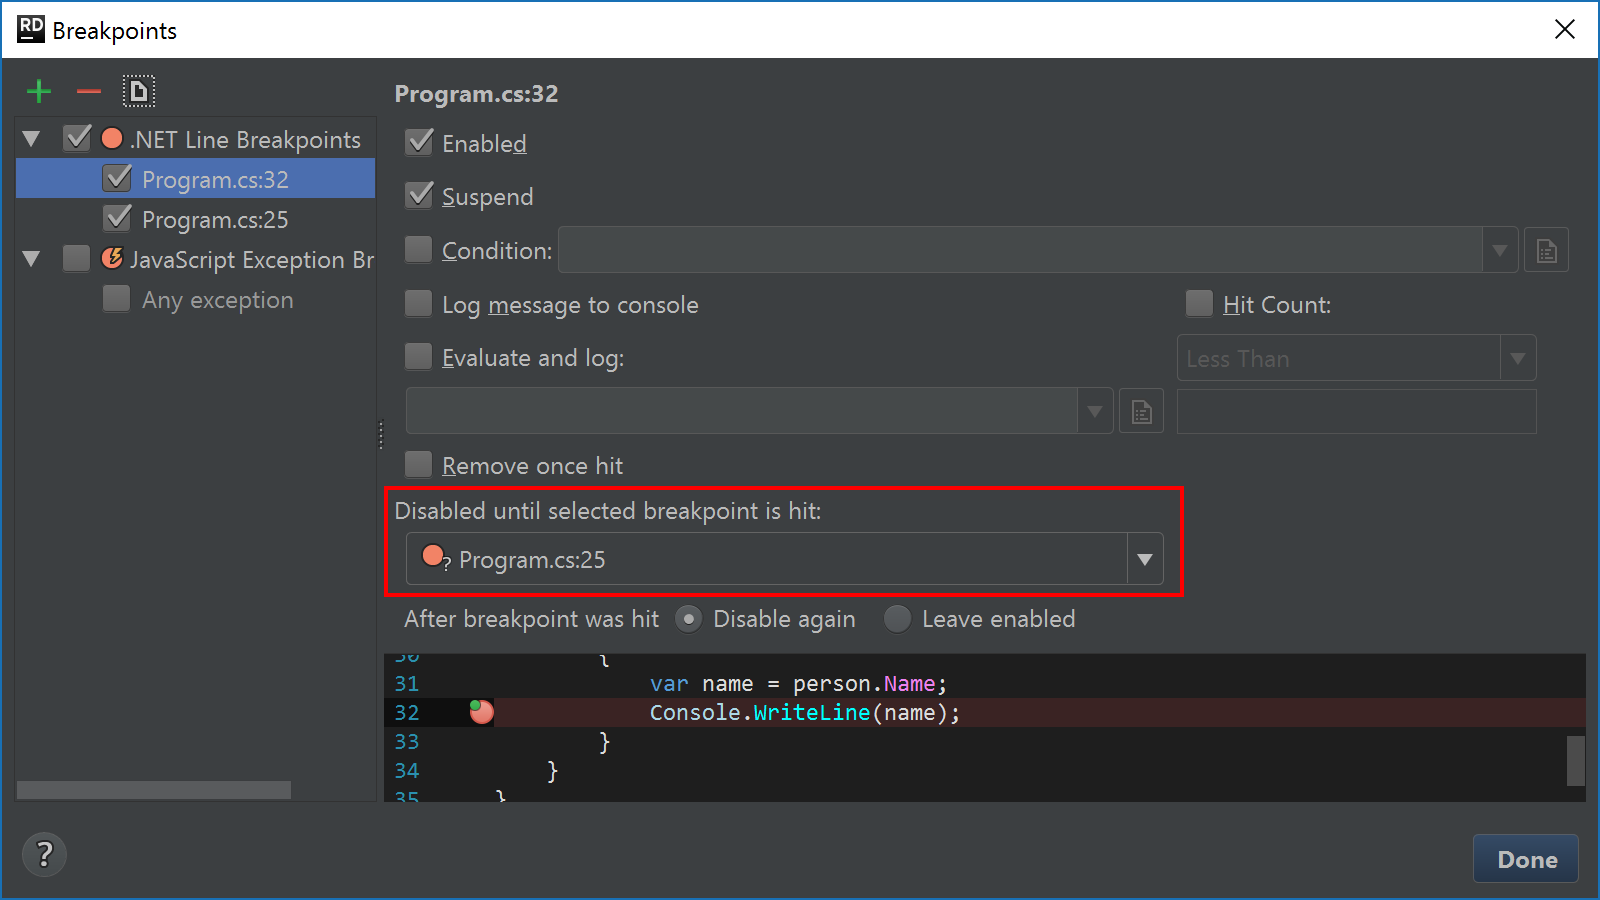
When running our code with the debugger attached, this last breakpoint will be ignored until the moment the first breakpoint is hit – essentially removing the distraction of having to step over or step into with every iteration over our data.
Note that dependent breakpoints can also depend on exception breakpoints, which would mean our breakpoint will only be hit until after a specific exception occurs in code.
Exception breakpoints
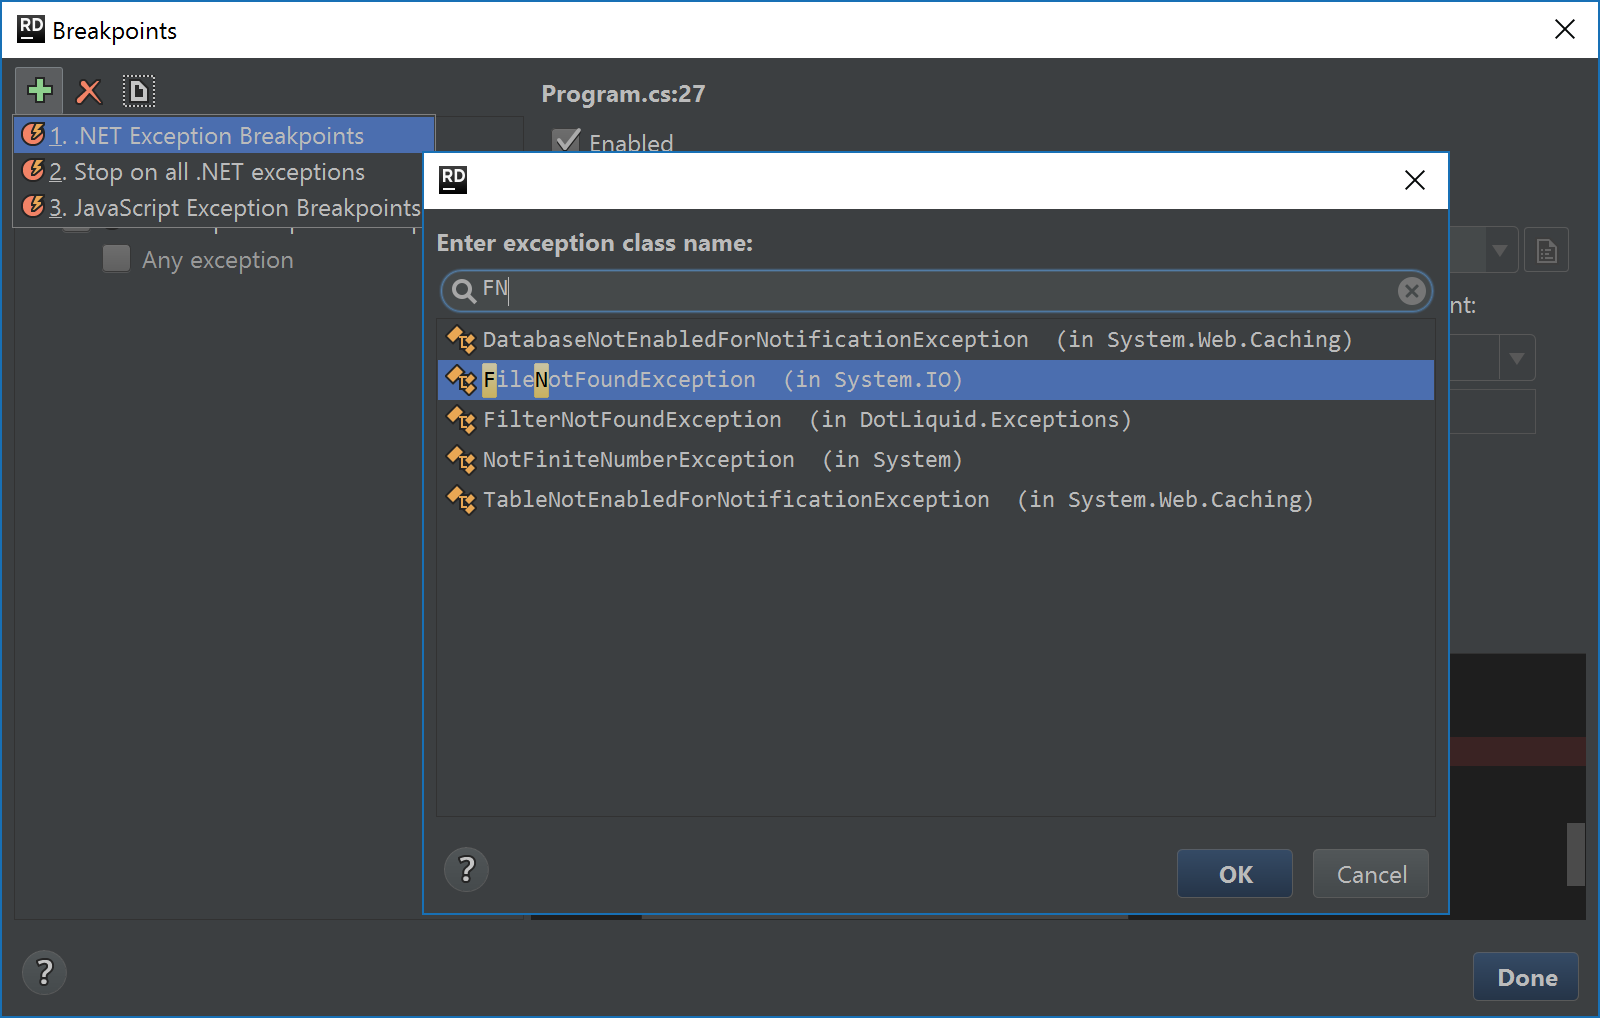
While debugging, it may be interesting to pause program execution when an exception occurs. For example, we may be interested in pausing program execution when a FileNotFoundException is thrown, so we can look at the program’s execution state and investigate which file was attempted and what may have lead to this exception happening in the first place.
Exception breakpoints can be added from the Run | Stop on Exception… menu, or from the breakpoints window (Ctrl+Alt+B) toolbar. We’ll have to specify the type of exception we want to set a breakpoint on, or instead Stop on all .NET Exceptions.
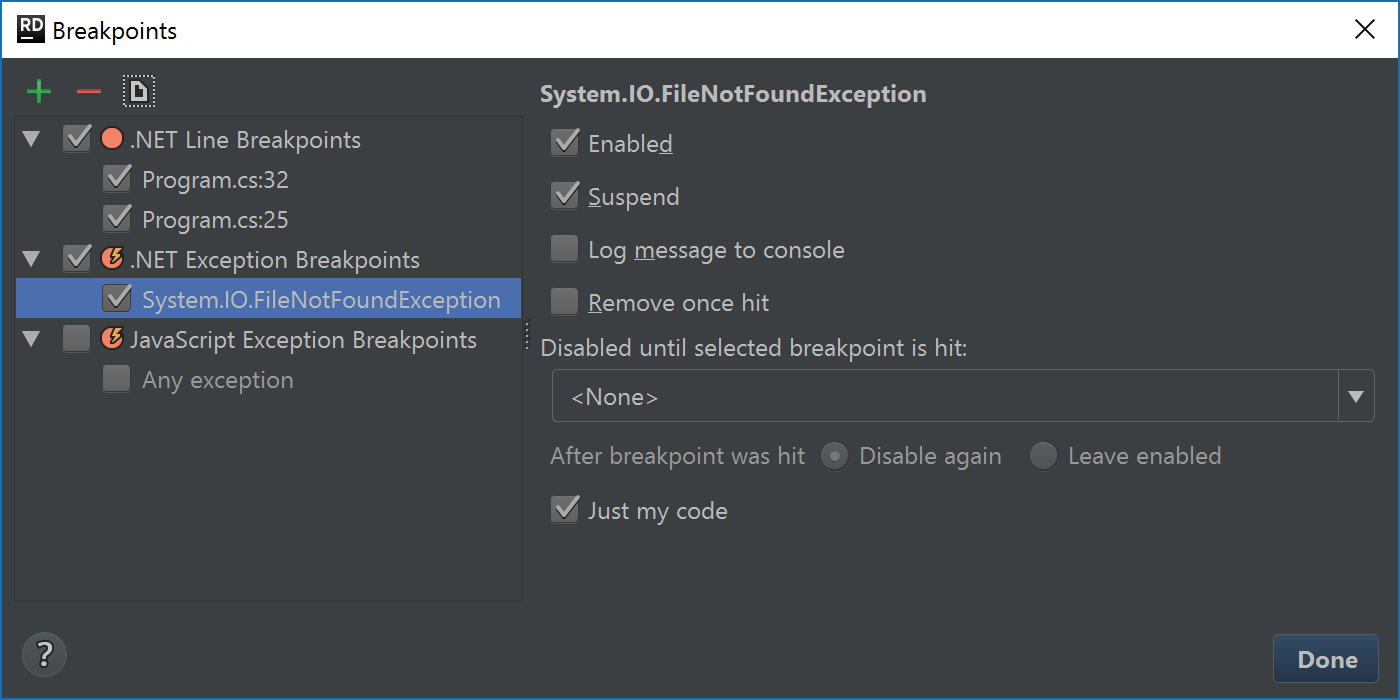
Exception breakpoints, too, allow us to configure other options. We can enable/disable the breakpoint when needed, choose to suspend program execution (or not), log to console, and make it a temporary or a dependent breakpoint. We can also toggle “Just my code”.
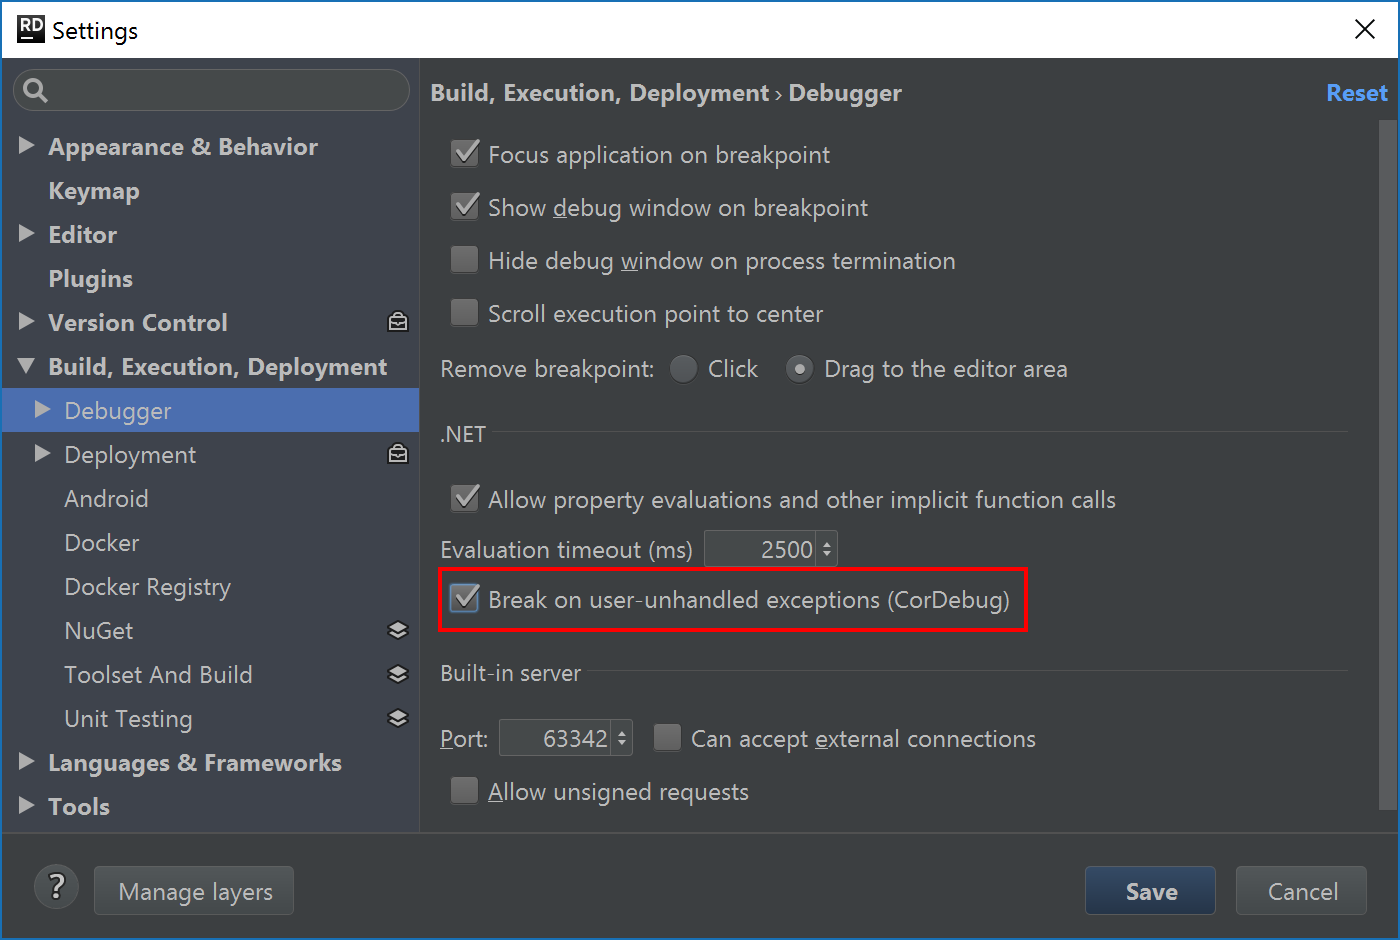
While exception breakpoints are useful for inspecting our application for known exception types, we may also be interested in pausing our application when an unhandled exception occurs. We can enable this option from Rider’s settings (Ctrl+Alt+S), under Build, Execution, Deployment | Debugger.
Preventing accidental removal of a breakpoint
When in debug mode, it may happen that we accidentally click a breakpoint. When intended, that’s fine. When not intended, that could be an issue as removing a breakpoint also means its settings (like conditions, hit counters, …) are removed.
Rider has an option to prevent accidental removal of a breakpoint, available from the settings under Build, Execution, Deployment | Debugger, where we can set Remove breakpoint to Drag to the editor area:
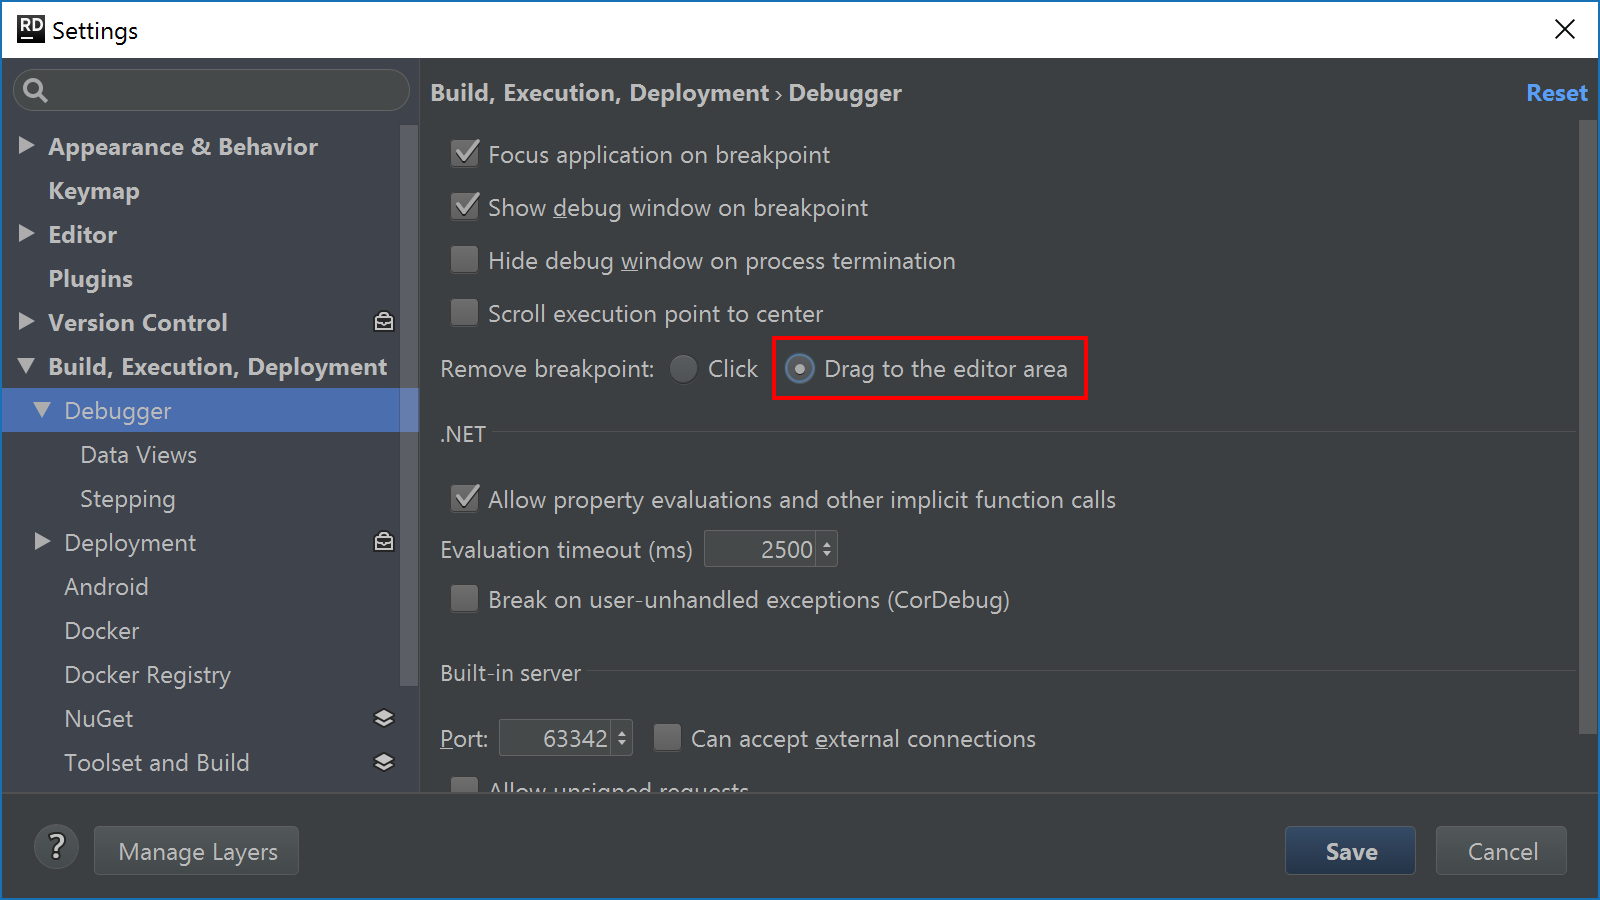
When that one is enabled, all that will happen when we accidentally click a breakpoint is that it gets disabled instead of removed. This makes sure we can’t accidentally remove a breakpoint and lose its parameters such as a condition. Still want to remove the breakpoint using the mouse? Simply drag it to the editor.
In this post, we’ve looked at the different types of breakpoints:
- Line breakpoints, which pause program execution at a specific line of code in our application.
- Conditional breakpoints, which pause program execution only if a certain condition is true.
- Exception breakpoints, which pause program execution whenever a specific exception occurs.
By combining these with hit counters, temporary breakpoints and dependent breakpoints, Rider helps us debug our application code more efficiently and reduces the time required to debug a certain application state!
Download JetBrains Rider and give it a try! We’re looking forward to hearing your feedback.

Subscribe to a monthly digest curated from the .NET Tools blog: