.NET Tools
Essential productivity kit for .NET and game developers
Roslyn analyzer support in Rider 2018.1 EAP
 While writing code, Rider performs code analysis and helps us spot any errors, problems or potential improvements. With over 2.400 code inspections that come from ReSharper and WebStorm, Rider helps us improve code quality in every language it supports (C#, VB.NET, F#, HTML, JavaScript TypeScript, CSS, …).
The latest Rider 2018.1 EAP build goes one step further and adds Roslyn analyzer support as a new (experimental) feature! Let’s see!
Why Roslyn support in Rider?
Many open source projects as well as development teams are writing their own analyzers to provide additional tooling for the frameworks they build. For example the xUnit.net folks have a set of Roslyn-based analyzers that help with things like making sure Fact methods do not have parameters – often combined with a code fix as well.
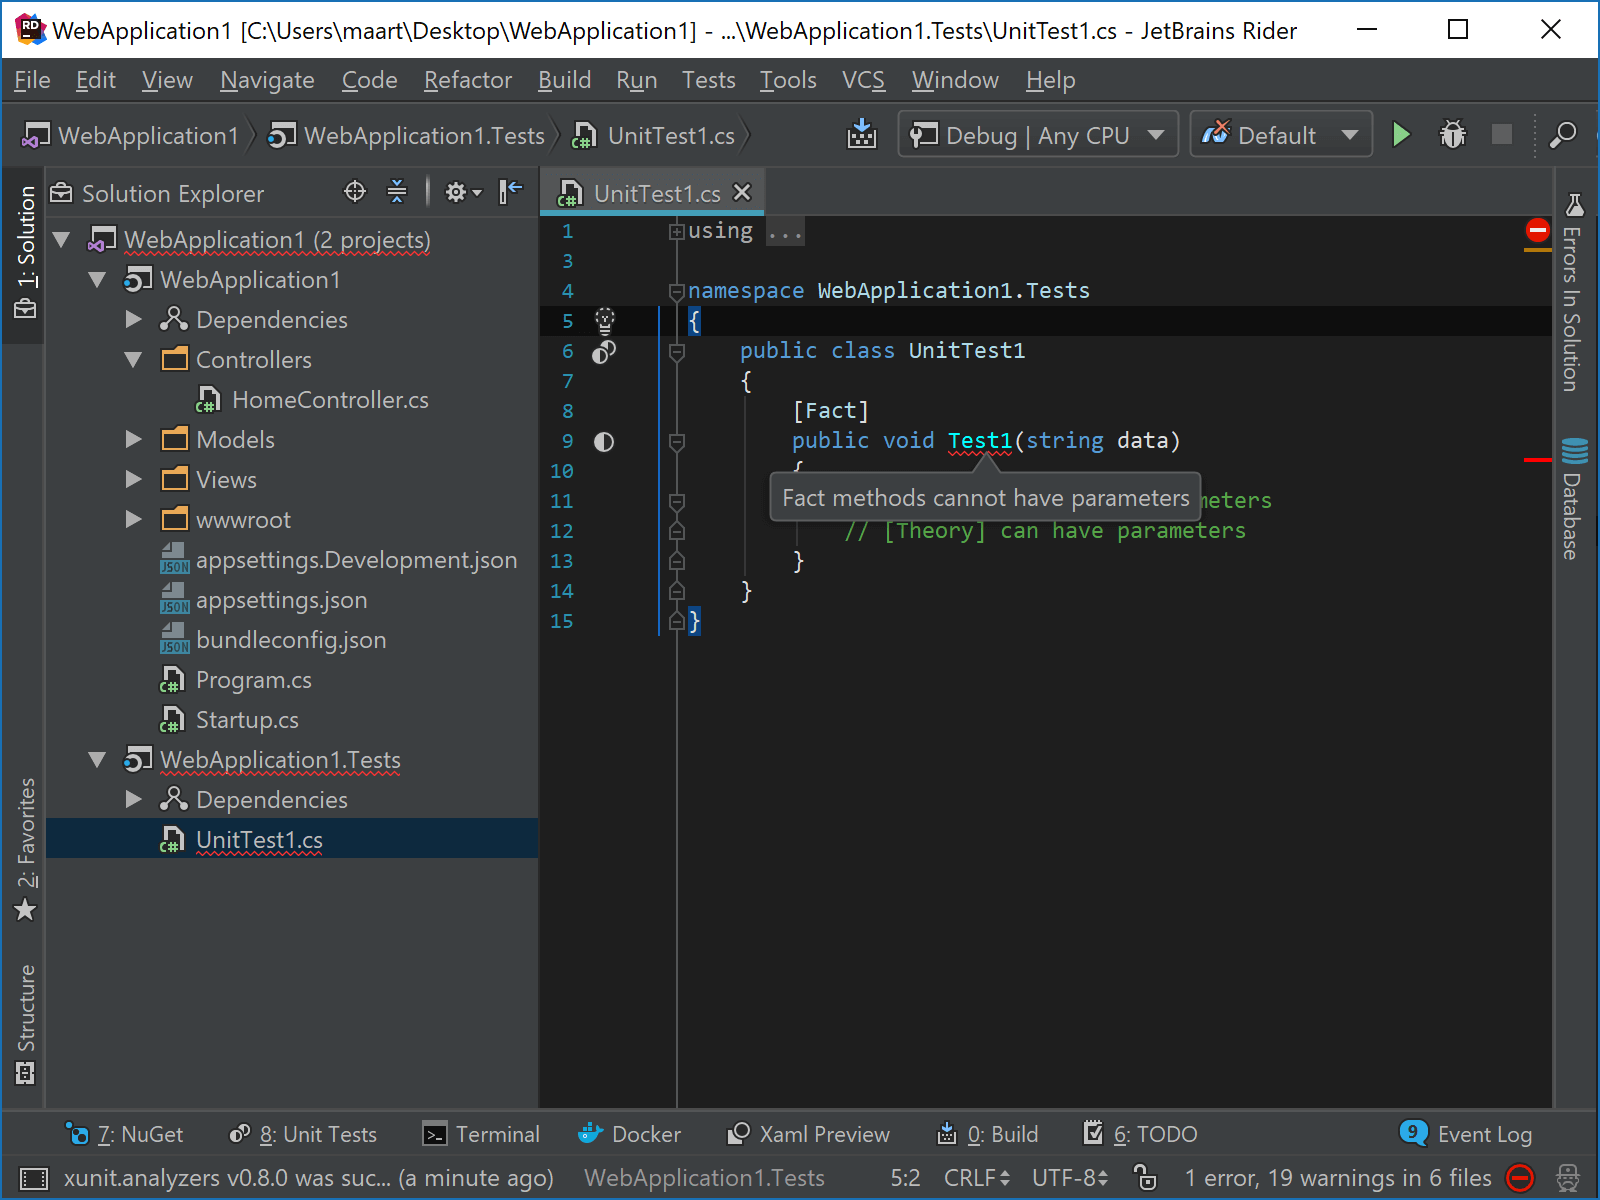
By adding Roslyn support to Rider, developers now get the best of all worlds! Not only will you get the 2.400+ inspections and quick fixes from ReSharper and WebStorm, you can now get community fixes from Roslyn analyzers!
Enabling Roslyn analyzers in Rider
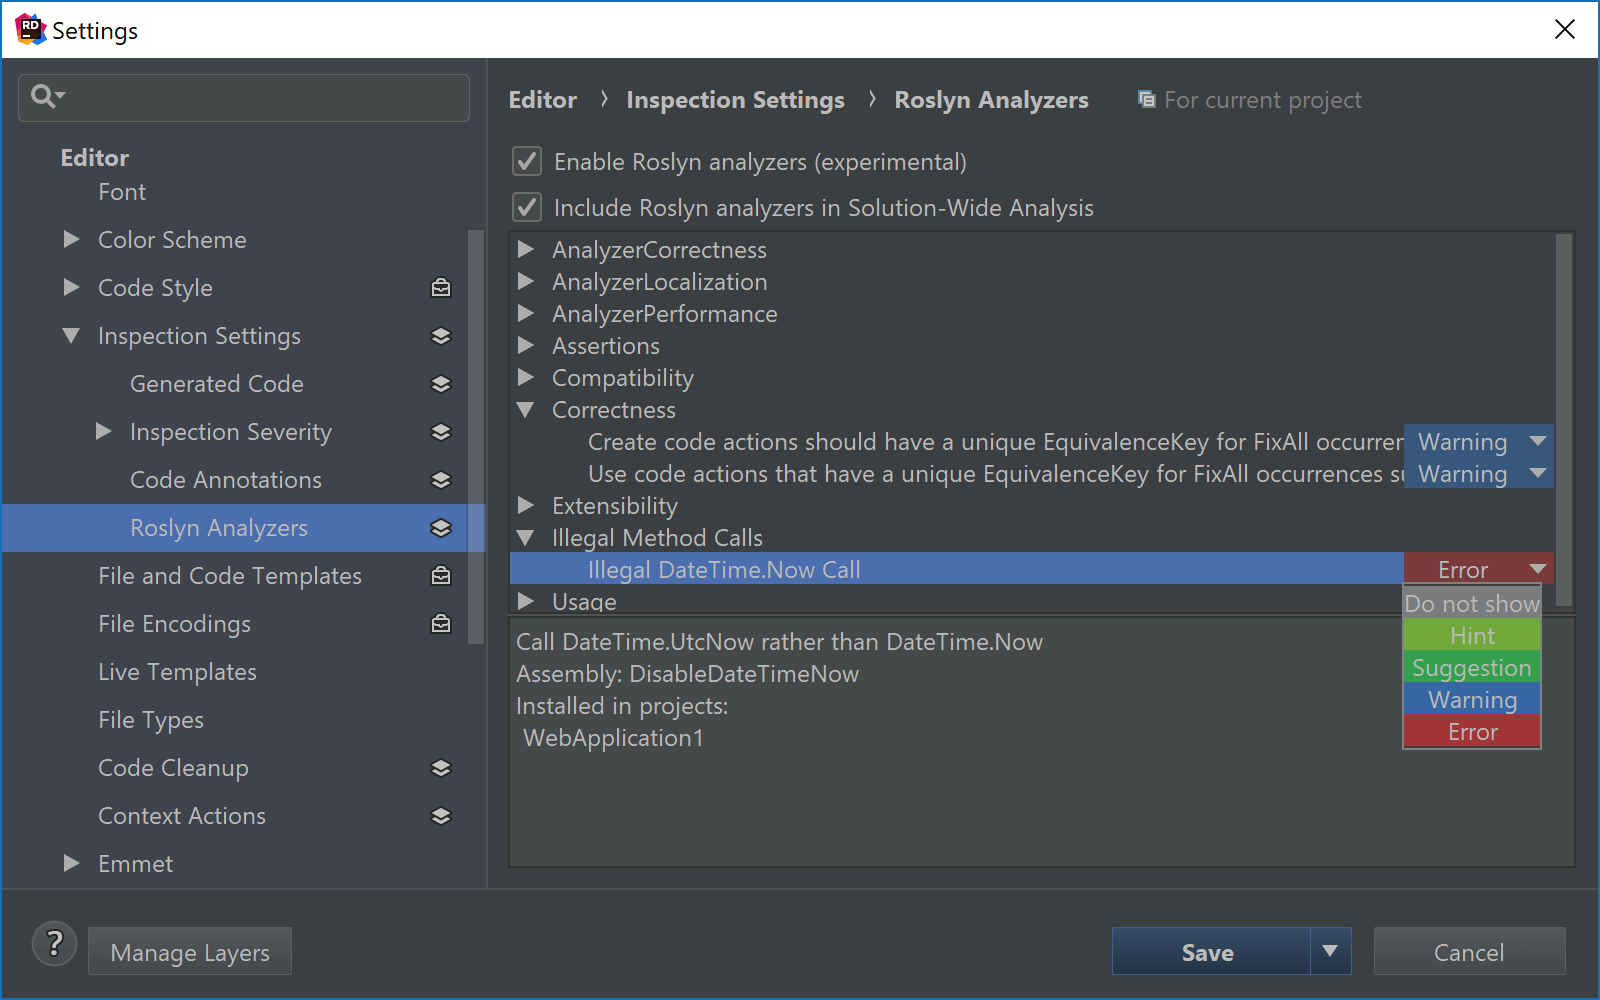
Roslyn analyzer support is disabled by default. We can enable it in the settings under Editor | Inspection Settings | Roslyn Analyzers.
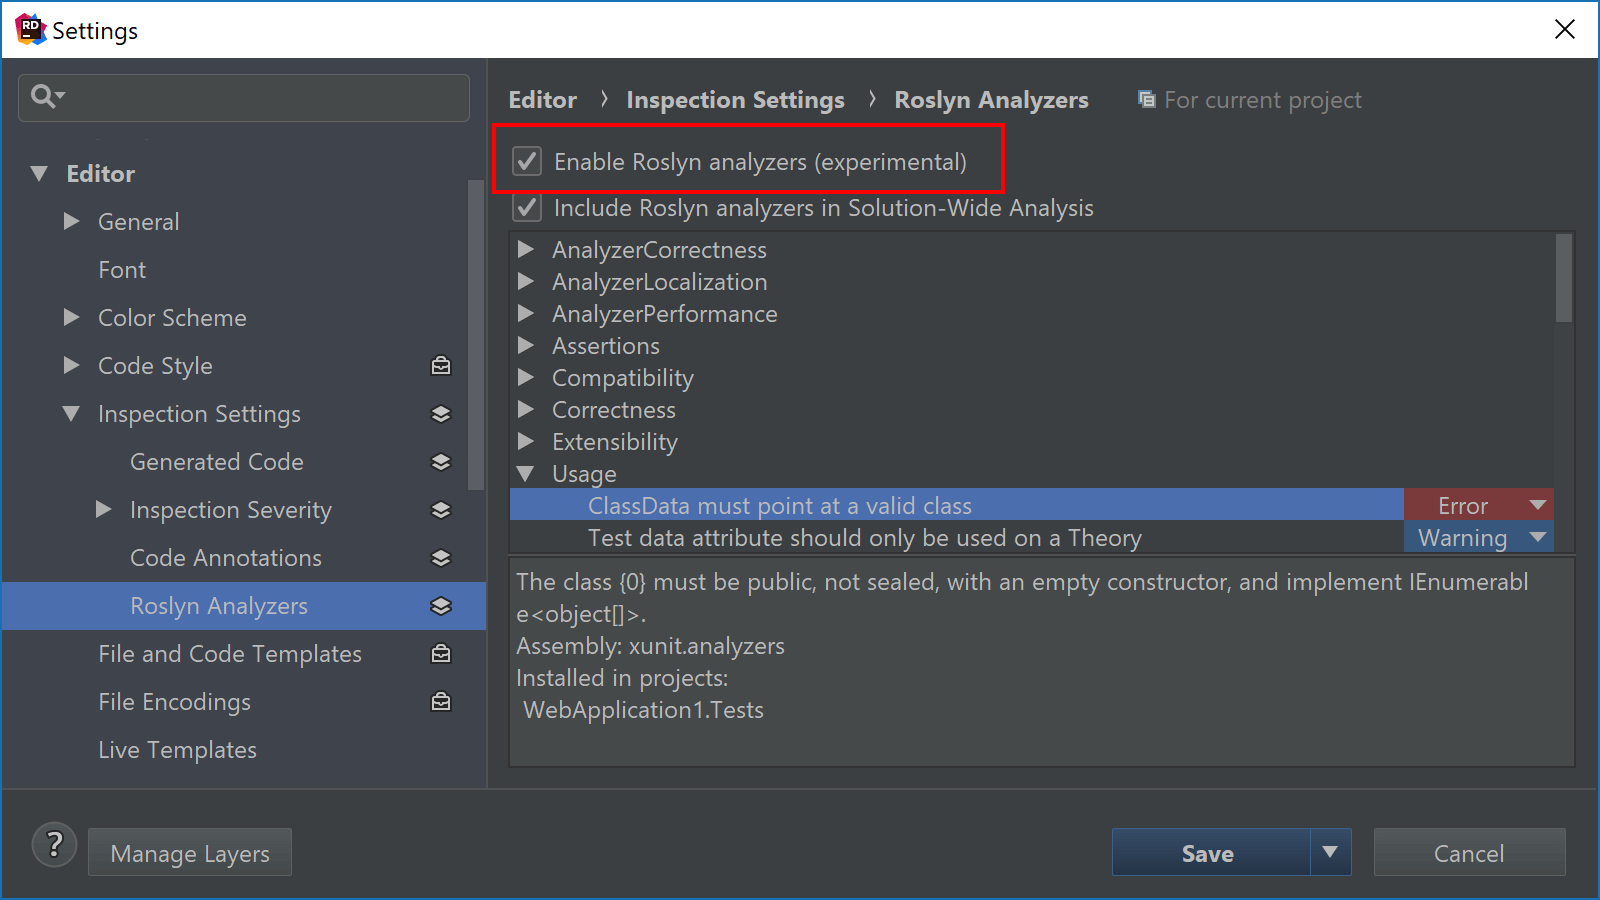
Once enabled and settings are saved, Rider will scan for installed Roslyn analyzers.
Installing and using Roslyn analyzers
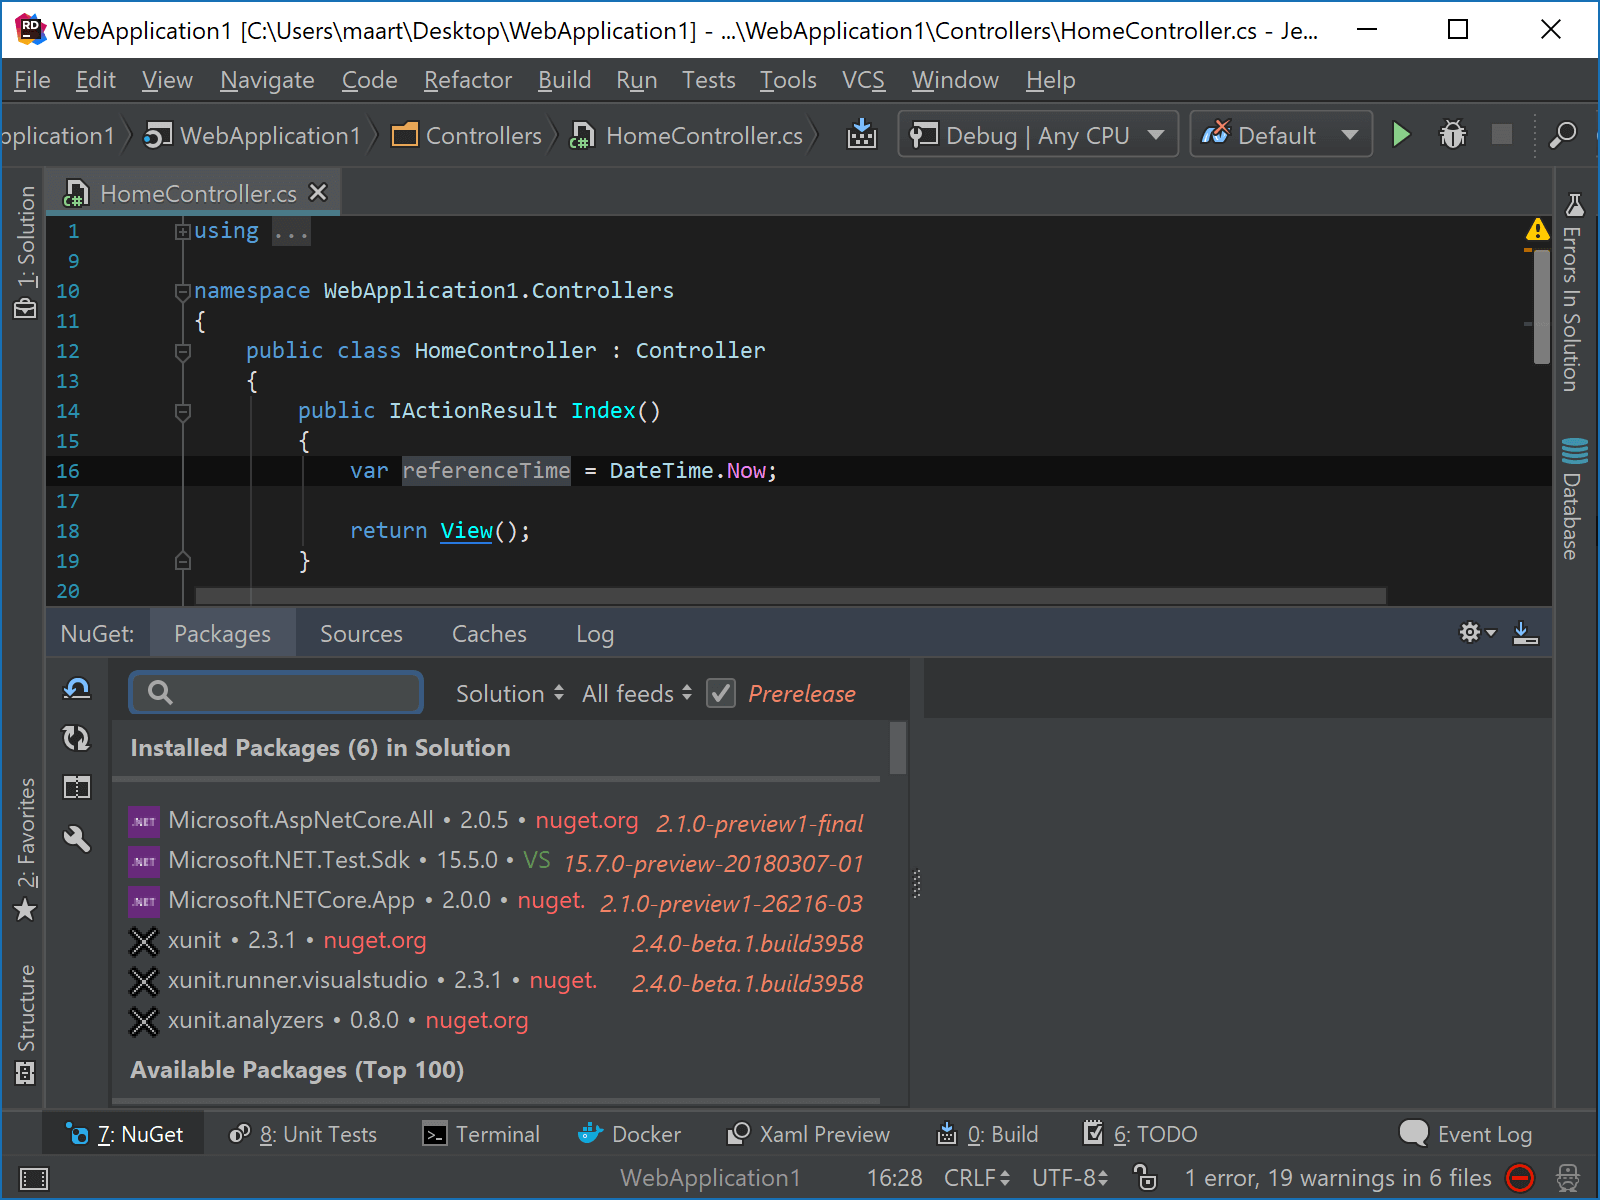
Many Roslyn analyzers ship as NuGet packages, which means we can use Rider’s NuGet client to search for analyzers. Right now, installing analyzers via NuGet only works on .NET Core. Referencing analyzers in our .csproj using <Analyzer Include="path\to\analyzers.dll"> is supported for all frameworks and project types.
In a .NET Core web application, let’s install the DisableDateTimeNow analyzer, a simple analyzer which checks for usage of DateTime.Now and will suggest using DateTime.UtcNow instead.
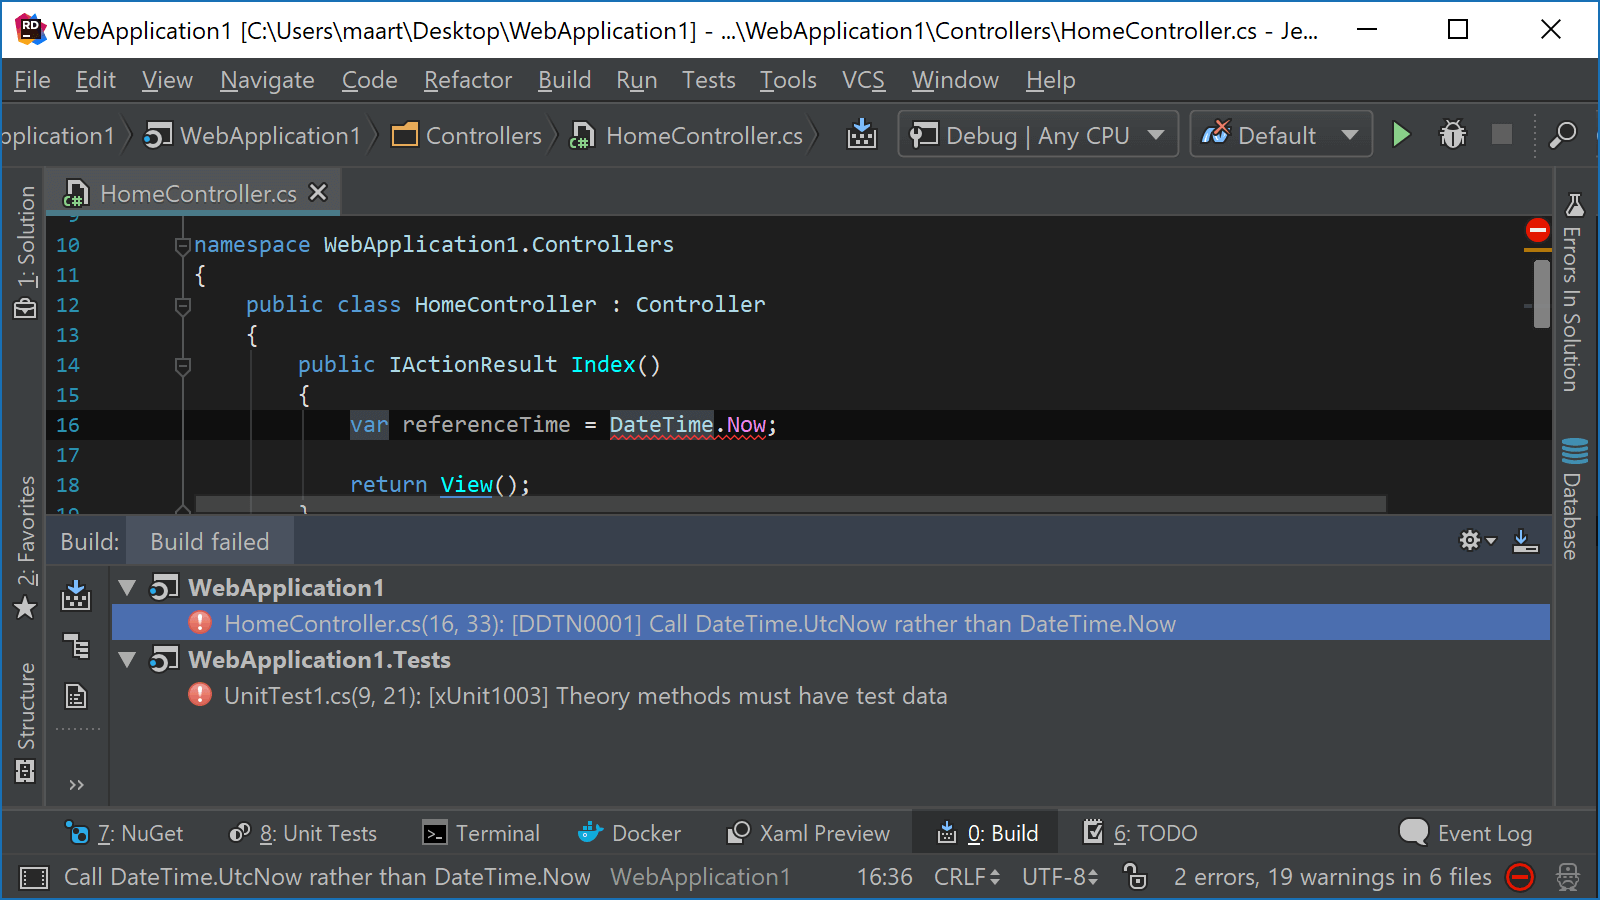
After installation, Rider runs the analyzer on our code. It displays a hint, suggestion, warning or error in the editor. The “light bulb” in the left gutter is displayed when our cursor is on the code issue, and shows a Roslyn logo to differentiate between Rider’s own code analysis and code analysis provided by a custom analyzer. Using Alt+Enter, we can invoke the corresponding fix.
Analyzers may also run as part of the build in Rider. If an analyzer has a default severity of warning or error, it will show in the build output as such.
Configuring analyzer severity
Hints and suggestions will show as light “squiggles” in our code, while for warnings and errors we will see clear yellow and red colors. For every analysis, we can configure its severity from the Alt+Enter popup.

Severity can also be configured in Rider’s settings, under Editor | Inspection Settings | Roslyn Analyzers. The full list of referenced Roslyn analyzers is displayed here, making it easier to change severity multiple analyzers at once.
Solution-Wide Analysis
Like with any other code issue, Rider lets us find similar issues in the current file, project or solution and will run Roslyn analyzers for that scope.

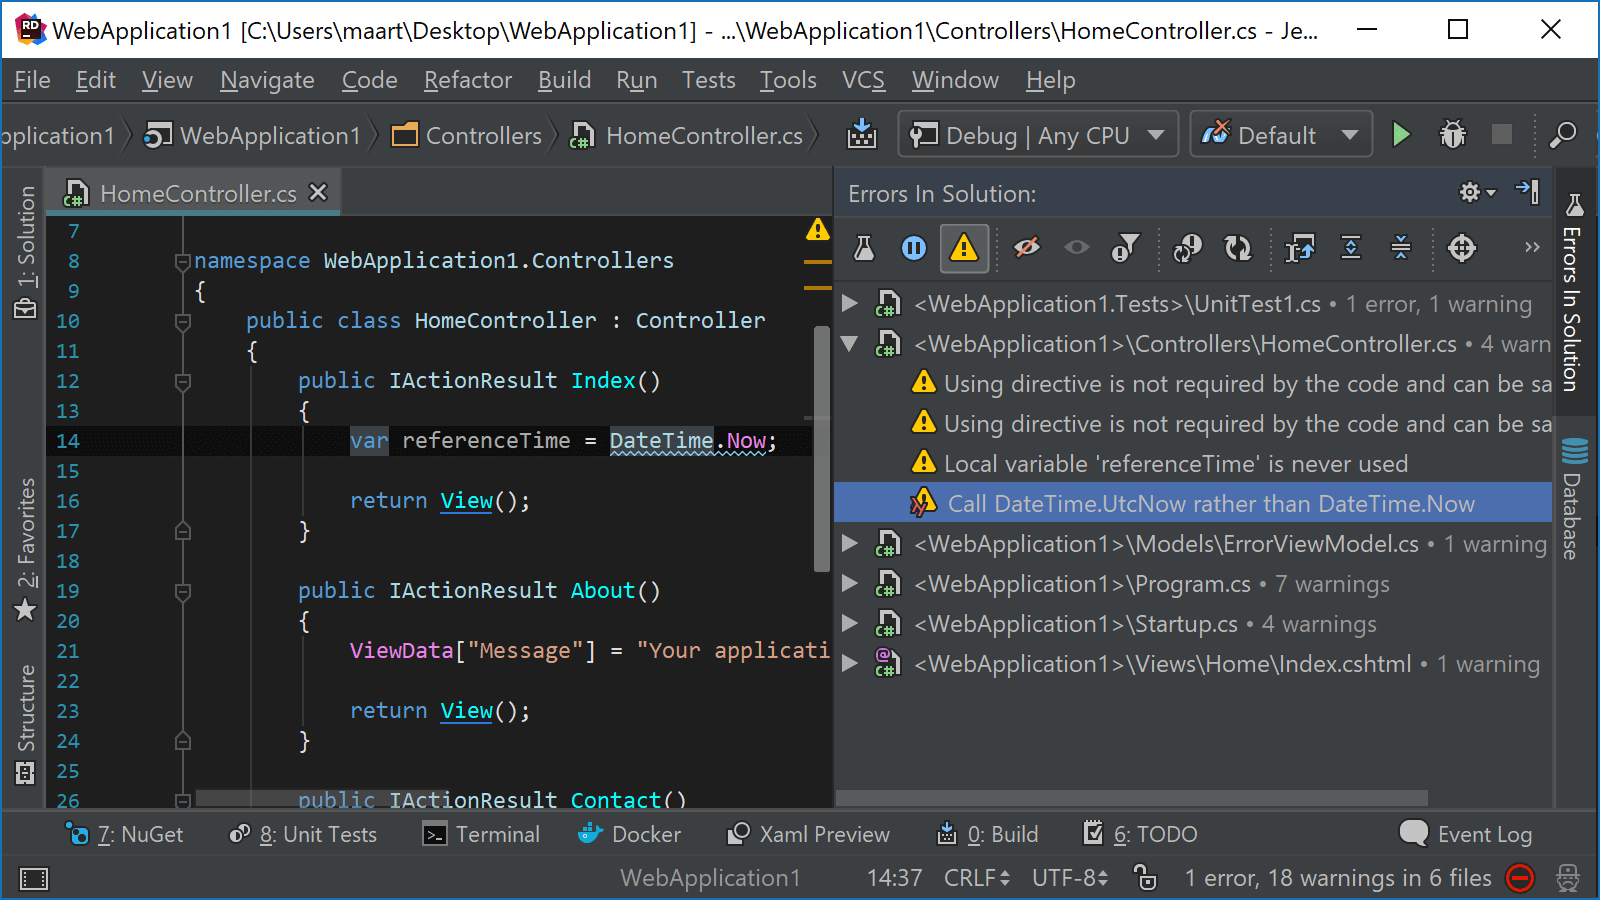
We can also include Roslyn analyzers in Solution-Wide Analysis (enable/disable it from the settings). When opening the Errors in Solution tool window, we can inspect code analysis results powered by Rider as well as those coming from Roslyn. Note I enabled “Show Warnings” here as well.
Current limitations
Roslyn analyzer support in Rider is still experimental and there are a number of things we’re still working on.
If you encounter any issues while using Roslyn analyzers in Rider, please open an issue in our tracker.
Give the latest Rider 2018.1 EAP build a try! We’d love to hear your feedback!


