

.NET Tools
Essential productivity kit for .NET and game developers
View Unity console logs directly in Rider 2018.1

Last time, we looked at how Rider 2018.1 introduces a new Unity editor plugin which allows us to build deeper integration with Unity. We saw how we can now control play mode and step single frames without having to switch away from Rider.
In this series:
- Control Unity editor play mode from within Rider
- View Unity console logs directly in Rider
- Run Unity tests directly from Rider
- Unity Explorer and new code inspections
In this post, we’ll take a look at another new feature that will also help reduce the amount of time you spend switching between the Unity editor and Rider – the new Unity log viewer.
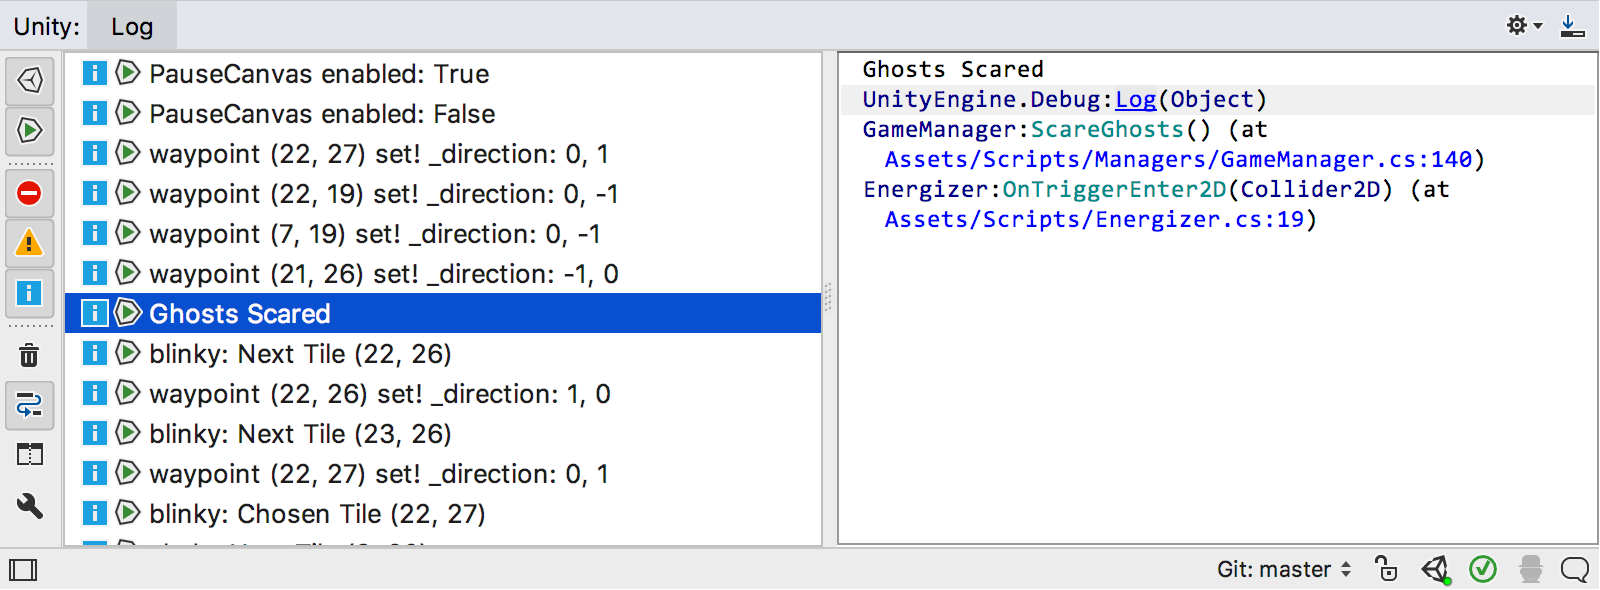
This tool window, which is only available when we are connected to the Unity editor, brings Unity’s Console window right into Rider. It will be updated as events are logged in Unity, and allows filtering based on category (error, warning or message). You can also show and hide events based on when they were logged – in play mode, or edit mode.
Stack trace explorer
Of course, Rider likes to go the extra mile. You might be used to log entries being a plain block of text in Unity, but Rider makes them interactive, and allows you to navigate to any source file, class, method or property mentioned in the log entry.
Rider parses each message in the same way it does for the Stack Trace Explorer feature. Paths and line numbers are converted into hyperlinks, and clicking takes you straight to the line.
Even better, class, method and property names are also converted into hyperlinks, and clicking these navigates to the appropriate place in source code. And if you don’t have the source for that particular class, don’t worry – Rider will decompile it on the fly for you.
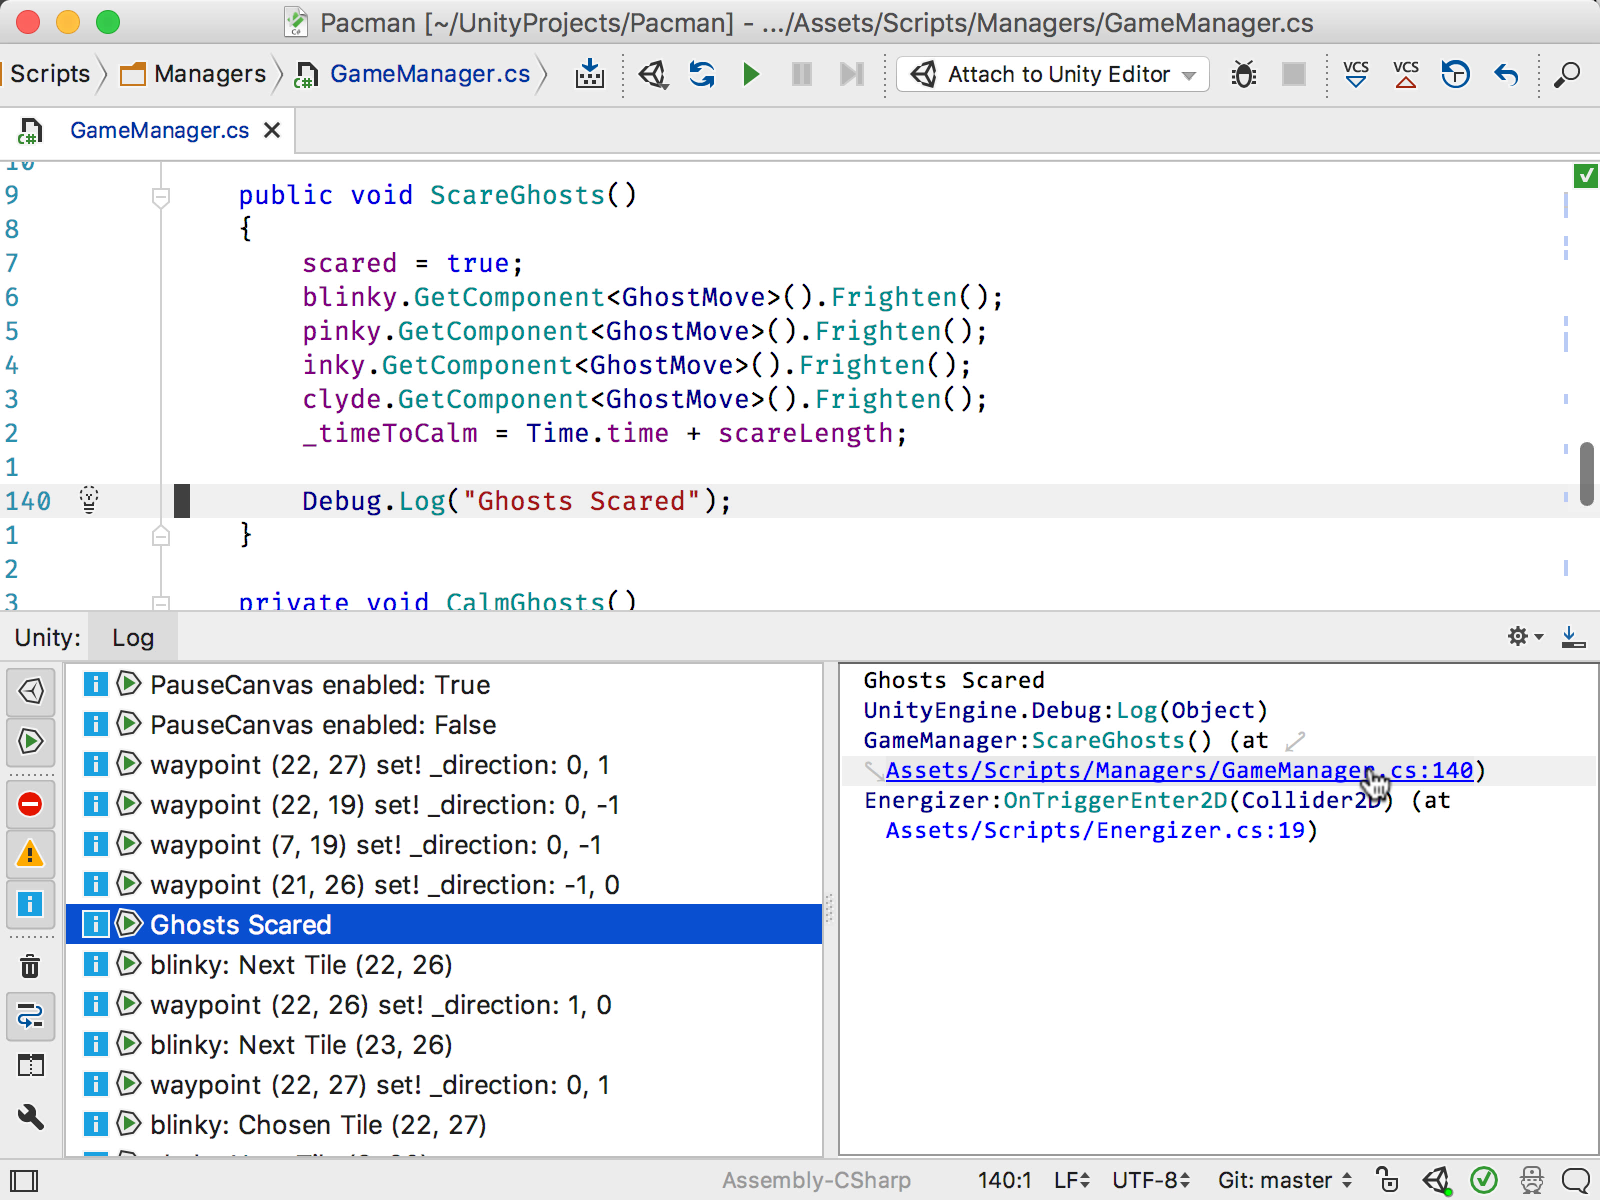
Switch to play mode, collect logs and finally, easily navigate to the code mentioned in logs, all without leaving Rider.
Next time, we’ll look at the new unit test runner integration. Stay tuned for more!
Download Rider today, and give the new Unity editor integration a go! Let us know how you get on – leave comments here, or raise an issue in YouTrack or on GitHub.


