

.NET Tools
Essential productivity kit for .NET and game developers
Unity Explorer and new code inspections in Rider 2018.1

Mea culpa! In all the excitement of recent weeks, not the least of which was presenting Rider at Unity’s Unite events in Seoul, Tokyo and Beijing (and we hope to see some of you at Unite Berlin next week!) we forgot to finish off our series of posts about new Unity features in Rider 2018.1. Let’s have one last post to round things off before we get started with Rider 2018.2!
You might remember that we’ve previously posted about the new features we have in Rider 2018.1 that integrate directly with the Unity editor:
- Control Unity editor play mode from within Rider
- View Unity console logs directly in Rider
- Run Unity tests directly from Rider
- Unity Explorer and new code inspections
In this post, we’ll take a look at our new Unity Explorer, and see what’s new for code analysis.
Unity Explorer
Rider 2018.1 adds an alternative project view to the traditional Solution Explorer, so you now have the choice between viewing your Unity project in the standard Visual Studio solution and projects view, or as a more familiar, unified view, like the Projects view in the Unity editor.
This view is very much like a file system view, showing all of the files and folders that are in the Assets folder, rather than just the subset that are specified in the project files. But you’ll notice that we’ve added a few extra features to try to make this even view more useful.
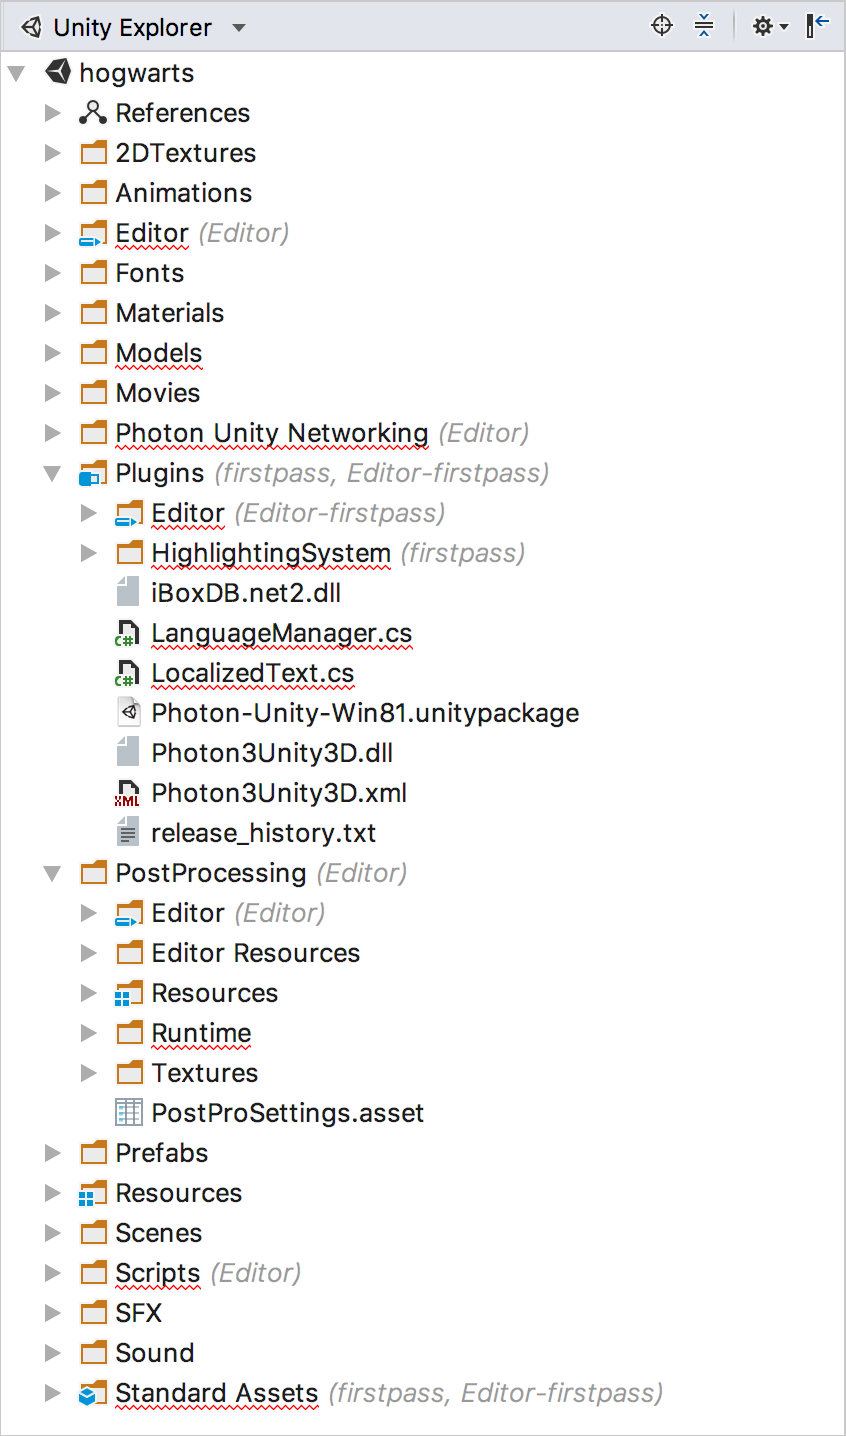
Firstly, Unity’s many special folders are highlighted with icons, so you’ll easily be able to spot Editor folders, as well as Plugins, Resources, Standard Assets and so on. We’ve also added a References node, which provides a single place to list all of the references used across all projects.
One of the downsides of working with a file system view is knowing which C# project a file or folder is associated with, and this isn’t helped by Unity’s special folders. To make things easier, we also show project names next to the folder names. And because some of the special folders might be nested several layers deep, we “bubble” the folder names up.
So when you see a folder with a project name next to it, it means that either that folder, or one of its child folders belong to that project. We don’t display anything for the main project, only the first pass, editor and editor first pass projects, as well any projects created with assembly definition files.
And of course, the normal context menus and keyboard shortcuts that you already know from Solution Explorer work with the Unity Explorer, too, so you can create new files or directories, rename, clean code, show properties and more, just like in Solution Explorer. And if there are any errors in a file, we’ll highlight the file name, and parent directories with a red squiggly.
The Unity Explorer is the default view for new Unity projects, but previously opened projects might still be on Solution Explorer (as Rider will remember the last selected project view). To change between the different views, simply use the drop down selector in the title bar of the tool window.

Code Analysis
One of Rider’s most powerful features is its code analysis, finding issues in your code as-you-type, and providing Alt+Enter quick fixes and context actions. Rider 2018.1 added some fixes and new features here for Unity, too.
We’ve updated the known Unity API to support Unity 2018.1, and added a number of new Unity event messages to Rider’s code generation and as-you-type auto completion (see #365, #394, #395 and RIDER-12649).
Rider 2018.1 includes a number of fixes, too, such as colour highlighting in .shader files not working in all cultures. This was also a contribution from the community – thanks Zod-!
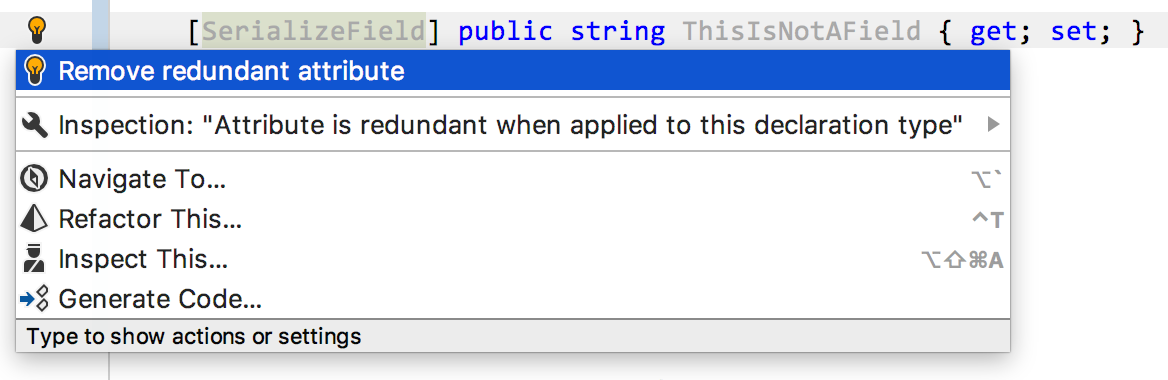
Another fix was to mark attributes applied to the wrong target as redundant. A number of Unity’s attributes don’t specify valid targets, so they can be applied to anything. A common mistake that can take ages to spot, is to apply [SerializeField] to a property. Rider will now flag attributes like this as redundant, greying them out, and provide an Alt+Enter quick fix to quickly remove the field. This is a change in behaviour from the last release, which marked the attribute usage as an error, even though the code compiled fine (see #322, #325 and #376).
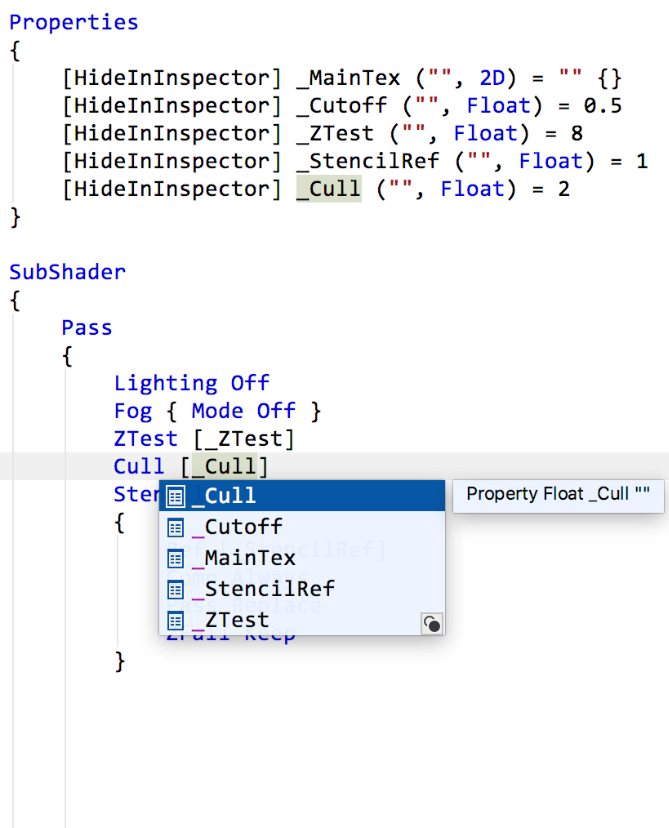
We’re slowly improving on our ShaderLab support, teaching Rider about variable references, so we can now go to definition, show code completion, and find and highlight usages when using variable references inside ShaderLab commands.
Another very cool feature we’ve added in 2018.1 is another community contribution, again from Zod- (thanks again!) and it tackles a very tricky situation in the Unity world, related to how Unity handles null comparisons, and the difference between MissingReferenceException and UnassignedReferenceException.
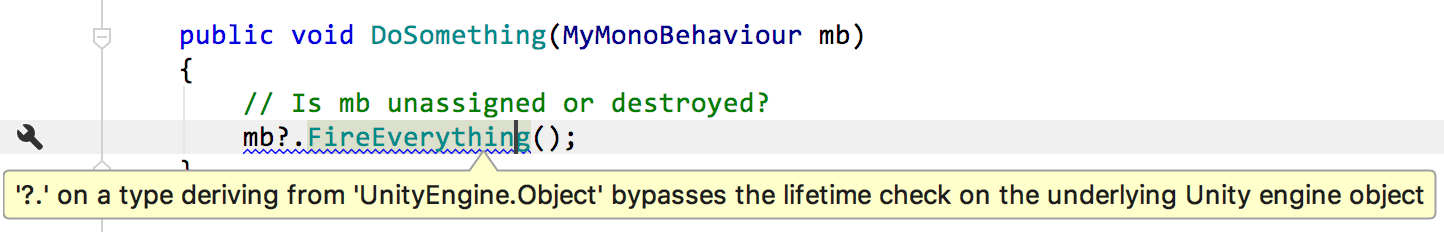
A Unity Object based C# class is essentially a wrapper around a native game object, and both objects have different lifetimes. This means it’s possible to have a C# object whose underlying game object has been destroyed. Unity allows comparing to null to see if this object has been destroyed.
But more recent C# features, such as null coalescing (??) and conditional access (?.) bypass these null checks, and this can introduce bugs where the lifetime check was assumed.
This change adds warnings for using null coalescing or conditional access with Unity Object based types. Rider will encourage you to be explicit, and prefer an actual null check rather than rely on implicit actions.
Much more details, including background and suggested fixes can be found in the new code wiki page on GitHub.
Which is a very nice segue to our final feature for today – “Why is Rider suggesting this?”.
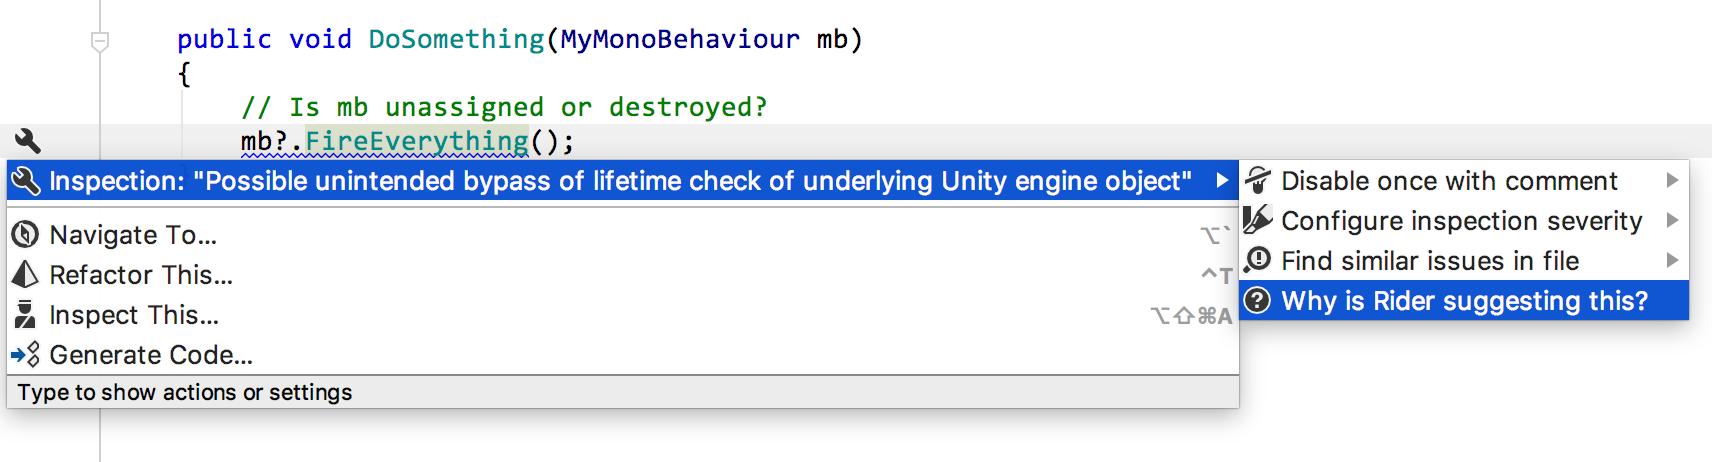
Many of Rider’s and ReSharper’s built in inspections offer this menu item in the Alt+Enter menu, and it will open a browser with a help page that explains why the code has been highlighted, what the issue is and what you can do to fix it (see this page on the “implicitly captured closure” warning as an example).
Rider 2018.1 brings this feature to the Unity inspections, too. We’ve added some details on the Unity project’s GitHub wiki page, and linked the documentation pages to the warnings inside Rider itself. So if you’re ever confused as to why Rider is suggesting there is an issue in your code, make sure to checkout the “Why is Rider suggesting this?” menu item.
And that wraps up our coverage of the changes in Rider 2018.1. Of course, most of these features are also available for ReSharper 2018.1, so you can still get great code inspections inside Visual Studio with ReSharper. Find them via the ReSharper | Extension Manager menu and install the Unity plugin.
We’re currently busy adding new Unity features into Rider 2018.2 – keep your eyes peeled for updates coming soon. In the meantime, download Rider 2018.1.2 today!


