.NET Tools
Essential productivity kit for .NET and game developers
Unity Performance Best Practices with Rider, Part 1

At JetBrains, we’re big fans of static analysis. Rider has over 1,200 inspections designed to warn about potential issues, or suggest changes, nearly all with quick-fixes to address the problem. Some are about consistency, such as naming standards and code style. Others warn about redundant, unused, or unnecessary code, or help you write terser, more modern code, making use of new language features. And of course, Rider will warn you about code quality issues, such as potential null-reference exceptions or other runtime issues like infinite loops.
Rider even has some Unity specific inspections and quick-fixes – such as warning about ambiguous usage of the ?? and ?. operators on Unity objects, incorrect method signatures for Unity’s magic methods, and so on.
But wouldn’t it be nice if Rider could help with the one thing that all Unity developers care about – performance? Surprise! Of course it can!
We can split Rider’s performance guidance into two categories, and we’ll explore them in two separate posts. Next time, we’ll look at the more traditional inspection – highlighting an issue such as redundant event functions as a warning, and providing a mechanical fix.
But in this post, we’re going to take a look at a feature introduced in Rider 2018.3, performance indicators, and the performance-critical context.
What is it?
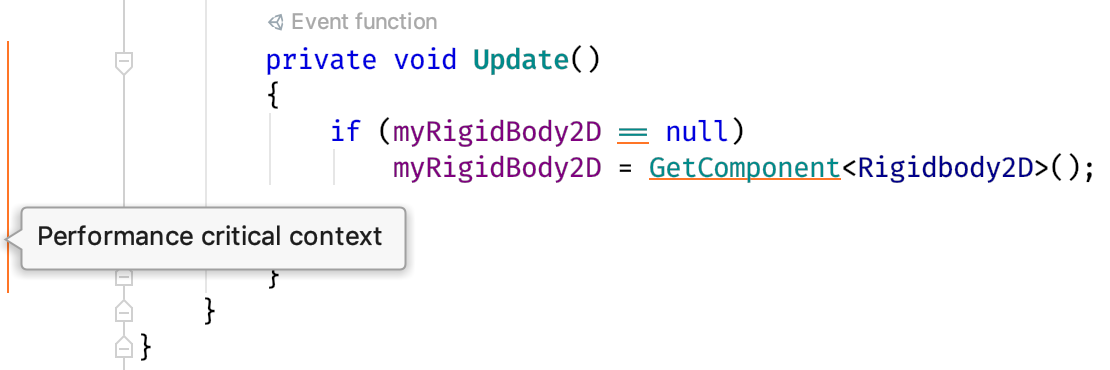
Rider understands that Unity has a number of methods that get called very frequently, such as every frame, and these methods are treated as a performance-critical context and are highlighted in the editor gutter. Once inside this critical context, Rider will highlight any Unity API calls that are known to be expensive. Importantly, these aren’t typical warnings that require a fix, but use a different solid underline to provide information and awareness.
The idea behind this feature is that not all of Unity’s best practices for performance lend themselves to traditional warnings and quick-fixes. For example, using SendMessage in an Update method can contribute to poor performance, as SendMessage must use reflection to look for methods, by name, on any attached MonoBehaviour, not something you want to do every frame. Rider could easily add a warning highlight here, but the fix is harder – ultimately, it requires avoiding SendMessage altogether, and ‘rearchitecting’ some of your code.
Similarly, there are occasions where the code you’ve written isn’t going to be the best performance, but it’s actually good enough in practice. Perhaps it’s code for a menu or something less critical. Improving performance would be a good idea (let’s not forget battery life!), but fixing this might be a lower priority than other tasks right now.
And that means that you’re stuck with warnings in your code that you can’t easily fix, or don’t have time to fix right now. We felt that this was a bad user experience – we don’t want to encourage you to ignore warnings! We’re more than happy for you to configure or explicitly and knowingly suppress individual warnings, but we think it’s a bad experience to have lots of warnings left unhandled.
So we introduced the idea of performance indicators. Instead of showing a traditional warning without being able to help with the fix, we instead use a different highlight, a solid underline, so that you’re aware that you’re calling an expensive method. You can now make an informed decision about what to fix, how and when, without being nagged with lots of warnings.
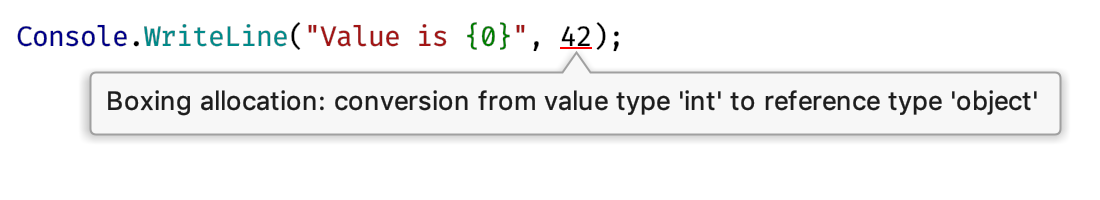
This is a similar approach taken by the Heap Allocations Viewer plugin as it highlights allocations and boxing. It’s not telling you that the allocations are bad, but making you aware of where they happen. It’s up to you to decide what to do with that knowledge.
Show me more!
Now that we’ve seen what it looks like, and the thinking behind it, let’s dig into some details.
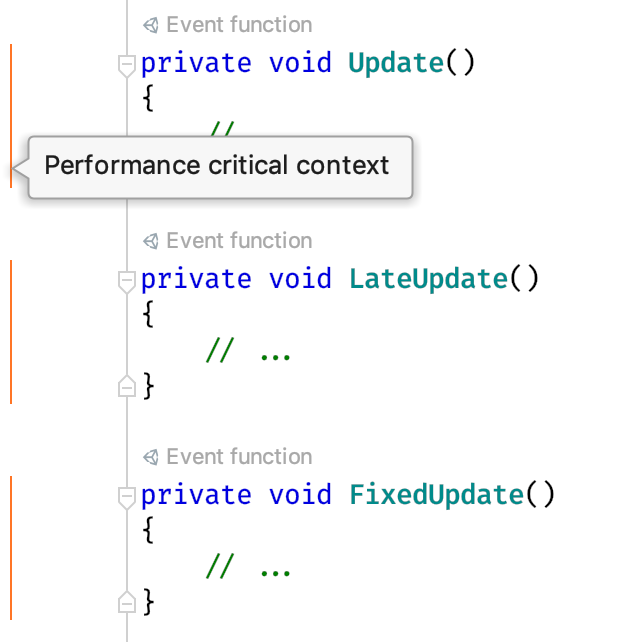
Unity has a number of methods that get called very frequently. For example, MonoBehaviour.Update is called every frame, as is LateUpdate, and FixedUpdate can even be called multiple times in a single frame. Rider treats all of these methods as performance-critical, and will highlight the method in the editor gutter.
Unity also has the concept of coroutines, iterator methods that yield execution and complete later. This allows a function to co-operatively run for longer than a single frame without causing the frame rate to drop. Rider will recognize coroutine methods passed to StartCoroutine as either a string literal or direct method invocation as performance-critical too.
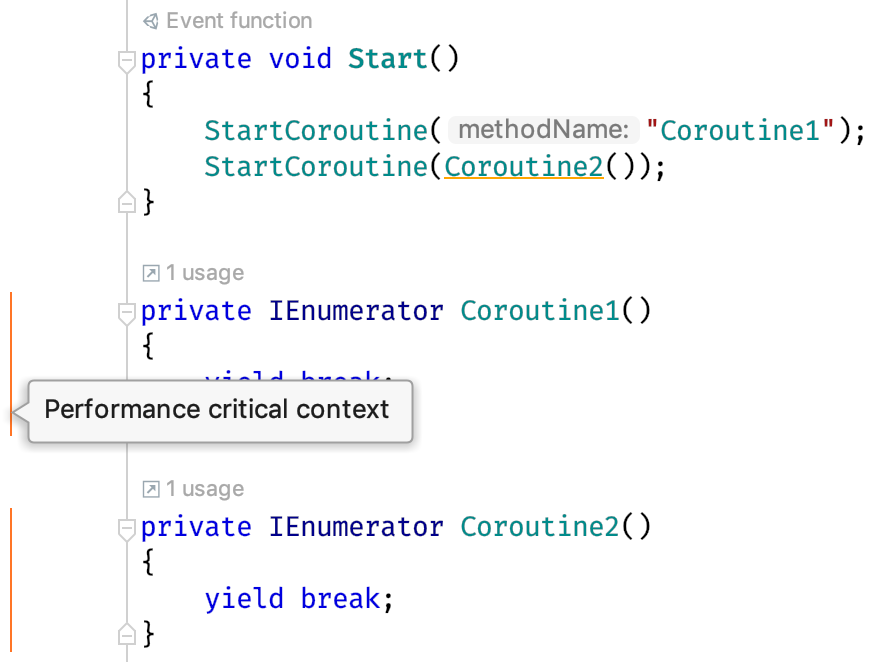
Even better, Rider propagates the performance-critical context to any methods in the same file that are called from another performance-critical context method.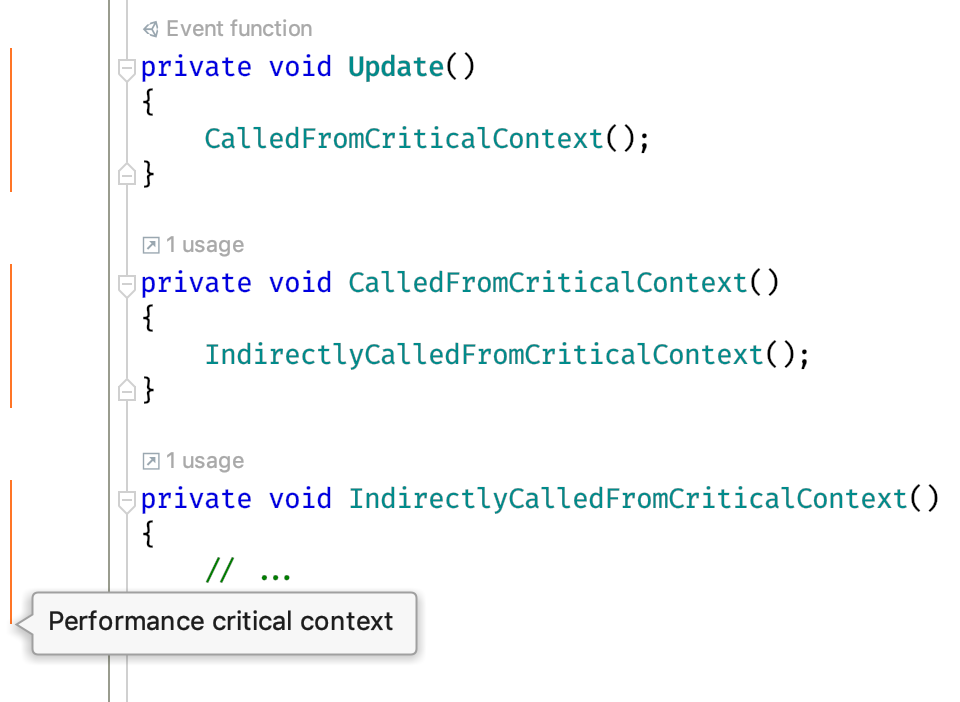
Once inside a performance-critical context, Rider enables a number of inspections:
- Avoid usage of GetComponent methods
- Avoid usage of Find methods
- Avoid usage of AddComponent
- Avoid string based method invocation (Invoke, SendMessage, etc.)
- Avoid Camera.main
- Avoid null comparisons for Unity objects
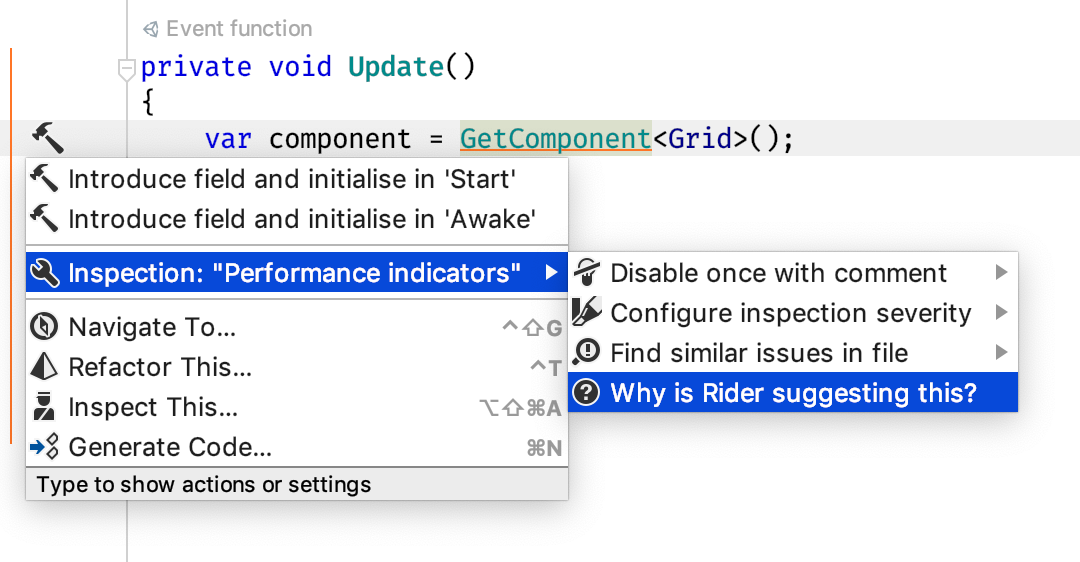
The links above will take you to the documentation pages for each of the inspections, which provide more details of why the method calls are highlighted, and what you can do to avoid them. You can get to this documentation straight from Rider, like with many other inspections, with the “Why is Rider suggesting this?” Alt+Enter menu item.
Let’s take a look at a perhaps surprising example – comparing a Unity object against null. You might not expect this to be a performance issue, but Unity objects override the equality operators, and when checking against null will make a call into native code to see if the underlying engine object is still alive (more details on this can be found in this Unity blog post). This transition back to the native part of Unity has a cost, so Rider highlights this as an expensive operation.
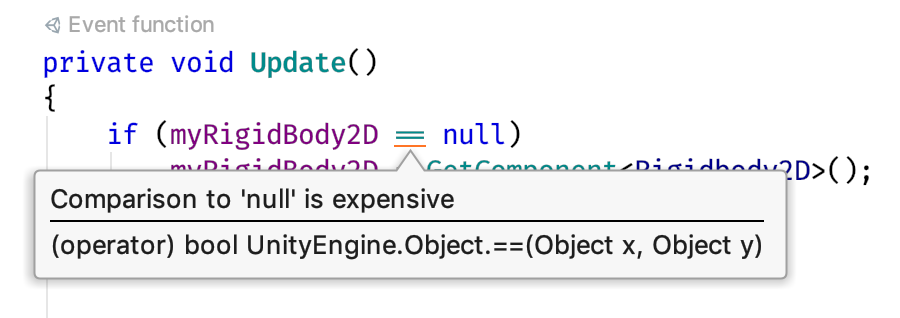
This is a great example of why we’re using indicators instead of traditional warnings. This is a perfectly valid check to make – but it’s expensive. There is no way for Rider to know the expected lifetime of this object, so it’s not possible to know if the check should be made or not. So instead, Rider simply tells you that you’re performing an expensive operation, and it is up to you to decide how that should be handled.
If you know the object has a long lifetime, you can happily delete the code. If you know the object could be destroyed, you can leave everything as it is – there’s no warning in the error stripe in the editor scrollbar, or reported in solution wide analysis. And if you wish, you can suppress the highlight with a comment, via the Alt+Enter menu.

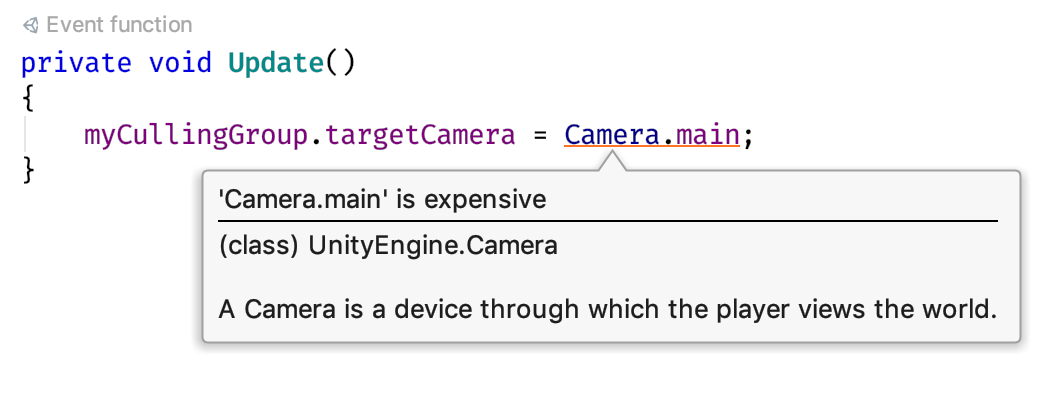
Let’s take a look at another, slightly more notorious example, using Camera.main inside a performance-critical context. This is bad for performance because the implementation of Camera.main does not use a cached value but always calls FindGameObejctsWithTag, which is an expensive method call, especially done every frame. It’s essentially the same impact as the “Avoid usage of Find methods” inspection and should be avoided.
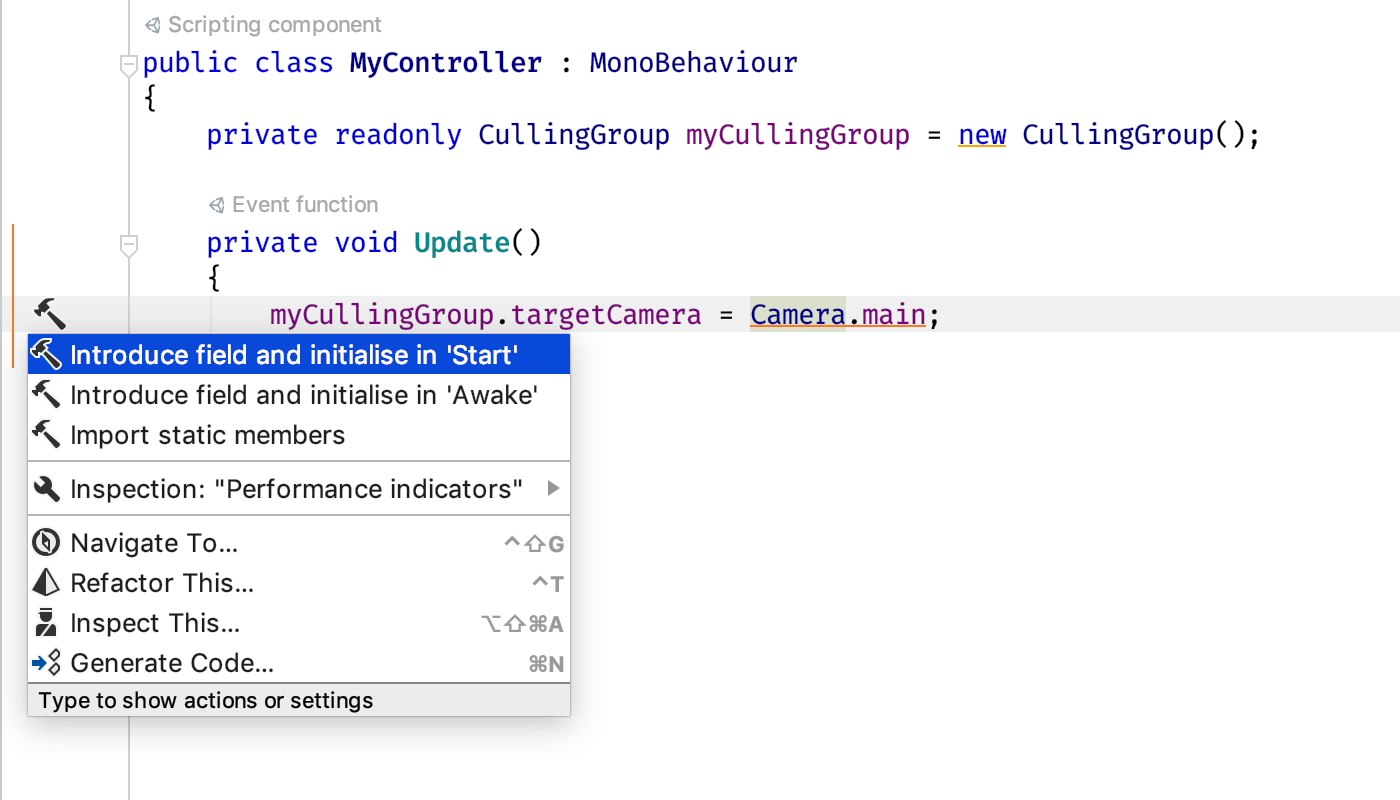
Rider can help here too, by providing two context actions that will create a field and initialize it in either Start or Awake. But note that this changes the semantics of the method – if the main camera does in fact change, the cached value does not get updated. Whether this is a requirement or not is up to you to decide.
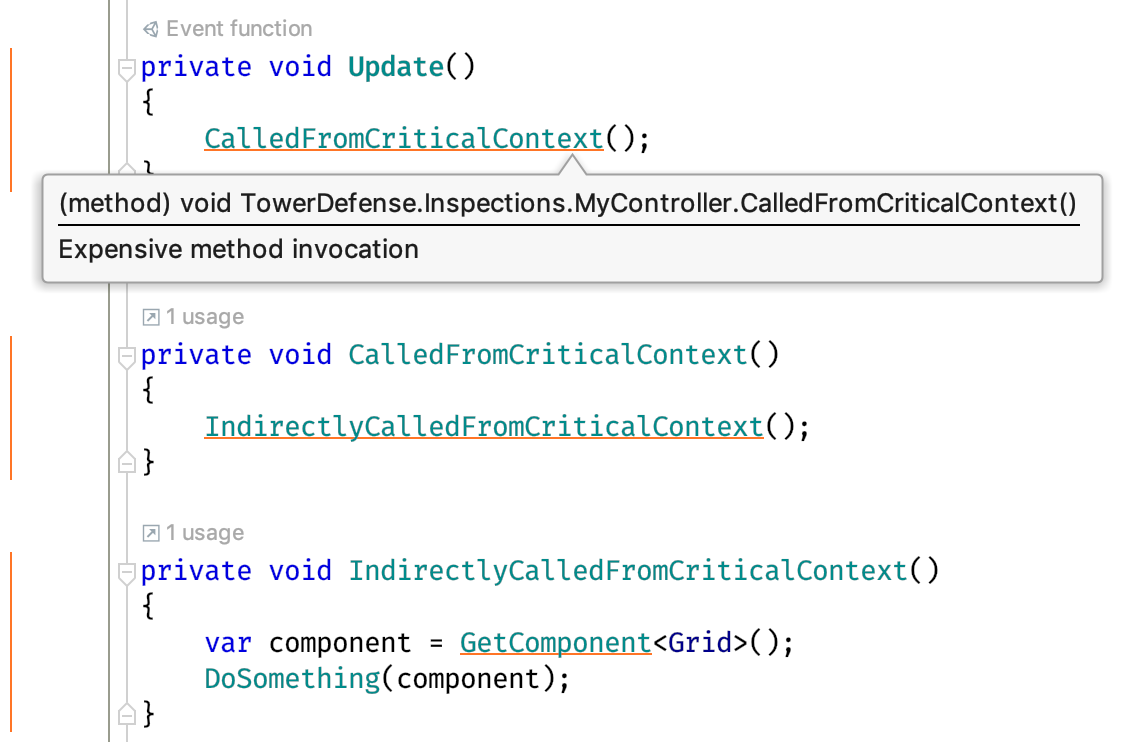
And the icing on the cake is that this works cross method, within the same file. The performance-critical context is propagated down the call chain, to directly and indirectly invoked methods. And the knowledge that a method performs an expensive operation is propagated back up the call chain to the original performance-critical context. This means that if Update calls a method (in the same file) that indirectly calls GetComponent, the method call in Update is marked as expensive.
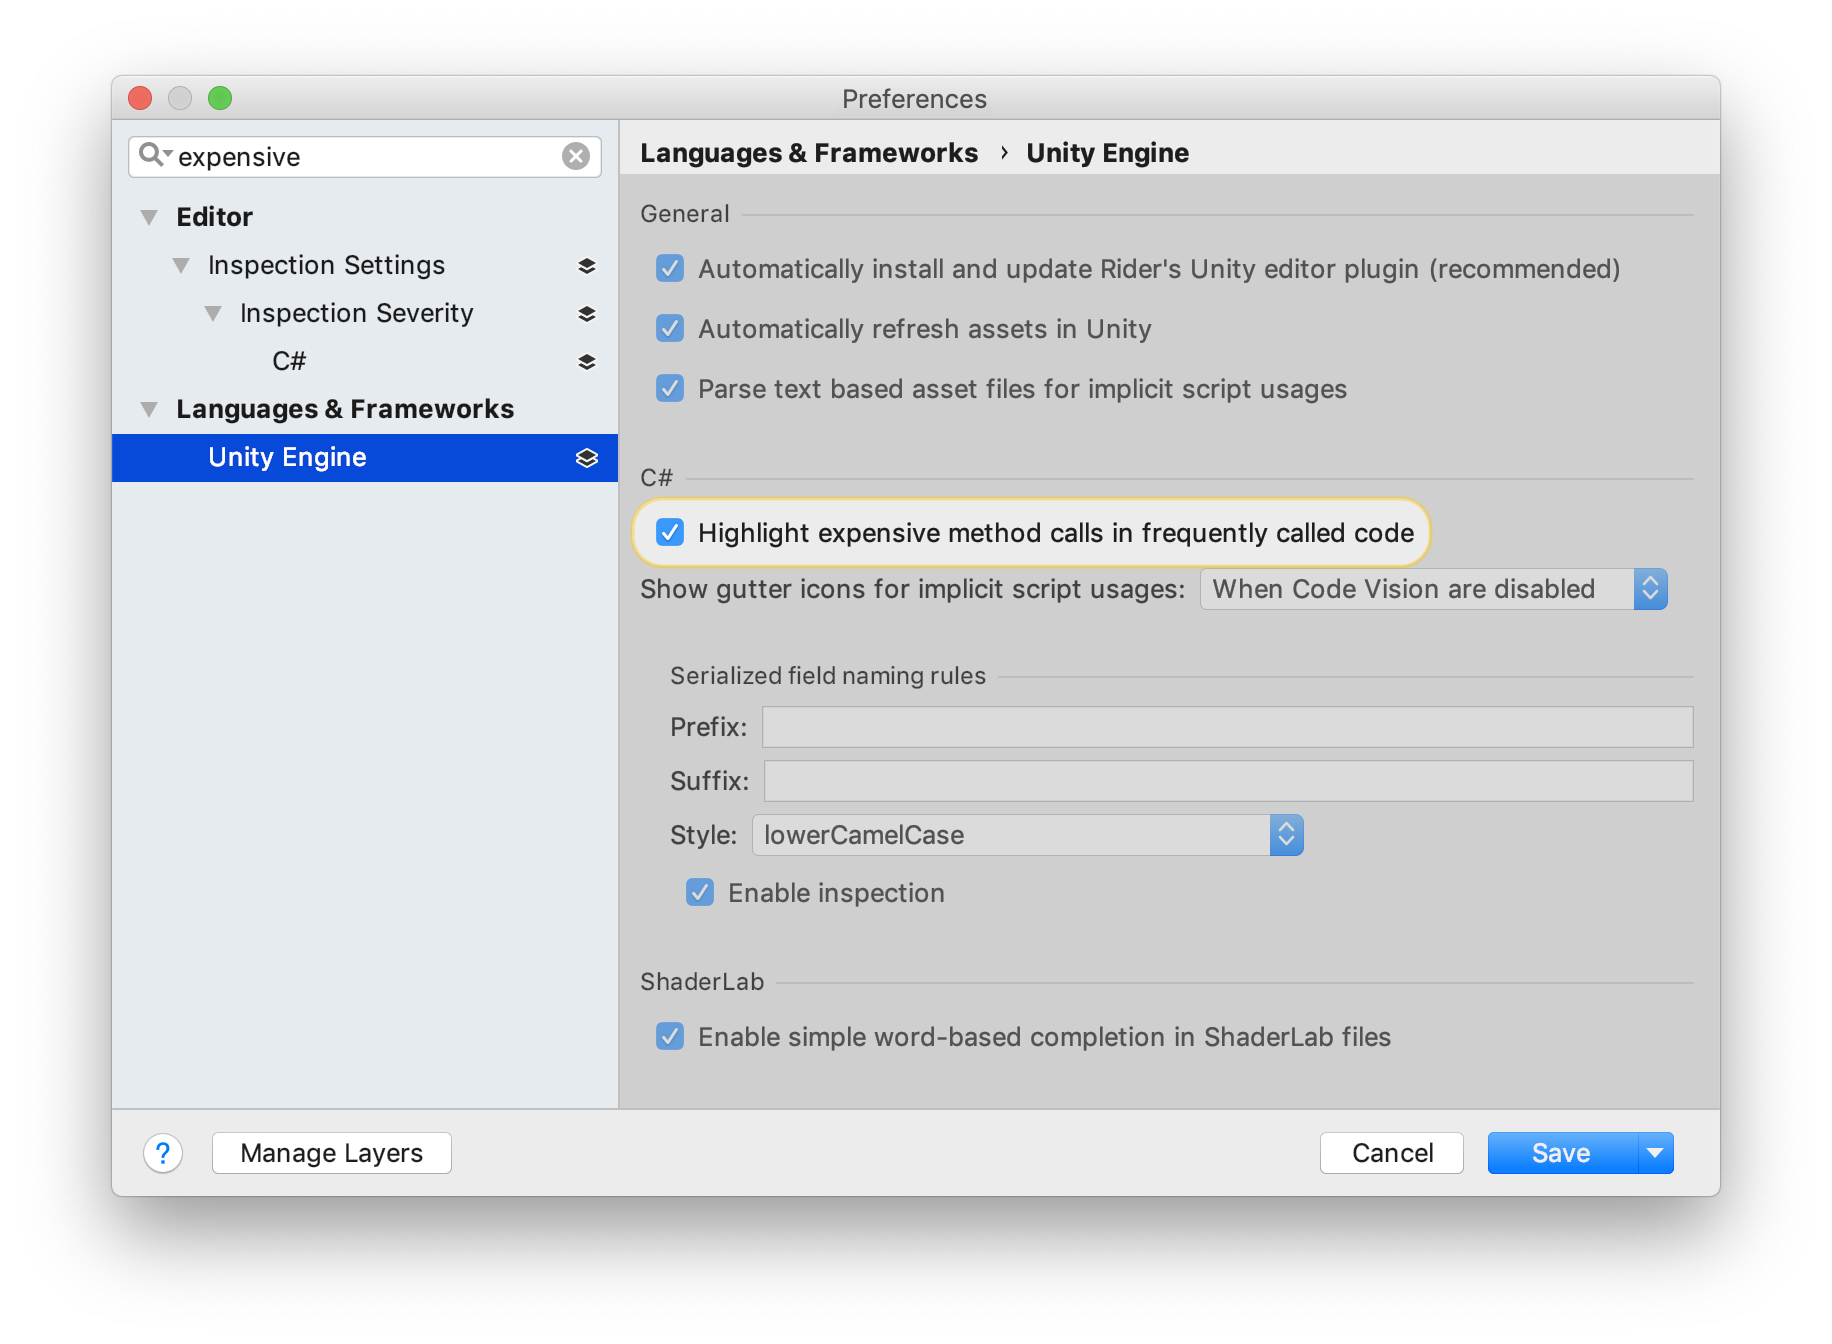
Hopefully these performance indicators will provide a lot of benefit, not by telling you when your code needs fixing, but by providing awareness of when you’re making expensive calls in a performance-critical context. And of course, if you don’t want them, you can disable individual inspections in the Unity section of the Preferences | Editor | Inspection Settings | Inspection Severity | C# settings page, or disable them completely in the main Unity settings page.
Next time, we’ll take a look at the performance guidance Rider provides as more traditional inspections and quick-fixes. Until then, make sure you’ve downloaded the latest version and give Rider a go!
Before we go, it’s very important to point out that Rider’s analysis is no substitute for proper performance profiling. These features are designed to help you follow Unity’s best practices for performance when interacting with the Unity API, and don’t attempt to find performance issues in other areas of your code. Always be measuring!

Subscribe to a monthly digest curated from the .NET Tools blog: