.NET Tools
Essential productivity kit for .NET and game developers
Debugger Extensions for Unity in Rider 2020.2

Rider 2020.2 has a lot of great new features for Unity, and debugging has certainly had its fair share of attention in this release.
We’ve already introduced “pausepoints”, a new kind of breakpoint that puts the Unity editor into pause mode when a condition is met in code, allowing you to use the Unity Inspector to see what’s going on at that point. And in the last post, we saw how Rider can help you debug players, either standalone on the desktop, or on mobile devices and consoles, including USB support for Apple devices. Today, we’re going to look at a set of small features that will make a big difference to how you debug your Unity projects.
One of the problems with debugging a Unity game is understanding your current context – if you’re debugging a MonoBehaviour script, which game object is it attached to? Where is it in the object hierarchy? What other components are attached to the game object? What’s the position of this Transform?
All of these questions and more can be answered through the debugger, but that often requires drilling down into objects, or evaluating expressions and calling methods, making you work to find these answers, rather than having the most useful information quickly and easily accessible.
Rider has made a whole load of little tweaks to how we display Unity values in the debugger, all designed to give you a better view of the current state of your project, and to make it easier to see this much needed context.
Rider does this in a number of ways. It will add extra items to the Watches and Variables tab, showing you the currently active scene, for example. It also adds extra child items to expanded values – the "Active Scene" item will show root game objects, and each GameObject shows child game objects and attached components, giving a view of the whole scene hierarchy. Rider has also updated the summary information displayed for some Unity types, pulling useful information up so it’s always visible, such as showing the position, rotation and scale of a Transform without having to expand the value. Let’s take a look at more details, and see some examples.
Active scene and the game object hierarchy
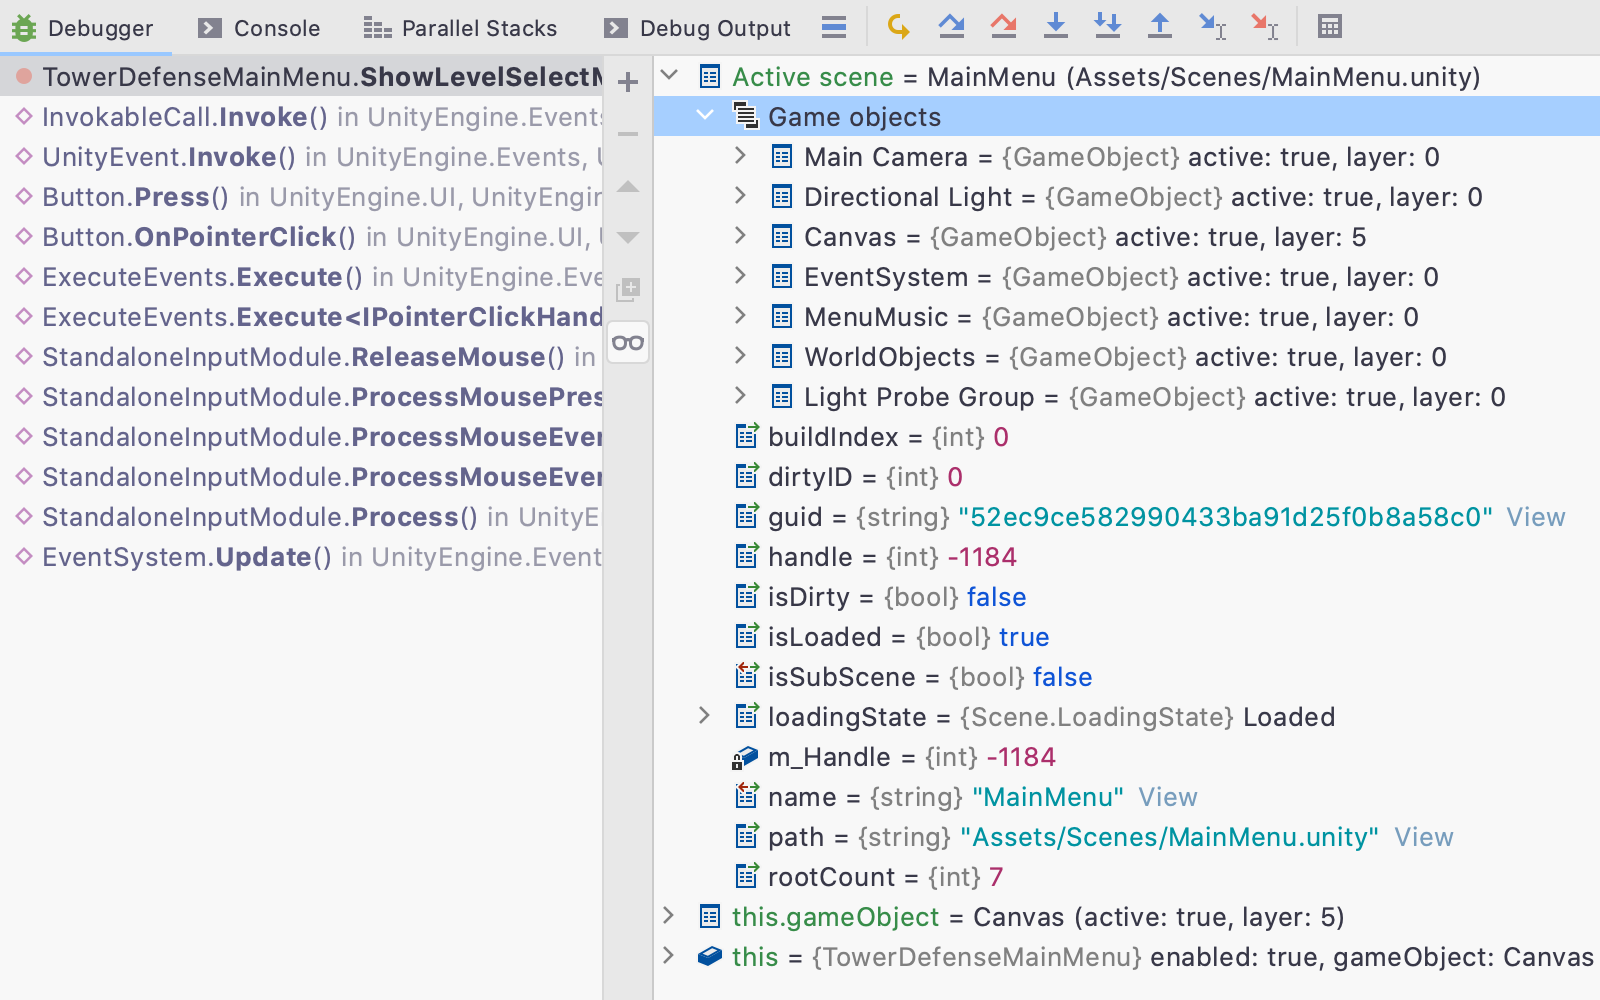
Whenever you hit a breakpoint, Rider will add an “Active Scene” item to the Variables and Watches tab, very much like an automatically created watch variable. This shows the active Scene object, as returned by SceneManager.GetActiveScene. The idea here is to give you the context you need for your Unity game, and the active scene is a great entry point for this. Collapsed, it will show the scene name and file path, and when expanded, you’ll not only see the normal debugger view of fields and properties, but you’ll also see a new group called “Game objects”. Expanding this item will list the root game objects in the scene.
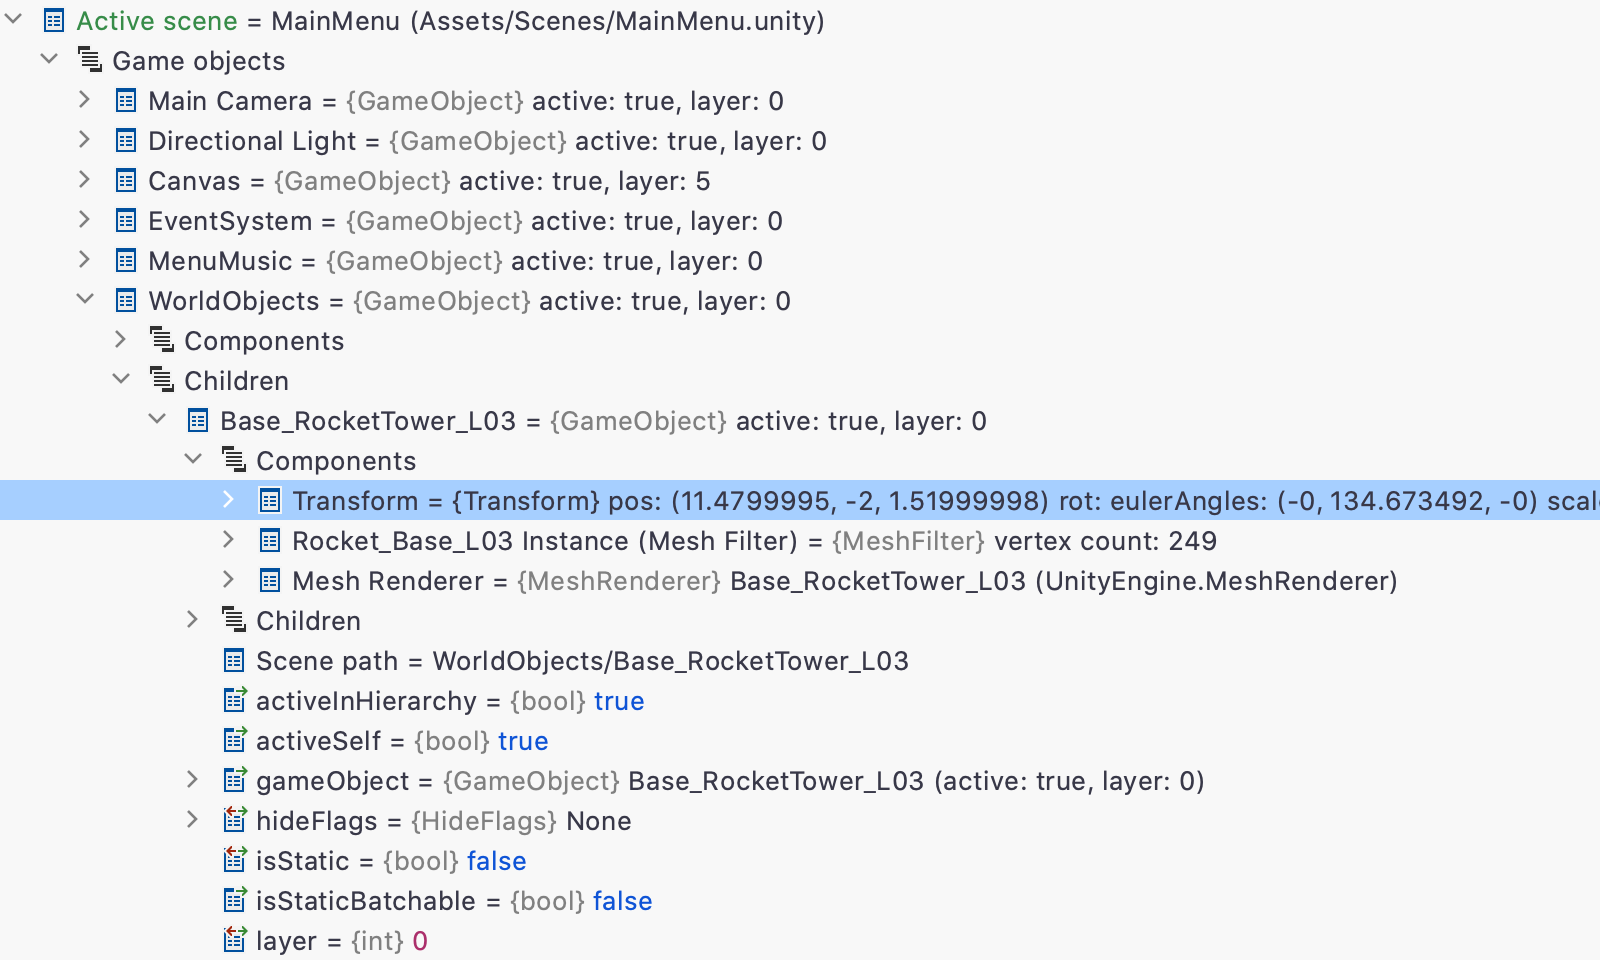
Rider adds new items to GameObject instances, too. The “Children” group shows the child GameObjects of this instance, very much like how the “Game objects” group works for Scene. You can use this to get a debugger view of the entire object hierarchy of your scene. And don’t worry about performance – Rider collects these values on demand, so they’re not calculated unless they’re shown, and Rider will group results larger than one hundred game objects, so it will handle very large hierarchies, too.
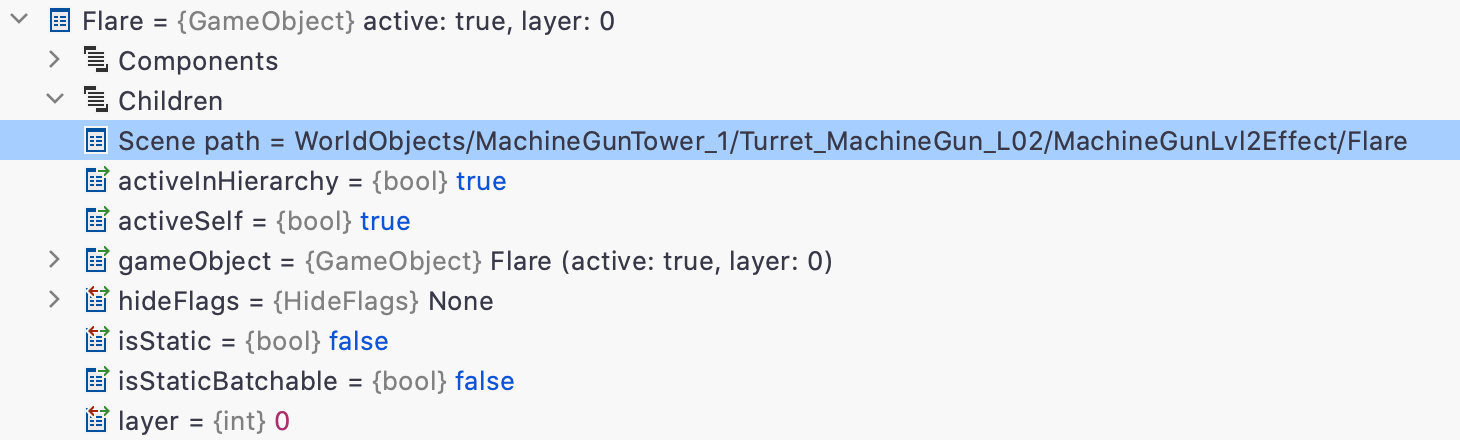
You might notice a couple of other new values under GameObject. There’s a new “Components” group that shows all Component instances attached to the GameObject, such as Transform or any attached MonoBehaviour derived scripts. And there’s a new “Scene path” value that shows the location of the GameObject in the object hierarchy, as a path from the root object. This is also shown for Component instances, making it a little easier to see where a GameObject or Component is being used in the object hierarchy.
Finally, if the current object being debugged – i.e. this – is a Component such as a MonoBehaviour script, then Rider will add another “automatic watch variable”, this.gameObject. This does exactly what the name implies and shows the this.gameObject property. It would be very easy to expand this and find the gameObject value, but this simple addition pulls some useful context up to the top level to make it quicker and easier to find.
Improving summary info
So far, we’ve looked at only one way the debugger has to display values – the Variables and Watches tree view. This can show complex objects such as a class or struct by expanding the value to show fields and properties. But when collapsed, the debugger shows a brief summary, hopefully showing the most relevant information. You can also see this summary info in tooltips, and drawn on the editor surface.
This content comes from the object itself, either as the output of ToString() (which by default is simply the name of the object’s type, but can be overridden in derived objects), or from the [DebuggerDisplay(...)] attribute, which specifies field or property names in a string.
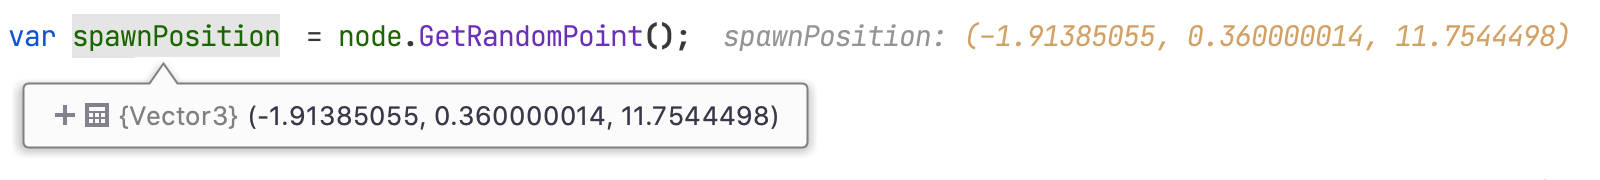
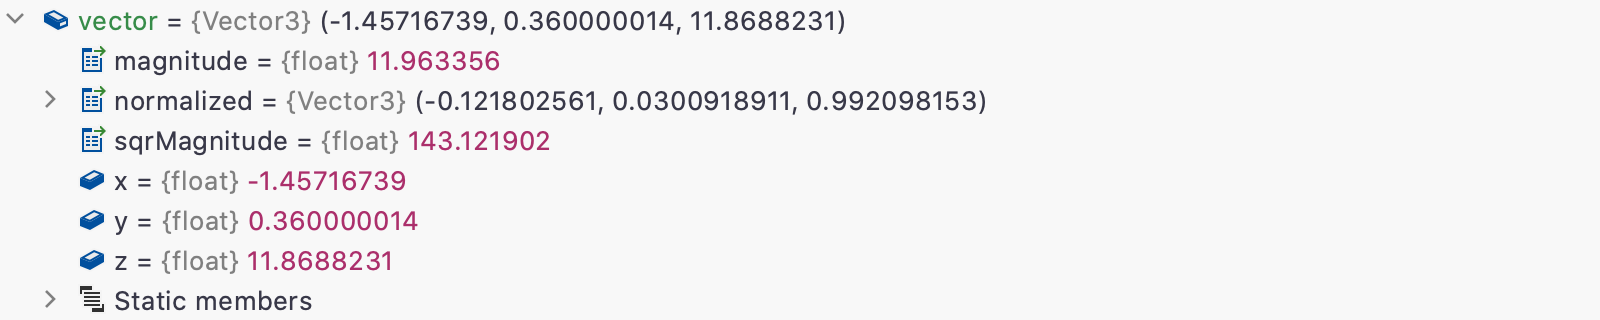
Unity doesn’t make much use of [DebuggerDisplay], but it does override ToString() in a number of places. Unfortunately, the output of ToString() is sometimes more appropriate to user facing output than it is to debugging. For example, the implementation of Vector3.ToString() defaults to showing the float values of x, y and z with the F1 format specifier. This means that each float value is shown to one decimal place. While this makes for a nice looking output, it’s not helpful when the summary and expanded view of an object are so different.
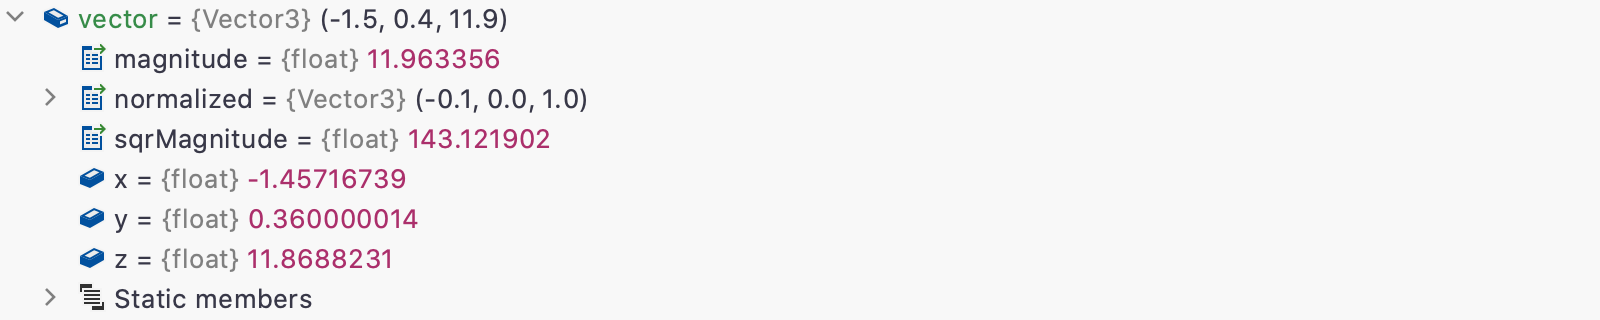
So Rider provides alternative summary information for a number of Unity types. This includes the Vector types, as well as Rect, Bounds, Plane, Ray and so on. Any Unity type that outputs float values at F1 has been overridden to show the field values at full precision, making it much easier to see, at a glance, what the value actually is.
There are other types that Rider overrides like this. Transform is a great example. Transform derives from UnityEngine.Object, which provides an implementation of ToString that shows the name of the object and its type. The name of a component is always the name of the game object it’s attached to, so for a transform, this quite often shows something like "Cube (UnityEngine.Transform)". Wouldn’t it be better to show the local position, rotation and scale without having to expand the object?

Rider provides overrides for a few other Object based types – the MeshFilter component quickly shows the vertex count and Scene will show the scene name and file path. GameObject shows its name and the activeInHierarchy and layer properties. Objects deriving from Behaviour show the enabled flag, plus the name of the GameObject they’re attached to, surfacing the most important details to tooltips and summary information.

And don’t forget that you can add debugging information for you own types too – override ToString() or use [DebuggerDisplay(...)] to provide summary information, or use [DebuggerTypeProxy(typeof(...))] to specify an object to provide different fields and properties when you expand an object. And the [DebuggerBrowsable(...)] attribute can be used to hide a type member. See the docs for more information.
Round up
Of course, many of Rider’s other debugger features work just fine with Unity projects, too. Things like Pin to Top and setting the next statement, conditional and dependent breakpoints (these work great with pausepoints, too!), debugging decompiled code, and also the new Pin to Frame (although sadly, not the Data Breakpoints in that blog post, as that requires an API that is only available in .NET Core on Windows).
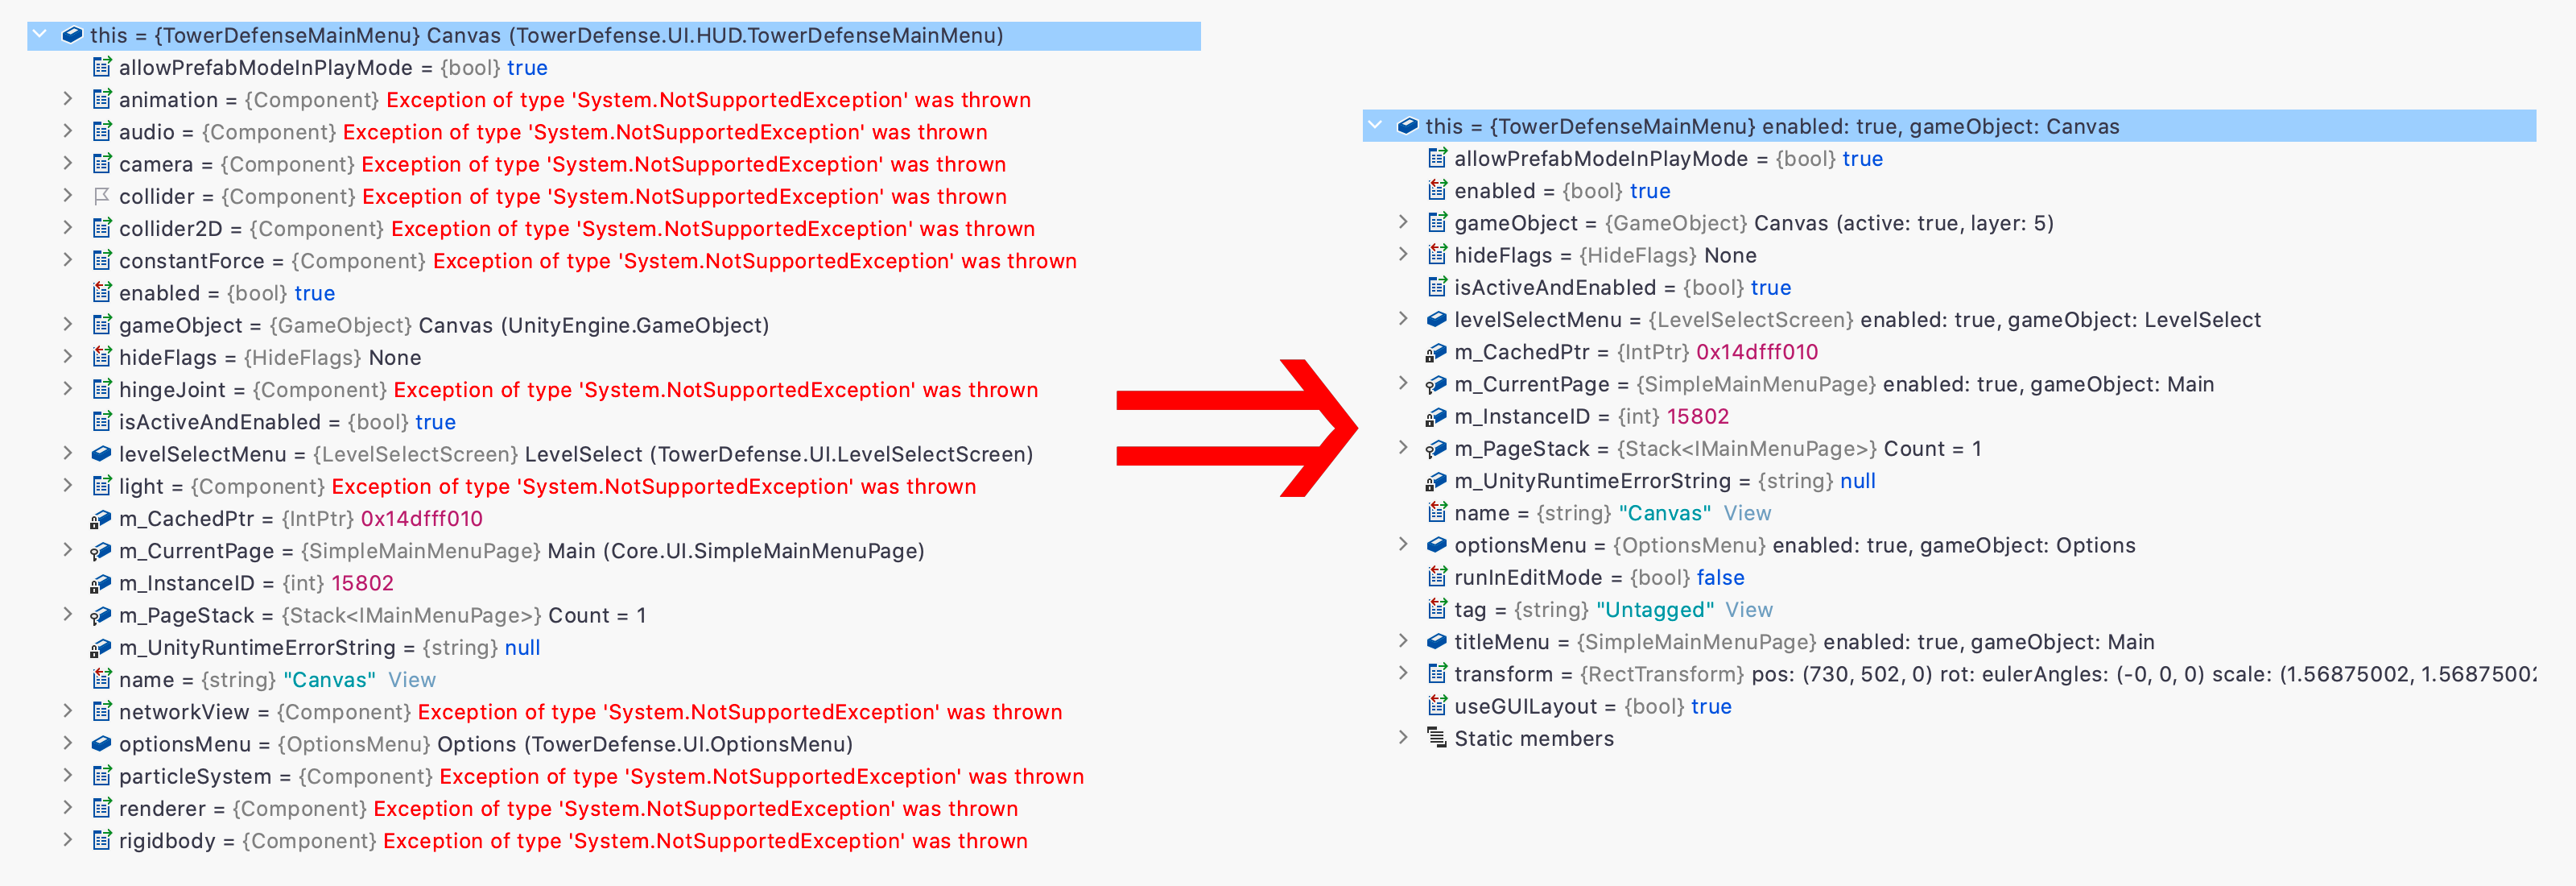
And finally, the best kind of new feature – we’ve removed something! Both GameObject and Component have a number of obsolete properties that do nothing but throw exceptions. They’re hidden from code completion with the [EditorBrowsable(EditorBrowsableState.Never)] attribute, but not hidden from the debugger with [DebuggerBrowsable(DebuggerBrowsableState.Never)]. You might have seen this in older versions of Rider – the exceptions aren’t causing any problems, but they do add a lot of noise. Rider now filters them out. Much cleaner!
Before we finish, it’s important to point out that all of these features are available when debugging your game in the editor, but not everything is available when debugging players. This is because the debugger can’t always get the information – some features require APIs that only exist when the application is running in the Unity editor, and others require fields or properties that are stripped from player builds. If it can get the data, the debugger will show it. If not, it will gracefully fall back, and you’ll see the standard ToString representation of the value.
Oh, and if you don’t want to see this extra information, you can disable it in the Preferences | Languages & Frameworks | Unity Engine settings page.
In the next few posts on Unity, we’ll take a look at analysis of Burst enabled code, the long awaited shader support, and perhaps we’ll have a quick round up of other changes. In the mean time, download Rider and try out the updated debugger on your own projects. We’re looking forward to your feedback!