.NET Tools
Essential productivity kit for .NET and game developers
Rider 2021.3 Early Access Program Has Launched!


Get the build right now!
Let’s take a look at what we have inside.
Problems View
Having all potential problems for a solution in one place can be helpful, which is why we are happy to introduce the “Problems View“! The Problems View (the “Problems” tab in Rider UI) is a tool window that aggregates all of the potential issues that exist in a solution, such as project loading errors, failed NuGet restore processes, inspections from the open file, and all SWEA errors.
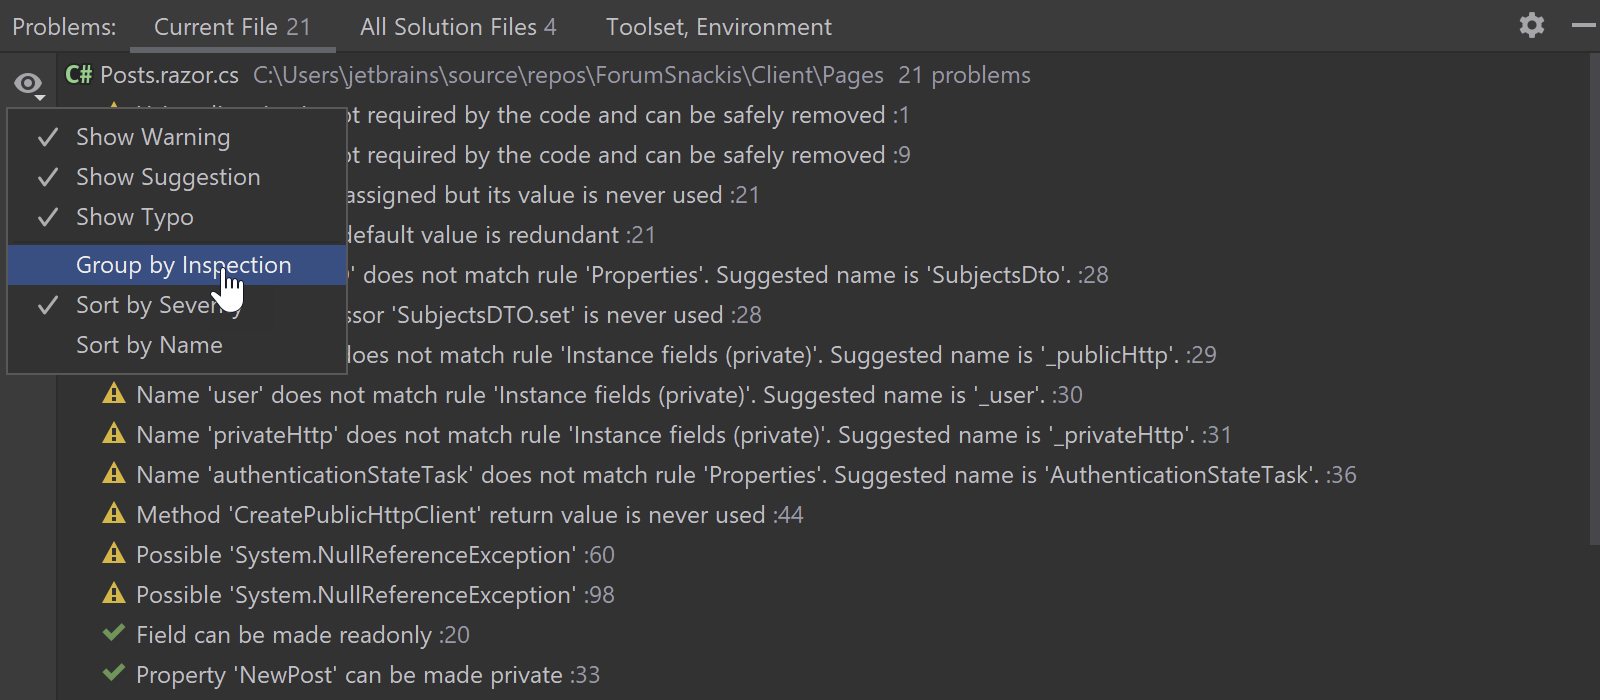
The tool window consists of three tabs:
- Current file: Here, you can find all of the errors, warnings, suggestions, and hints which Rider code analysis found in the file you are currently looking at. It works the same way as in IntelliJ IDEA – the Inspection widget located at the top of the vertical scrollbar leads directly to this tab.
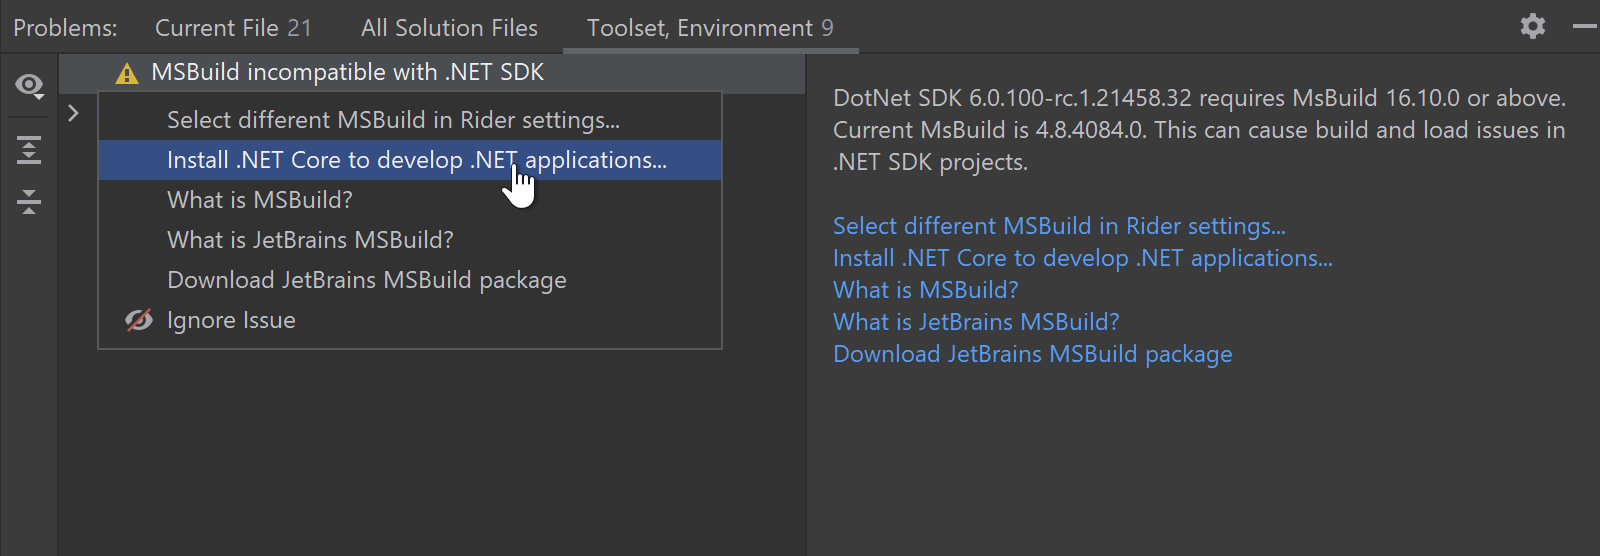
- Toolset, Environment: This aggregates all the diagnostics and messages related to the solution load activities, NuGet restore processes, and so on with proper description and a corresponding list of fixes, if any exist. You could previously find most of the same diagnostic messages in the Event Log tool window.
- All Solution Files: This is the new home for the SWEA tool window. Here, you can see all the errors that the Solution Wide Error Analysis found in the whole solution.
.NET 6 SDK Support
Starting from this EAP, Rider officially provides initial support for .NET 6 SDK, including project templates, target frameworks, and creating/running/debugging projects targeted to the new SDK. If you experience any issues, please let us know. Please note that the Hot Reload feature and Blazor Debugging for .NET 6 are not supported yet.
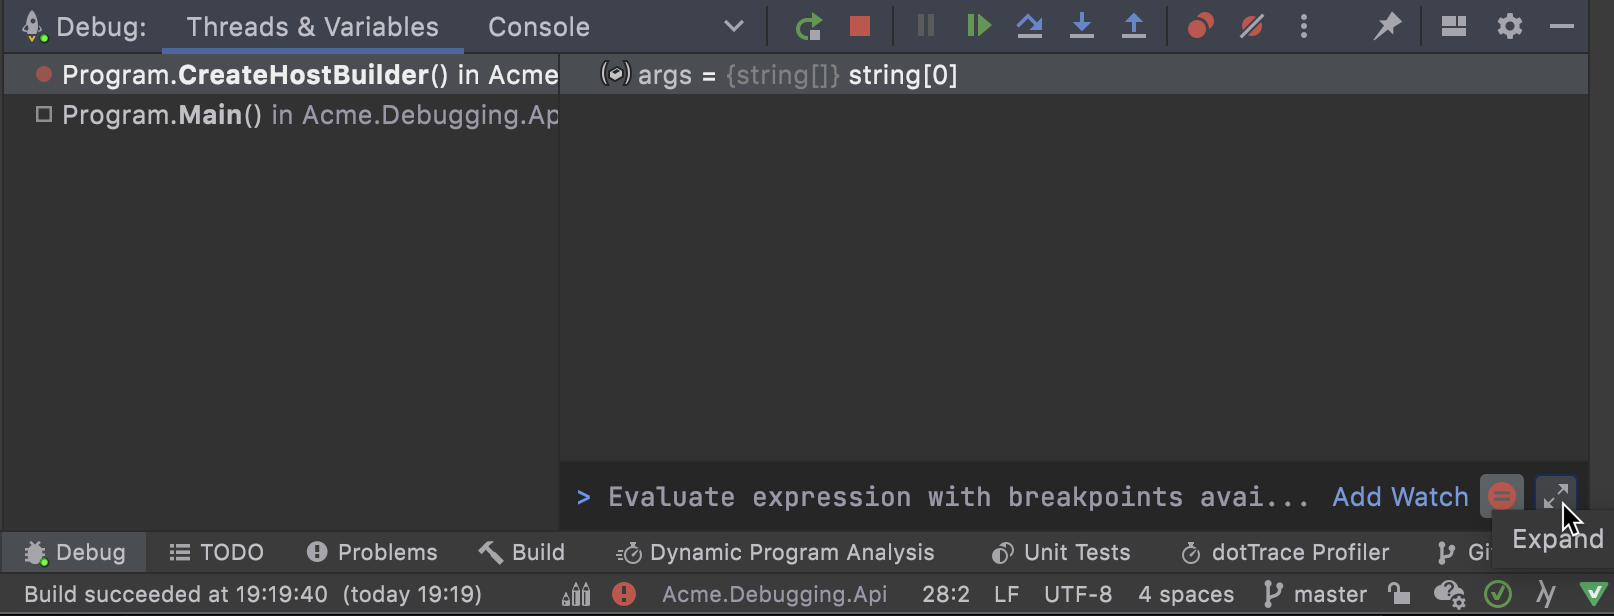
New UI for the Debug tab
A new UI is coming to the Debug tab! We have lots of changes to talk about.
By default, there are three tabs: Threads & Variables, Console, and Debug Output. Other tabs like Memory and Parallel Stacks are hidden, but you can show them via the Options Menu (the nut icon).
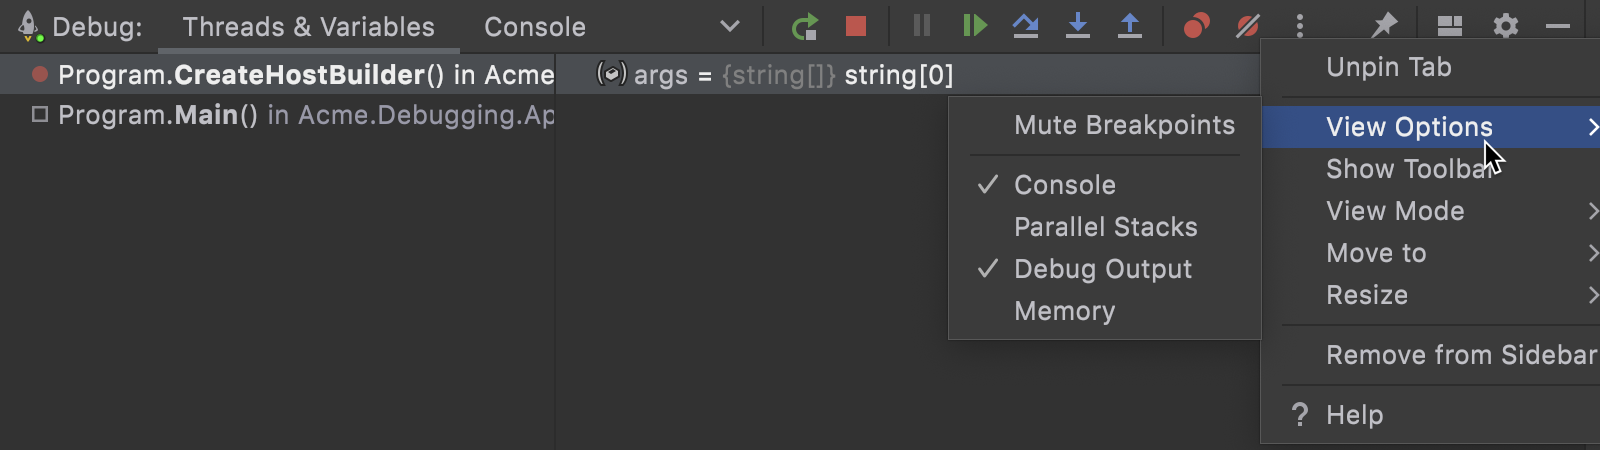
We completely removed the left toolbar and moved icons to the top toolbar or the context menu. To keep the top toolbar as short as possible, we reordered the icon set and left only the most important actions visible. The rest of the icons were moved to the More dropdown menu (three vertical dots icon). Hide Frames from Libraries icon and Hide/Show Threads toggle have been moved to the context menu in the Threads view.
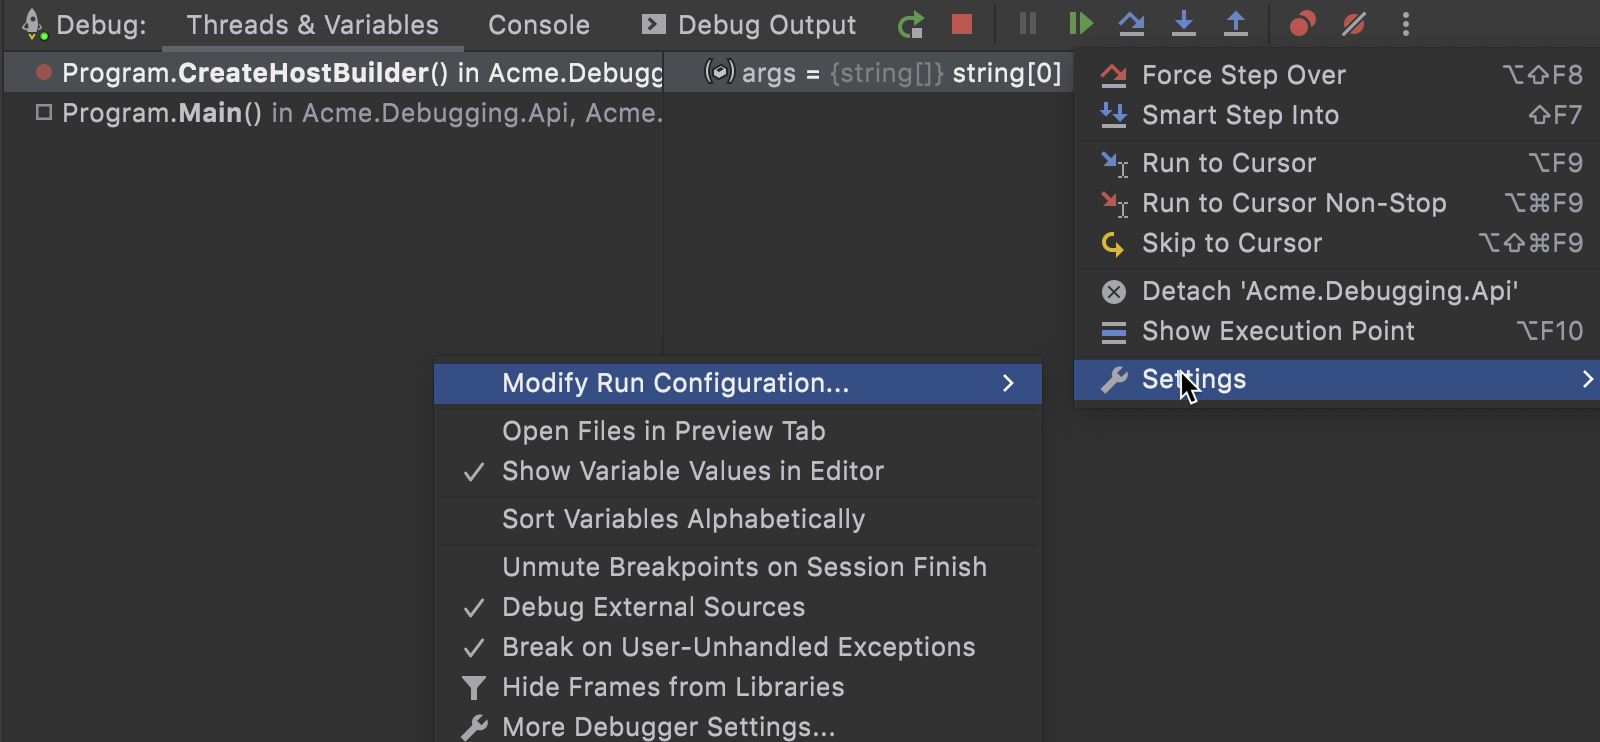
The More dropdown menu has a new Settings submenu. Here, you can find a shortlist of the most common settings related to the debugger without having to go to the Settings/Preferences dialog and drill down into the Build, Execution, Deployment | Debugger page.
The Immediate Window has several updates too:
- Add Watch has been moved from the Variables view to the toolbar of the Immediate Window.
- There are two layouts: maximized and minimized. In the minimized layout, you can see the execution result only in the
$resultvariable in the Variables view. In the maximized layout, in addition to the$resultvariable, you can see the history of the previously executed lines with the results of the executions. You can toggle between them using the Expand/Collapse icon.
- A new option, Stop on Breakpoints, is available. It forces the evaluating process to stop on the breakpoints while evaluating an expression. Disabling the option will allow the evaluating process to ignore the breakpoints.
- The Add Watch action now has a shortcut, Ctrl+Shift+Enter.
Debugger Updates
The debugger itself received a couple of long-awaited and highly-requested features.
First of all, there is good news for UWP developers: you can start your UWP project under the debugger right away. You no longer need to run the project first and then manually attach the debugger to the running process.
Secondly, you can now debug both .NET (Core) and .NET Framework apps in local Windows Docker containers. Previously, the debugger could work only with .NET Core apps in Linux Docker containers.
Language Support
C# 10
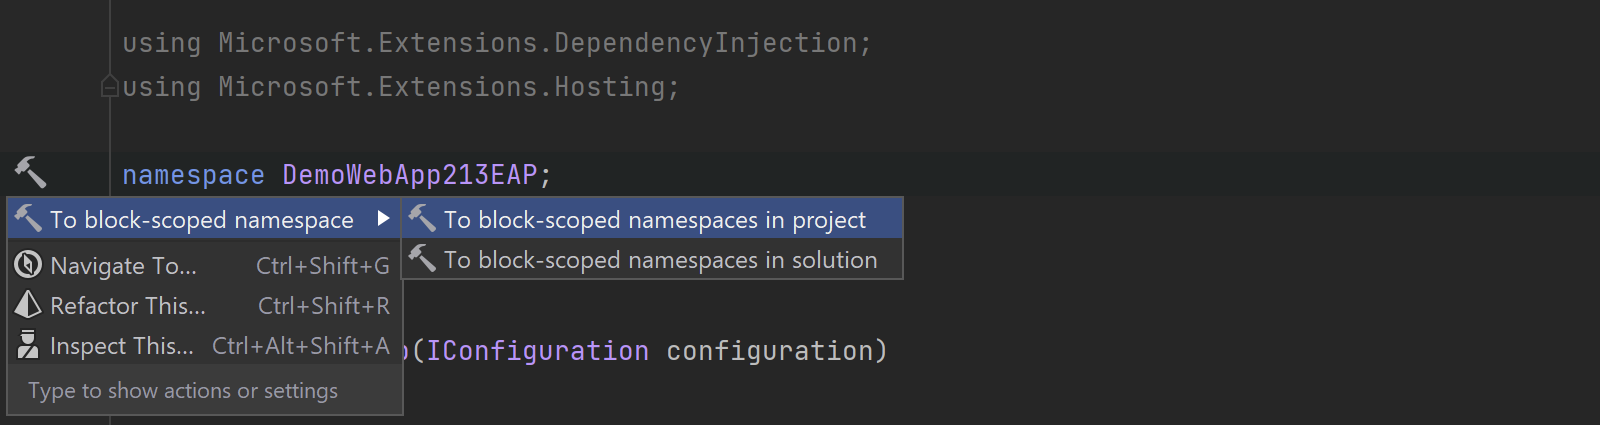
The C# 10 is around the corner, and Rider continues adding some of the upcoming features. Today, we are happy to add support for file-scoped namespaces and global usings.
Let’s start with file-scoped namespaces. In addition to supporting the new syntax itself, we’ve added a new Syntax style option (Settings/Preferences | Editor | Code Style | C# | Syntax Style | Code body | Namespaces) which helps you select the desired style. When you choose the style, Rider will show you inspections for code that has to be changed to follow the style and suggest the appropriate quick fix for you. You can propagate the fix through the project or even through the whole solution in one click.
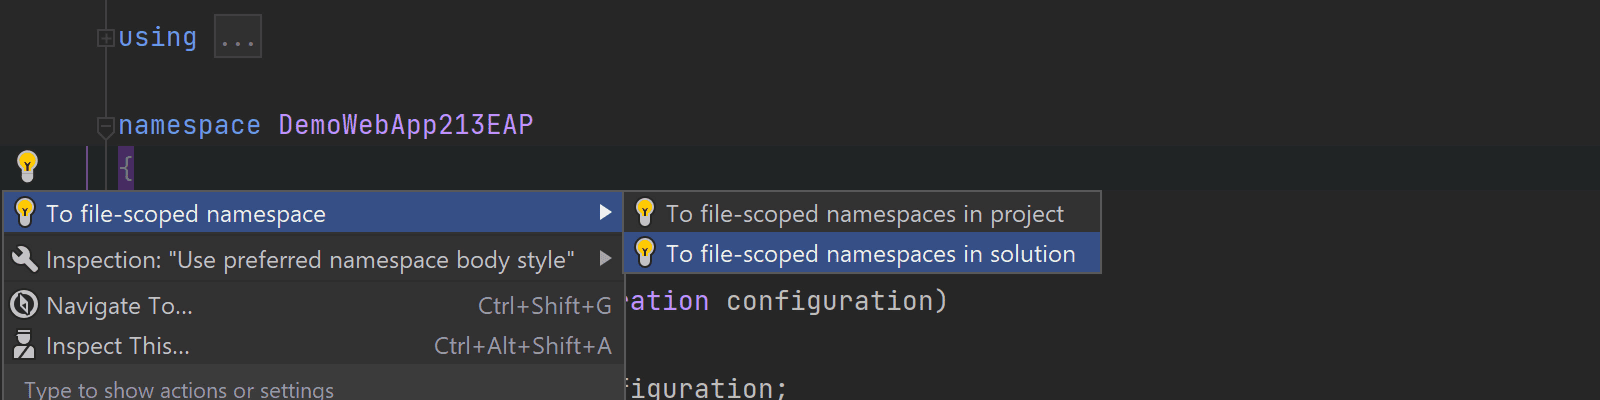
If you want to return to the previous Syntax style for the code, there are two context actions: “Convert to file-scoped namespace” and “Convert to block-scoped namespace.”
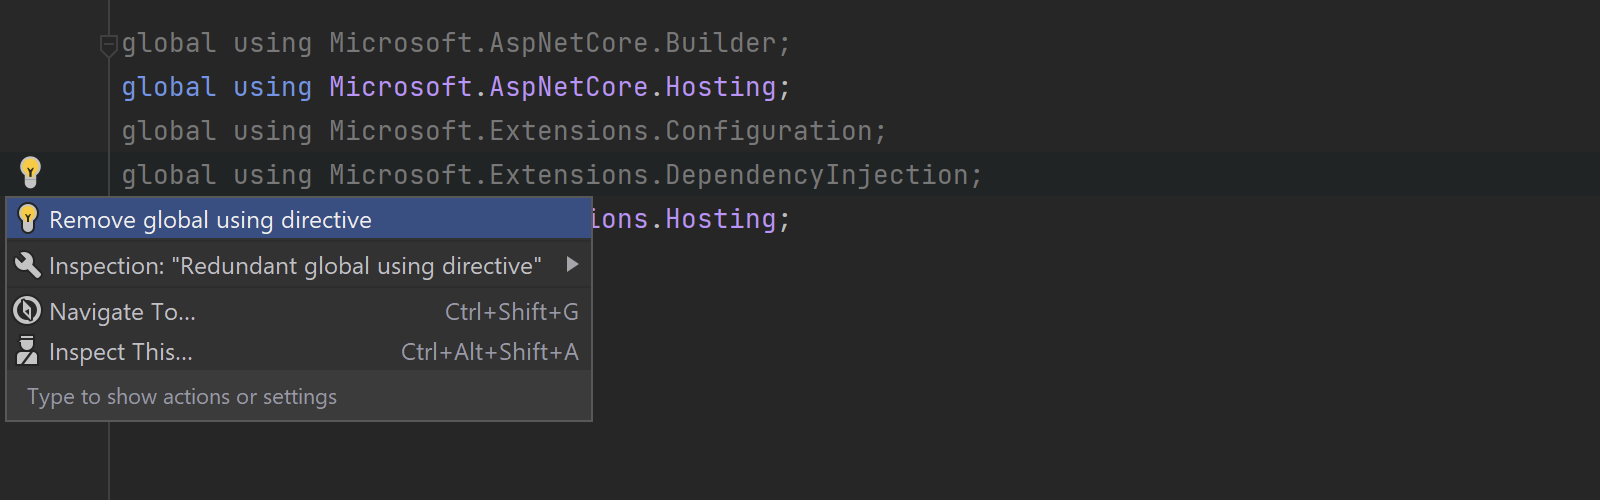
Now, let’s take a quick look at global usings. Rider code analysis is aware of usings marked with the global keyword and uses these usings to correctly resolve symbols in all the code files in the project. If Solution Wide Error Analysis is ON, Rider will highlight global usings which have no usages in the project as unused with a proper quick-fix suggestion to remove the statement. Rider will also notify you if the global using has been placed in the wrong place in the file.
Code Analysis
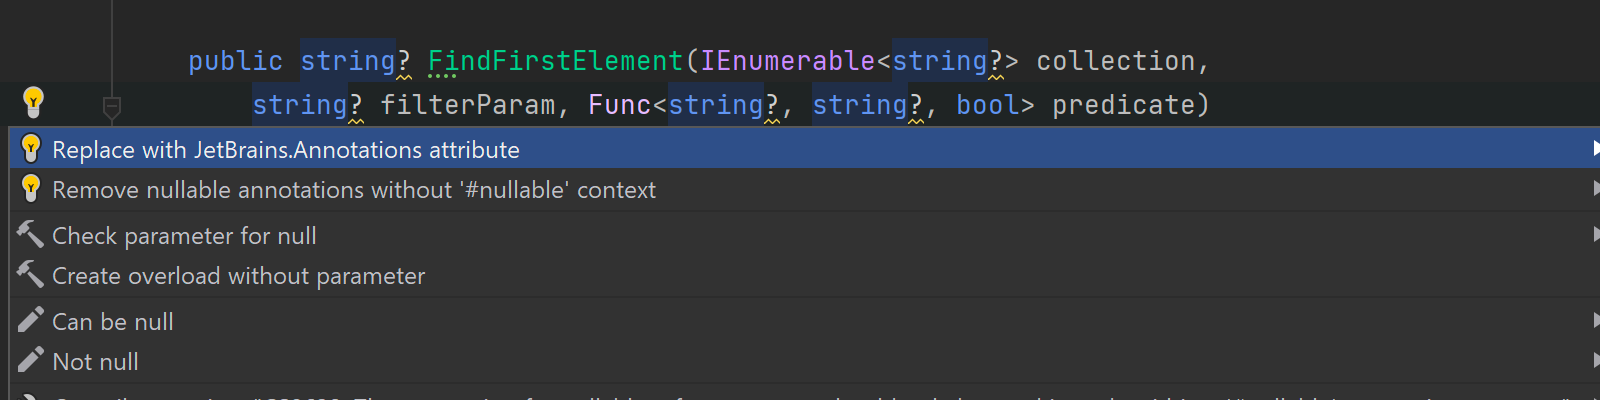
It is not unusual for people to copy pieces of code from other resources, like stackoverflow.com. Nowadays, with nullable reference types is available in C#, some of the code samples already include the NRT syntax. But what if you don’t have NRT enabled in your solution? To help you get rid of this syntax after pasting such code to your project, Rider has two new quick-fixes: Replace with JetBrains.Annotations attributes and Remove nullable annotations without ‘#nullable’ context.
We’ve added a couple of new quick-fixes and a context action for static local/anonymous functions with closures:
- A quick-fix, Allow closures, to remove
staticmodifiers from a local or an anonymous function if it contains closures.
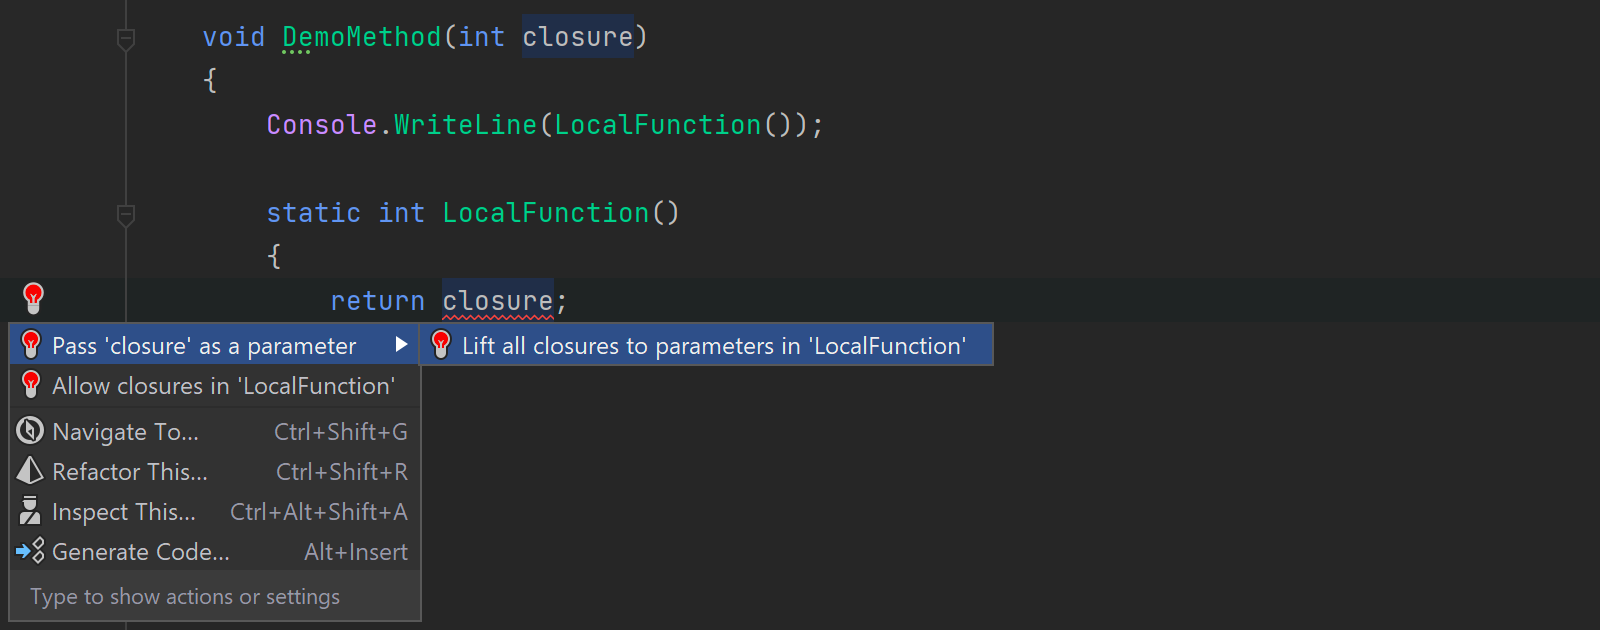
- A quick-fix, Pass closure as a parameter, to lift closures in static local functions to parameters.
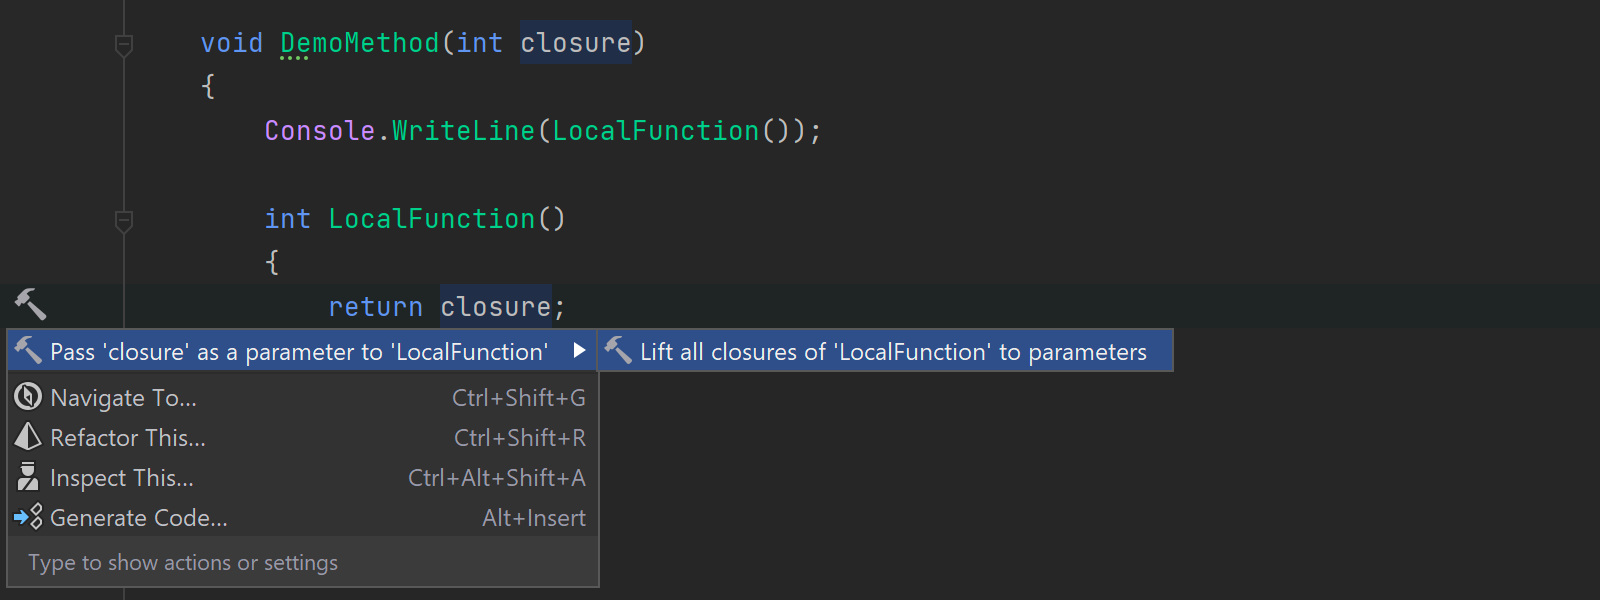
- A context action, Pass closure as a parameter, to lift closures in non-
staticlocal functions to parameters.
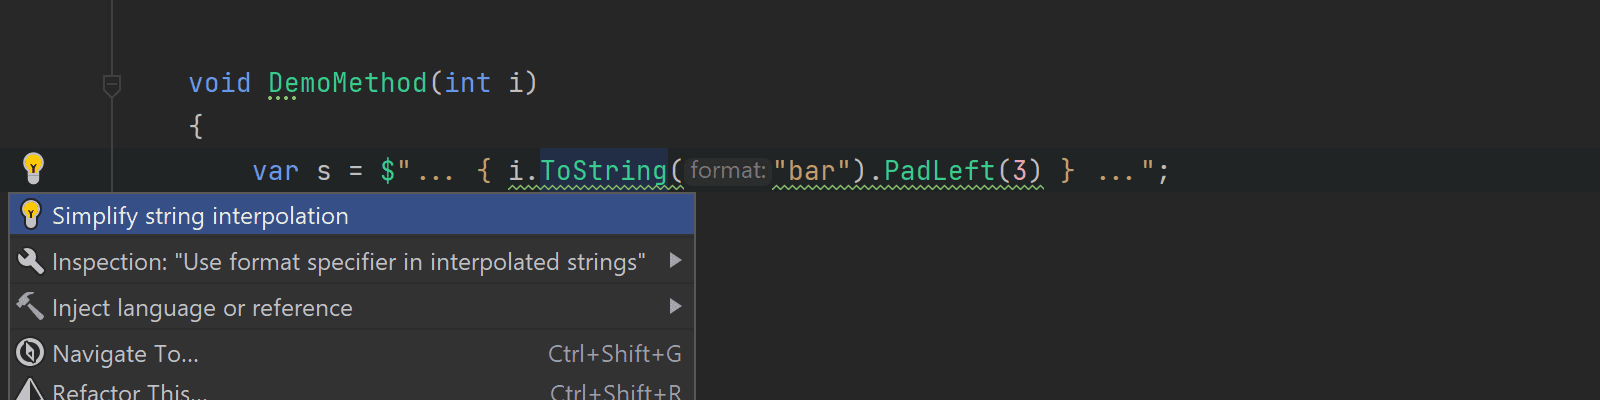
There is a new inspection, Simplify string interpolation, with a corresponding quick-fix to replace .PadLeft() and .PadRight() method calls with interpolated string placeholders with an alignment expression.
In addition to adding new quick-fixes, we significantly improved the daemon performance for files with huge methods inside:
- Methods with large/nested conditional expressions, tuple expressions, or
switchexpressions. - Methods with lots of type checks when nullable reference types are disabled.
- Methods with a lot of indexer accesses when nullable reference types are enabled.
- Methods with a huge number of closures when nullable reference types are enabled.
Now, the code analysis is completed faster for such files.
Better Support For SQL Language Injections
In this release, we improved the support for SQL language injections. We now support a lot of common cases where you write SQL code right inside C# code:
- SQL query strings are correctly resolved for
string.Formatmethods, string interpolations, and simple string concatenations. - There are no more errors on an
SQLParametervariable for parameters inside SQL query strings when using the Microsoft SQL Server dialect or the Dapper library.
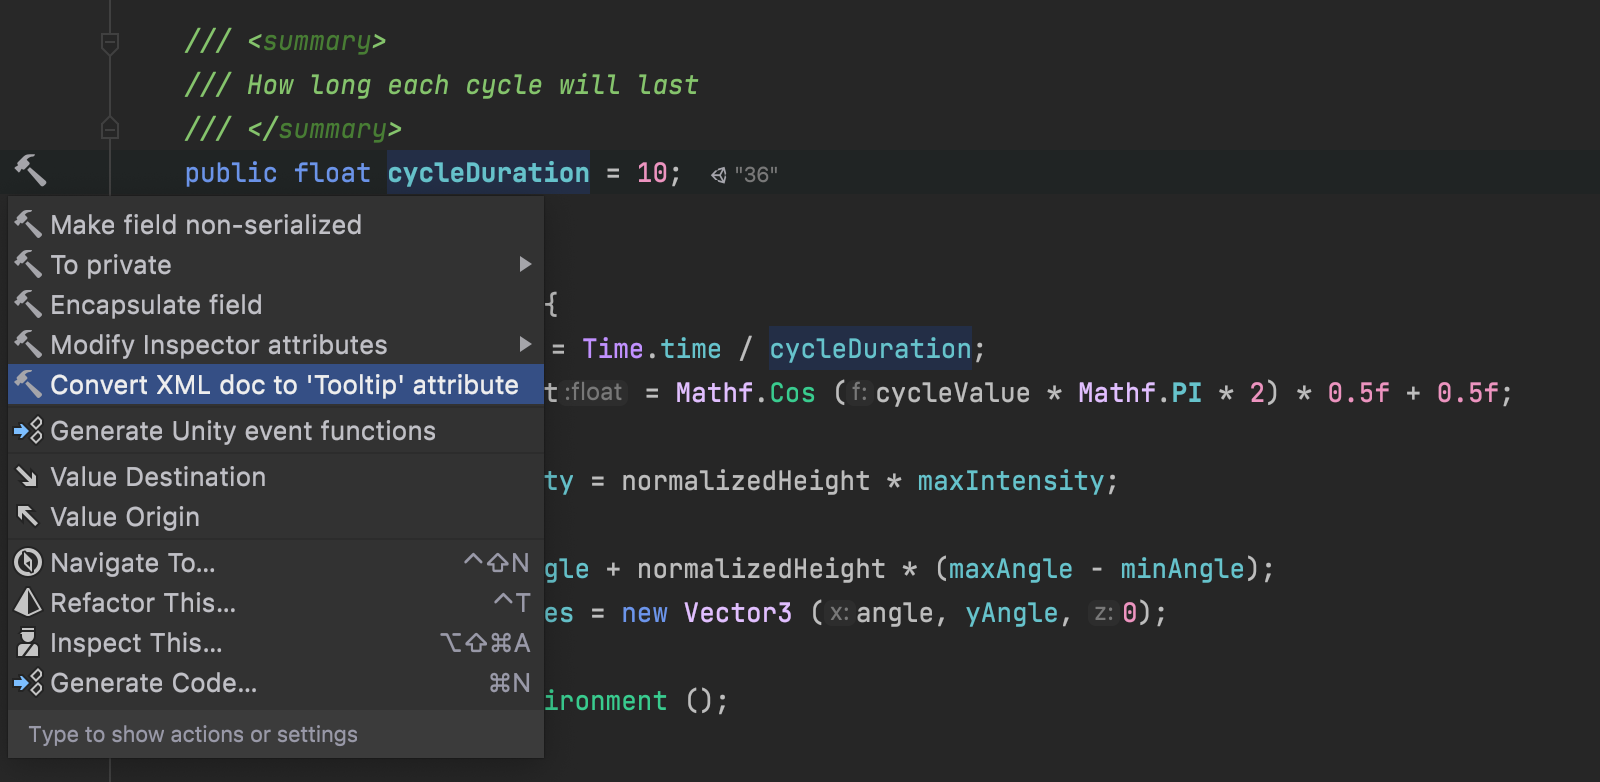
Unity Support
We’ve made a couple of small fixes for Unity support in this EAP, plus we’ve added a nice little feature to display the contents of a serialized field’s [Tooltip] attribute in the editor as a tooltip. There’s also an Alt+Enter context action to convert an XML documentation summary into a [Tooltip] attribute, so you’ll be able to see your XML docs in the Unity Inspector. There’s more to come in future EAPs!
Support for Apple Silicon Chips
Some time ago, we started an early preview for the Rider “Apple Silicon Edition” build, which natively runs on Mac computers with Apple silicon processors. Starting from this EAP, this support is included in the regular Rider and will be delivered as part of our EAP and release pipelines. The first EAP build uses the following runtimes:
- The Apple silicon–compatible JBR (JetBrains Runtime) for the frontend.
- The .NET6 RC1 for the backend.
Project and Solution Properties
Now, let’s look at what’s new in the Project Settings dialog:
- You can specify an application icon in the Resource section on the Application page.
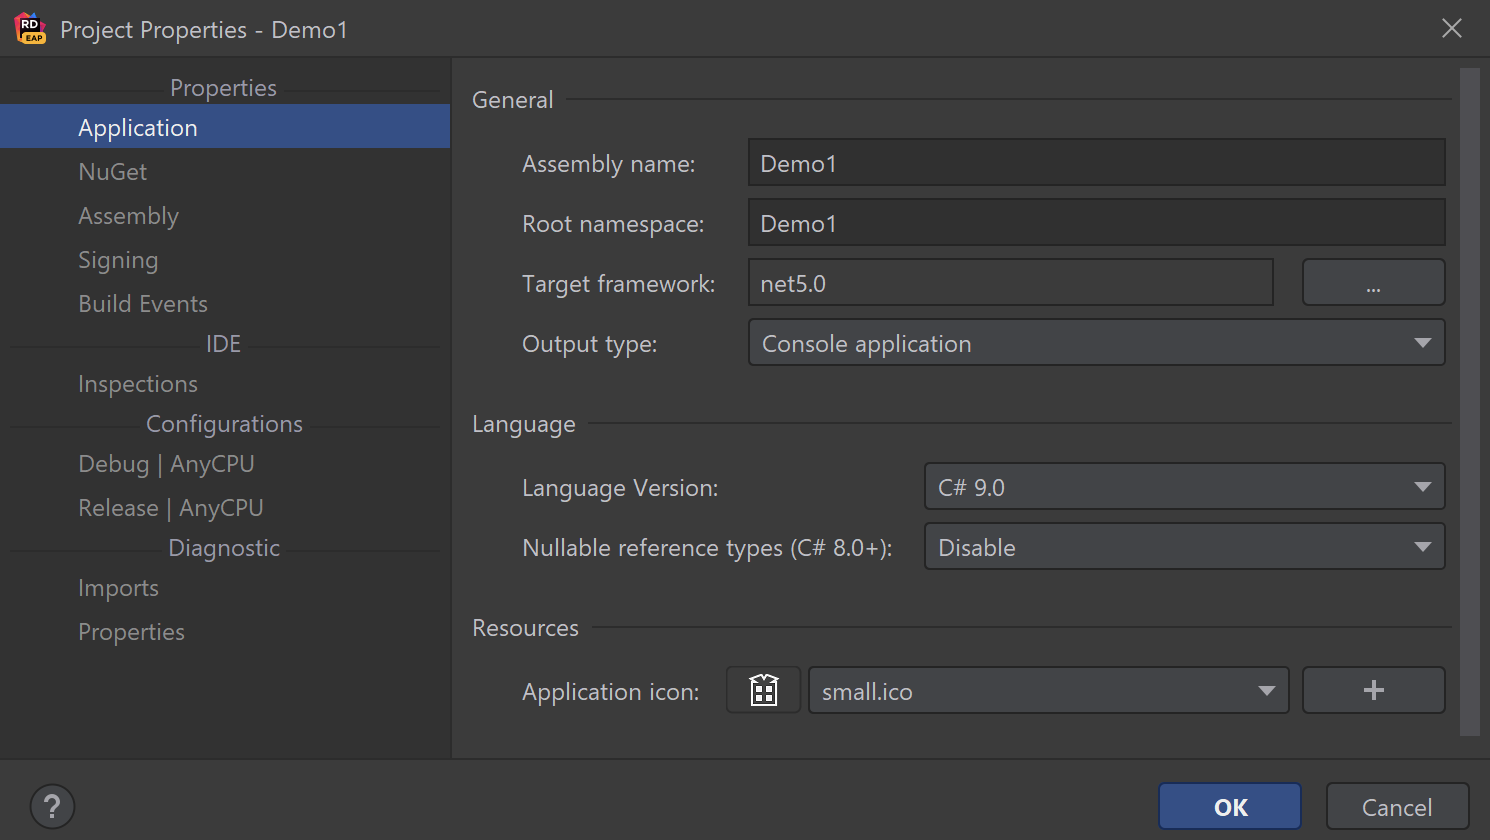
- There is a new Build Events page to specify commands to run for before and after build.
- The Inspections page gets several project properties related to code analysis: Localizable, Localizable inspector, and Solution-Wide inspections.
- You can configure reference paths for a project on the Reference Path page.
The Solution Properties dialog has a new Dependencies column in the table to specify build dependencies for each project.

Run Configurations for Publishing
Starting from the 2021.3 EAP, Rider imports all .pubxml files from Properties/PublishProfiles on project loading and converts them to run configurations. Whenever you add a new .pubxml, a new run configuration is generated automatically. There is no more need to create these run configurations manually!
If you’re ready to download and try out this build, there are a few ways you can take part in this 2021.3 EAP:
- Download and install the EAP build from www.jetbrains.com.
- Or, go with our Toolbox App.
- Or, use this snap package from the SnapCraft store (if you are using a compatible Linux distro).
We’d love to hear your feedback! Please add your comments below.