.NET Tools
Essential productivity kit for .NET and game developers
Monitoring Tool in Rider 2024.1 EAP 4

With the latest release, Rider gets an integrated monitoring tool that provides real-time tracking of your .NET application’s behavior as it runs.
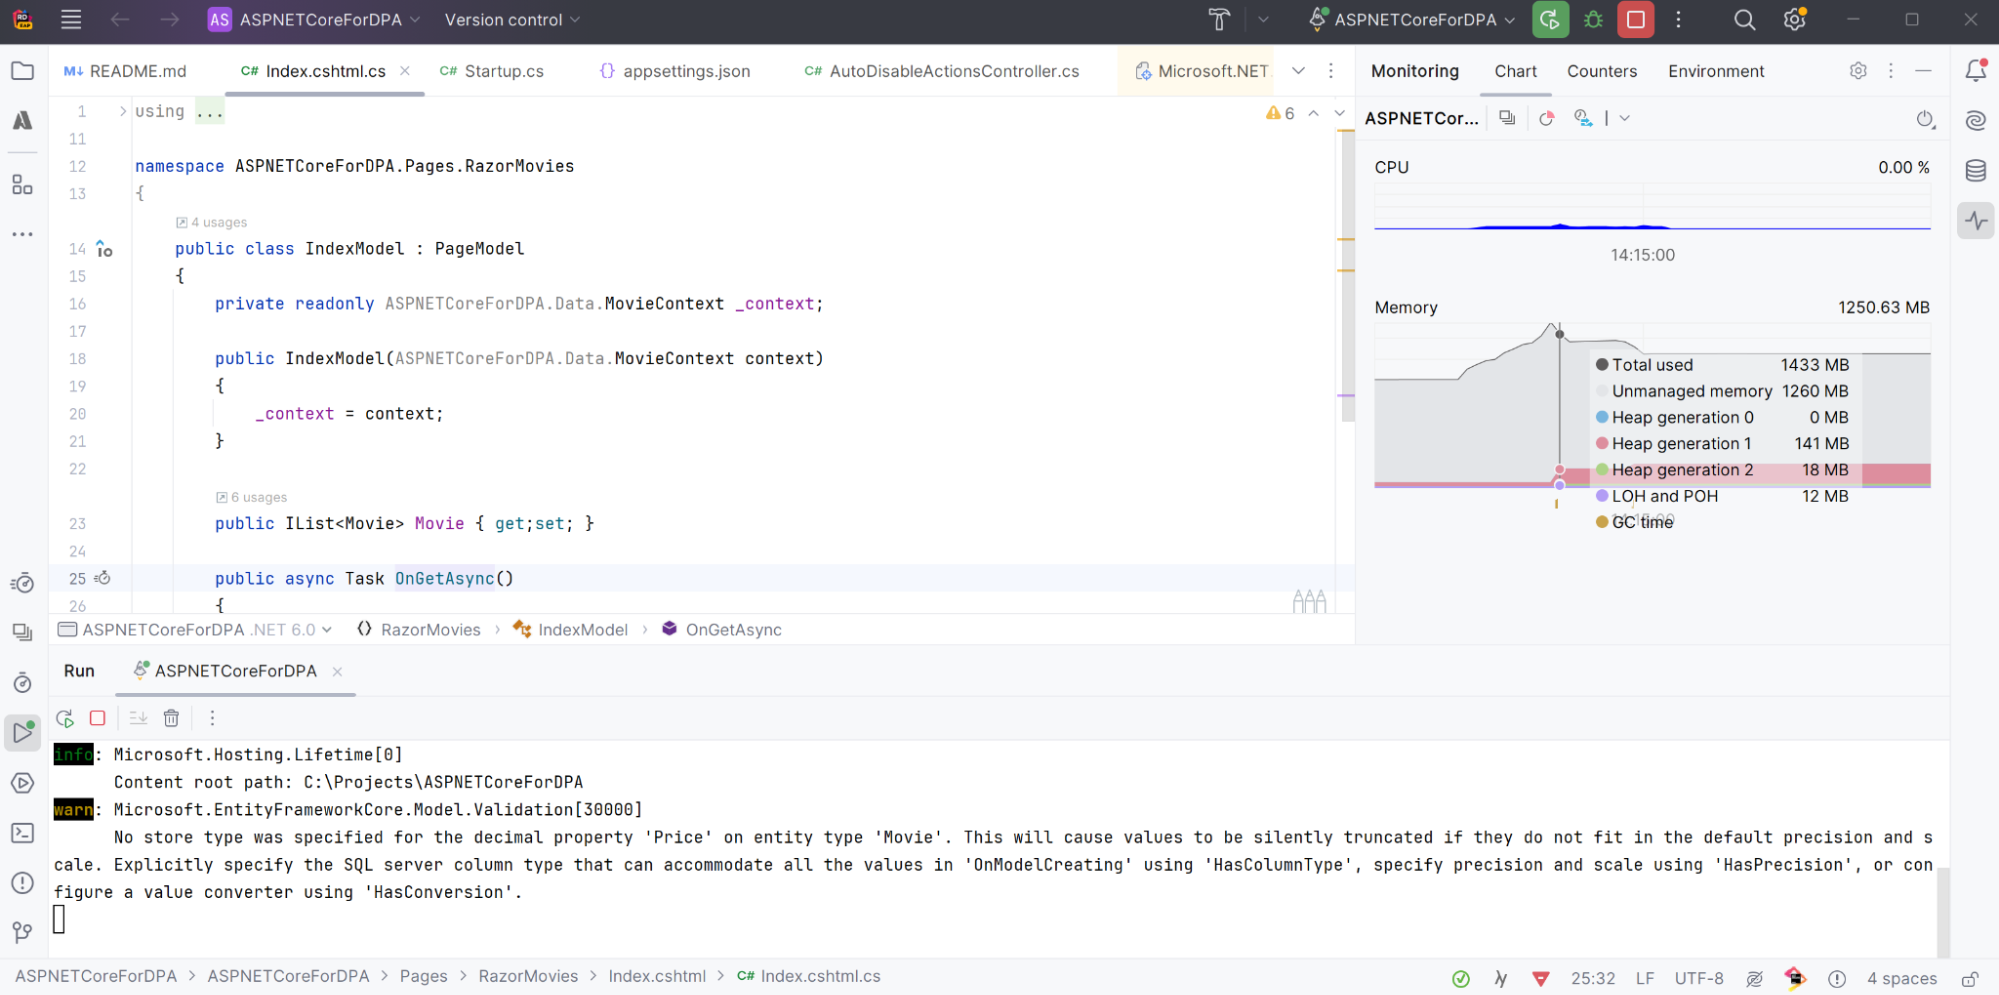
The Monitoring tool window
The new Monitoring tool window is displayed each time you run or debug your .NET project in Rider.
Major operating systems are supported (Windows, macOS, Linux). Check our web help for a list of supported frameworks and runtimes.
Profiling made easy
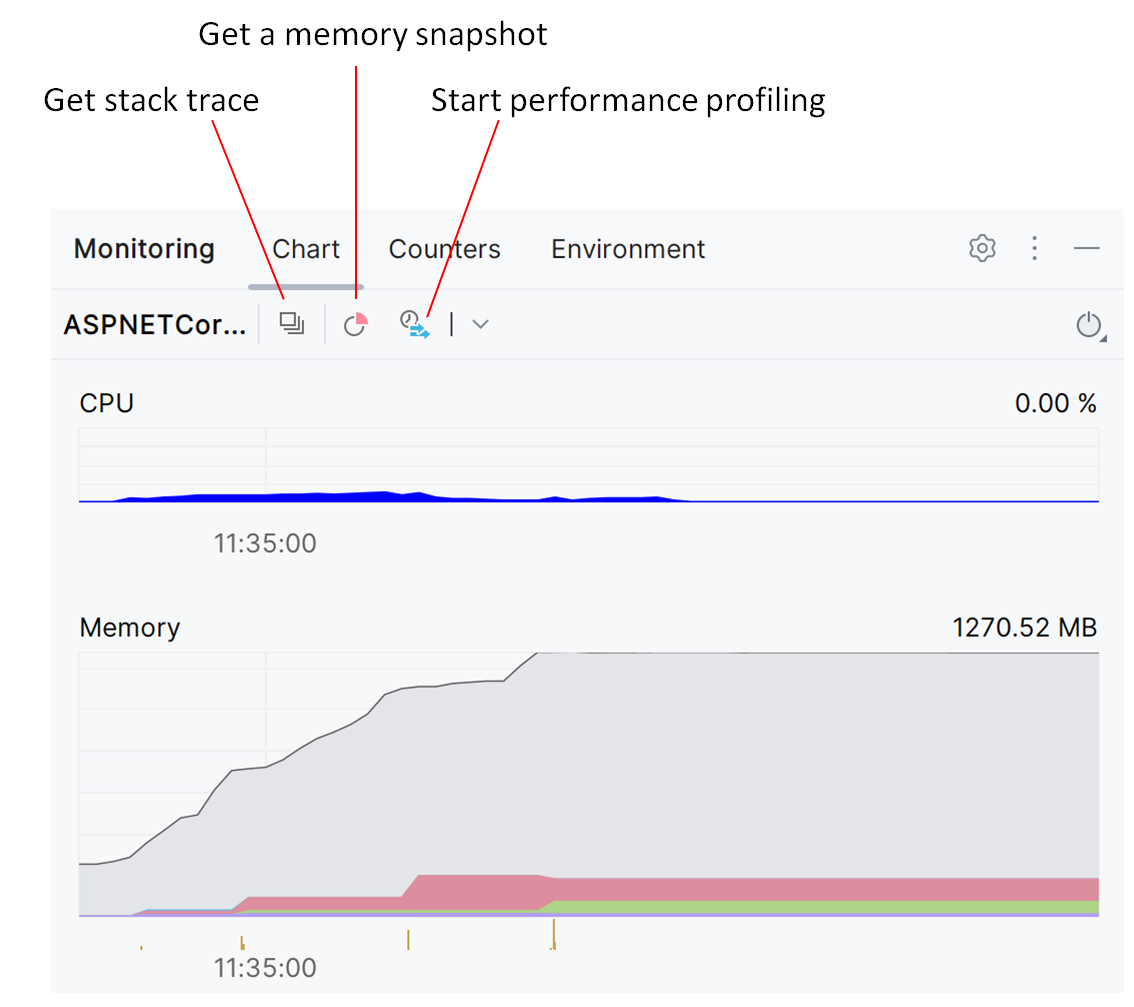
Profiling your .NET project just got much easier. With just a single click in the Monitoring tool window, you can:
- Get stack trace data. The stack trace will be automatically opened in the Stack Trace Explorer. This might be helpful, for example, when you encounter unexpected UI freezes and want to investigate potential thread locks.
- Get a memory snapshot. Have you noticed a spike in memory usage or frequent garbage collection events? You no longer need to start a memory profiling session to address the problem – just click a button to get a snapshot. Once the snapshot is collected, it’ll be opened in the dotMemory Profiler.
- Start performance profiling. The same applies to performance profiling – you can start collecting sampling or timeline profiling data and open it in the dotTrace Profiler.
CPU and memory charts
The Chart tab displays real-time data:
- The CPU chart not only shows CPU usage but also places application exceptions on the same timeline.
- The Memory chart shows heap sizes as well as garbage collection events.
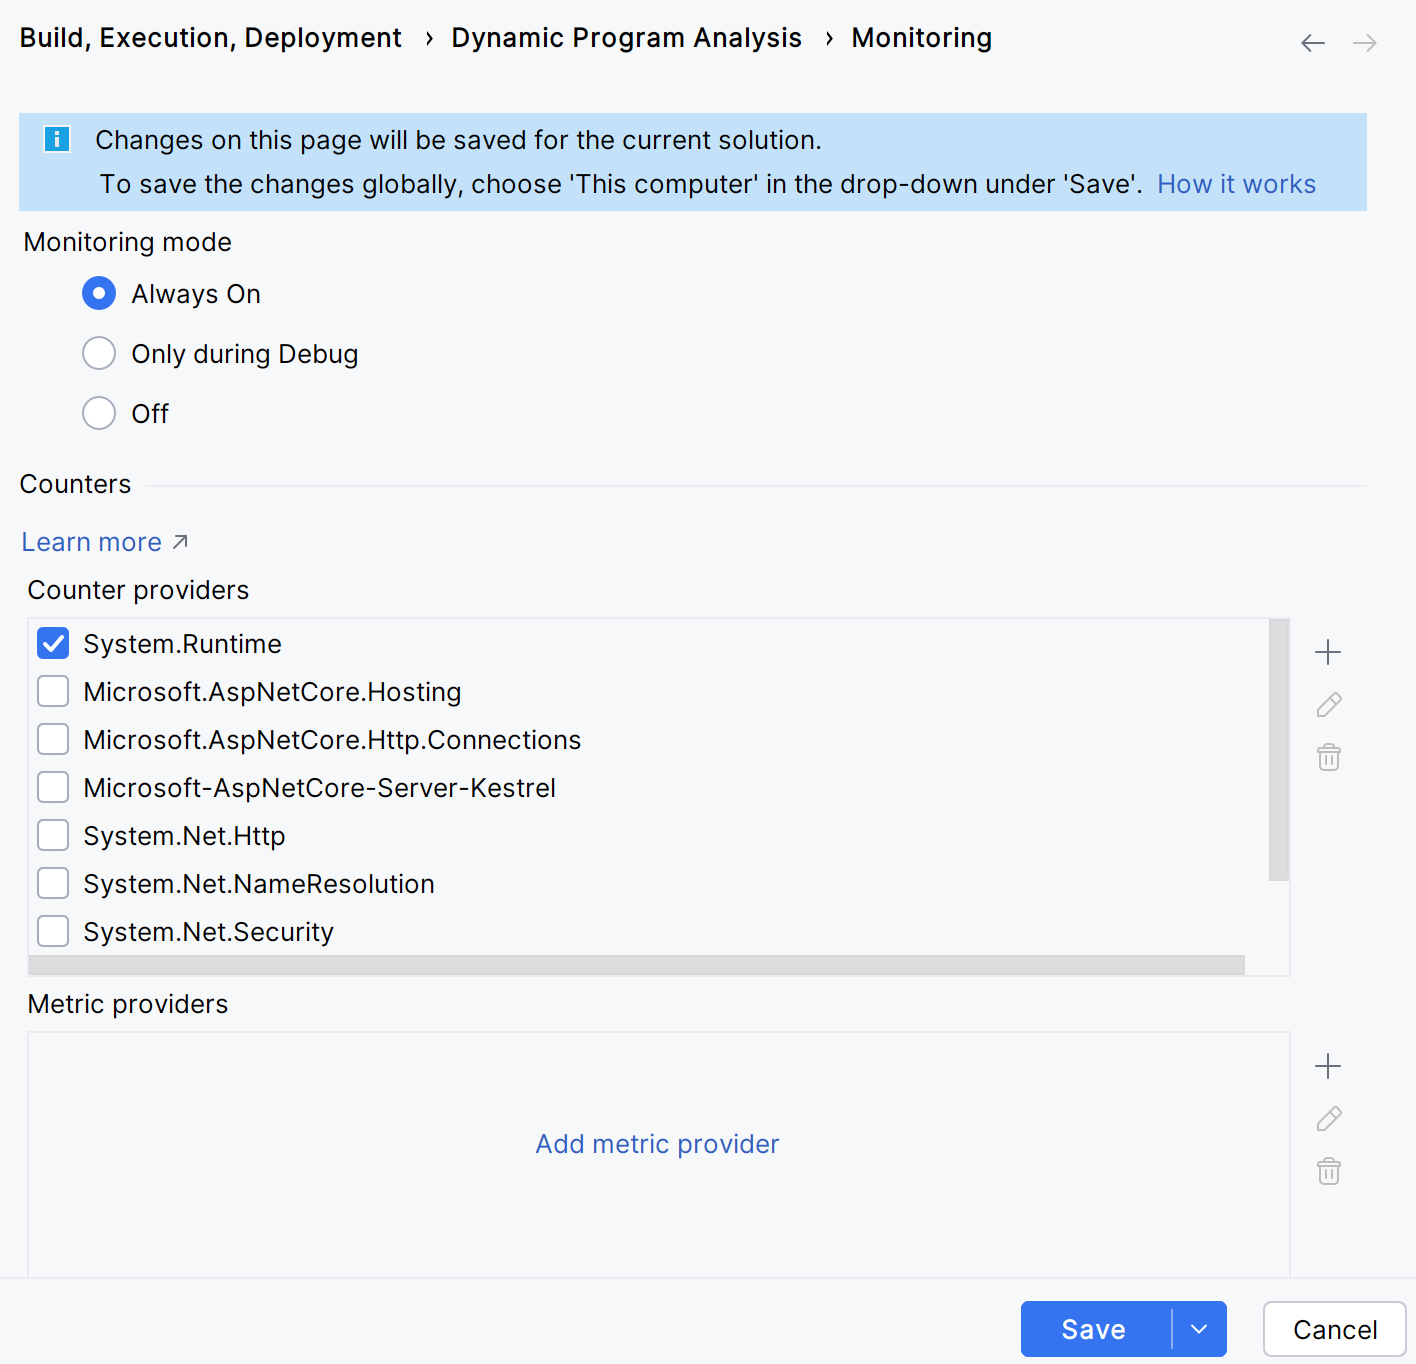
Counters and metrics
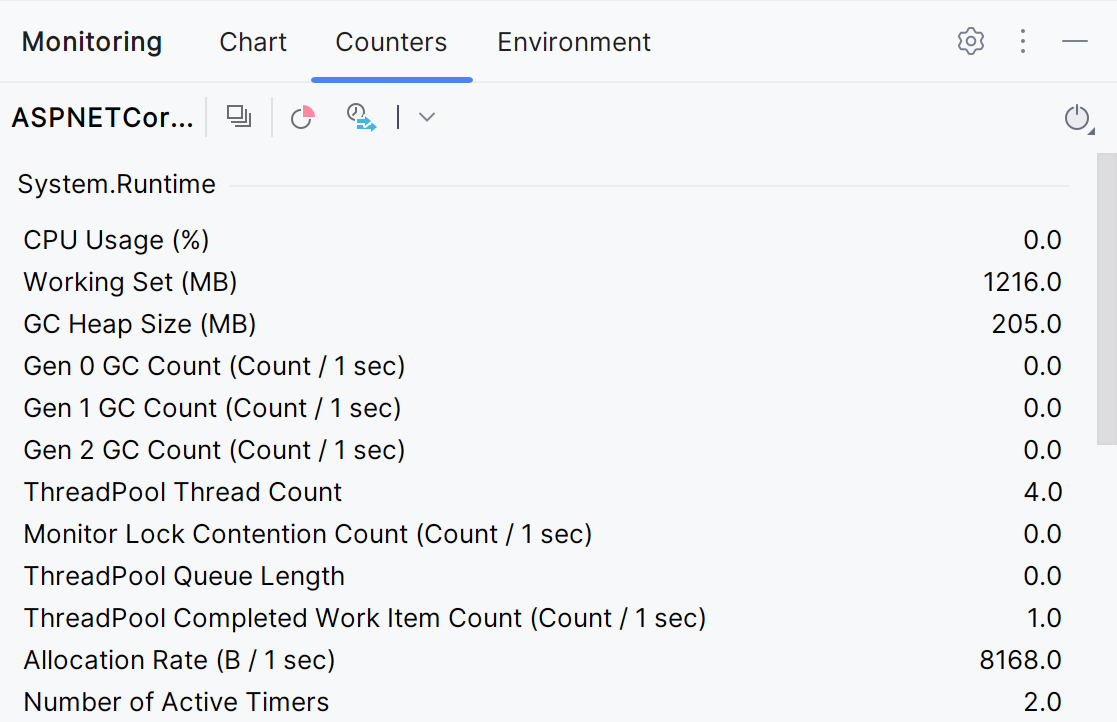
The Counters tab feeds you live data from various counter and metric providers. In Settings | Build, Execution, Deployment | Monitoring, you can customize the providers list. If your libraries provide their own metrics, you can include those too.
Environment data
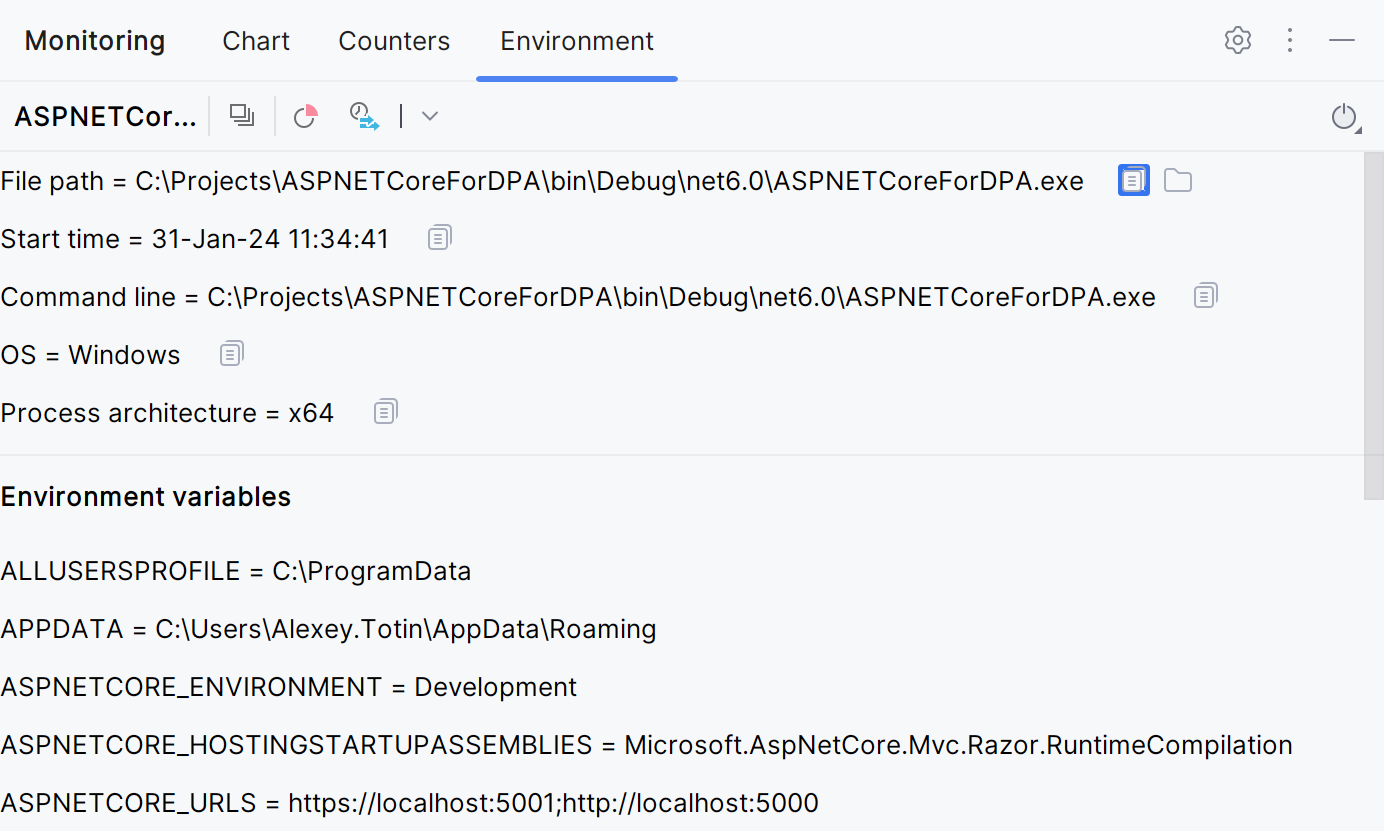
The Environment tab lays out everything from operating system details to environmental variable values.
Turn monitoring on and off
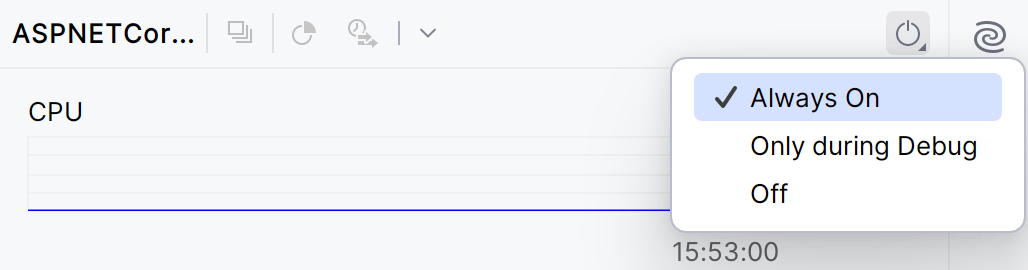
Choose whether you want to monitor all runs, just debug sessions, or disable monitorin entirely. Everything is controllable from the Monitoring tool window. Re-enabling monitoring is just a click away via Settings.
Your feedback
The Monitoring tool window has been introduced as a direct response to a common request from our community, and it’s something we’ve eagerly anticipated ourselves. We’re keen to hear your feedback on what’s missing or what could be improved in the comments below!