.NET Tools
Essential productivity kit for .NET and game developers
ReSharper Ultimate 2016.3 EAP 9 and 10
With all the excitement of releasing the first public EAP build of Rider last week, we didn’t post about ReSharper Ultimate 2016.3 EAP 9. And now we’ve released EAP 10, so let’s get caught up!
Visual Studio 2017 RC
ReSharper Ultimate products now have initial support for Visual Studio 2017 RC, including the new .csproj based .NET Core projects. It’s important to note, however, that even though VS2017 is marked as “RC”, there are a number of features and architectural changes that are currently marked as “preview”. As such, we are still working on support for some of these new Visual Studio features, such as lightweight solution load and opening from folder.
Similarly, the new .csproj based .NET Core project system is marked as “alpha”, and while we support loading projects in this format, there are what we can euphemistically call “rough edges”. One such example is unit testing, which is no longer compatible with how it was run in the project.json world. Existing project.json based testing is of course still working.
A much more serious issue is that changes to the project model means that ReSharper C++ doesn’t currently work with VS2017 RC, at all. We currently recommend against updating to VS2017 RC if you wish to continue using ReSharper C++.
dotCover
Improved highlighting in Continuous Testing sessions
The other big news is that we are now introducing a much requested feature for Continuous Testing — improved highlighting!
ReSharper Ultimate users can enable Continuous Testing to run only the tests that are affected by your current code changes, based on dotCover coverage data (and don’t forget ReSharper Build to speed up the build cycle!). Our previous highlighting left a little to be desired, so we’ve updated it.
We now display a marker in the text editor showing red if any tests related to this change are failing, green if all tests are passing and grey if there are no tests covering this line of code. And when a result is outdated, because the test, or a line of code related to that test has changed, the markers are shown faded.
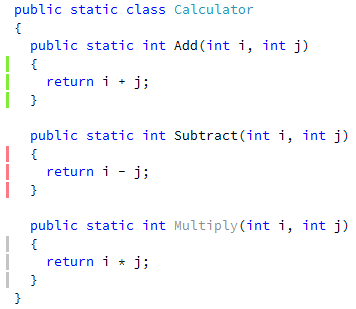
Hovering over the marker highlights the associated region of code and gives a quick summary of the state of change. Clicking on the marker shows a popup with the list of tests that affect the current line. It also includes a small toolbar to rerun all associated tests, only dirty tests, and to run or debug any selected tests. Even better, you can insert a break point and start debugging with a single click.
Double clicking a test in the list will navigate to the test in the results window, and clicking the arrow to the right of a failing test will open a flyout window with failure and exception details, all clickable, of course.
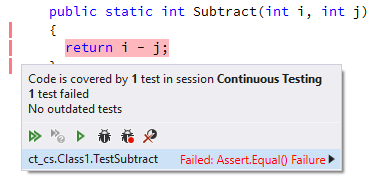
(Note that there appears to be a high DPI issue here. If you have DPI set to 200%, then the list of tests doesn’t appear. We’re investigating, and will get it fixed in a future EAP build.)
Revised filtering settings
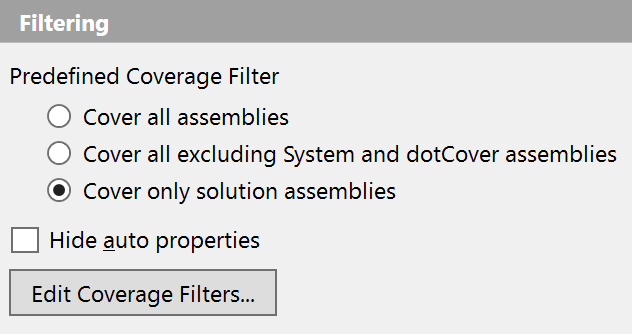
This build of dotCover also introduces a new Filtering options page that allows easy selection of what code should be covered – all assemblies, everything except System and dotCover assemblies or only solution assemblies, without dependencies. It also allows hiding auto properties from coverage results, and allows editing filters based on assembly name, namespace, typename or attribute.
ReSharper
Transform Parameters refactoring
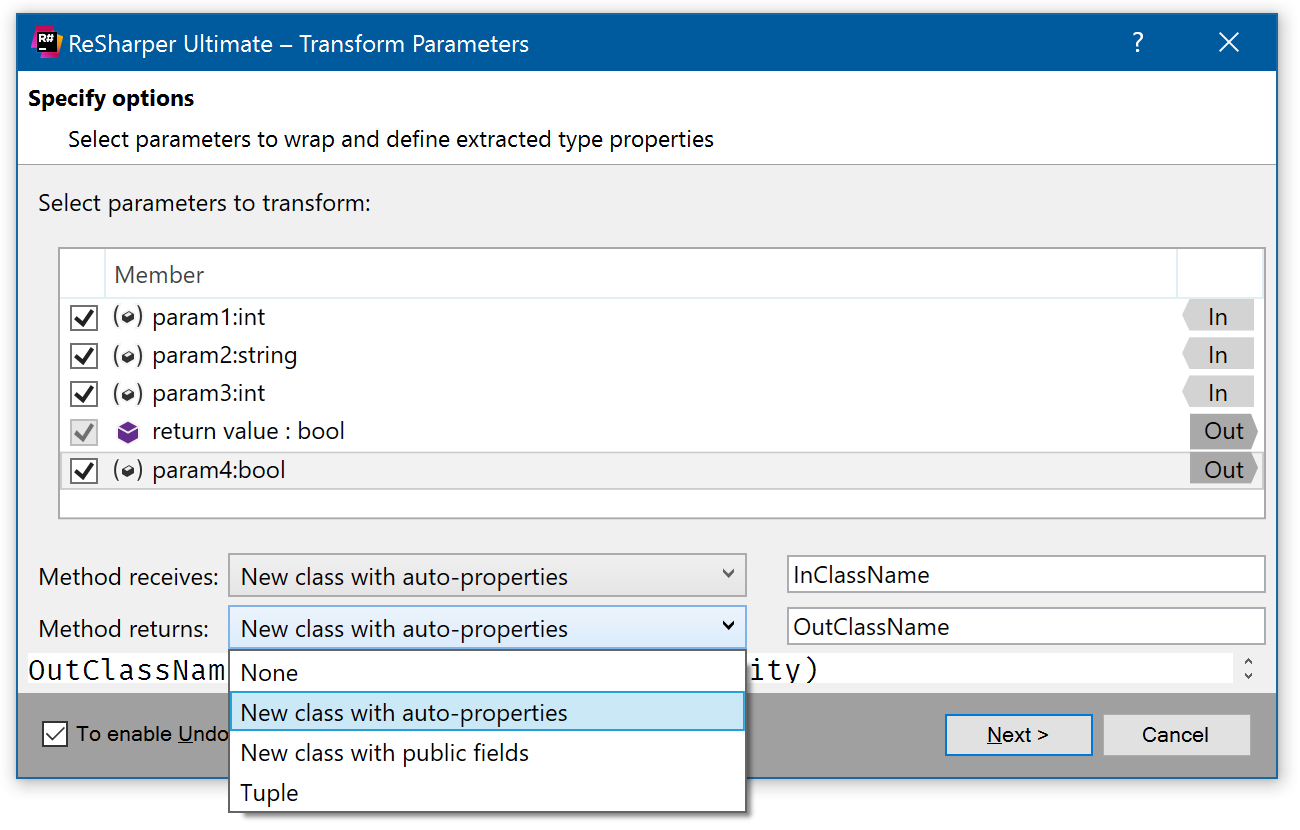
C# support gets a new refactoring, Transform Parameters, which takes existing two refactorings – Transform Out Parameter and Extract Class from Parameters – and merges and improves them. The new Transform Parameters refactoring can be invoked on a method declaration and will rewrite the method’s parameters, changing incoming parameters to a new class, or a tuple, and optionally creating a new class for return value and any out parameters.
Quick-fixes to introduce fields and properties
Next, we have a new quick-fix to introduce fields and auto properties from all unused parameters. This is an extension to the existing quick-fix that will introduce a field from a single constructor parameter, but if you extend the Alt+Enter menu item, it will now apply to all unused parameters at once.

The Introduce property quick-fix also includes a Configure default menu item, which will set what kind of property is generated by default – get only, mutable, with private setter, etc.
More new and updated code actions
C# gets another couple of small updates. Firstly, the Generate constructor action gets a small update with an option to check parameters for null. If checked, it will generate guard code that throws ArgumentNullException in the constructor.
And secondly, a new context action on fields of type Lazy<T> will introduce a property to encapsulate fieldname.Value.

TypeScript
TypeScript support gets code completion for literal types, as well as a number of formatting fixes for JSX/TSX files.

To-do item colors
And finally, we’ve fixed a minor irritation: to-do items displayed in one colour in the editor, and a different colour in the To-do Explorer! Now each to-do pattern can have a category – “Normal”, “Edit”, “Error”, “Question” or “Warning”, and each category can have its own colour, which is reflected in the To-do Explorer, the editor and can be configured in Visual Studio’s Fonts and Colors options page.
ReSharper C++
Postfix templates
ReSharper C++ gets some postfix template goodness, with new templates for if, else, while, do, return, switch and foreach. If you’re not familiar with postfix templates, the idea is that they allow you to focus on your data, rather than the syntax.
Typedef refactorings
This build also introduces a couple of new refactorings: Introduce typedef and Inline typedef. Simply highlight a typename and select Introduce typedef from the Refactor this menu (or use Ctrl+R, I) to introduce a typedef. The Inline typedef refactoring will do the inverse – replace an existing typedef with the actual type.

Finally for C++, there’s a small fix to automatically update unit tests when a file is changed externally to the IDE, such as updating from source control.
dotTrace
Events and subsystems in Timeline Viewer
dotTrace’s Timeline view has had a fairly major update with the introduction of subsystems, and the reworking of some of the filter categories.
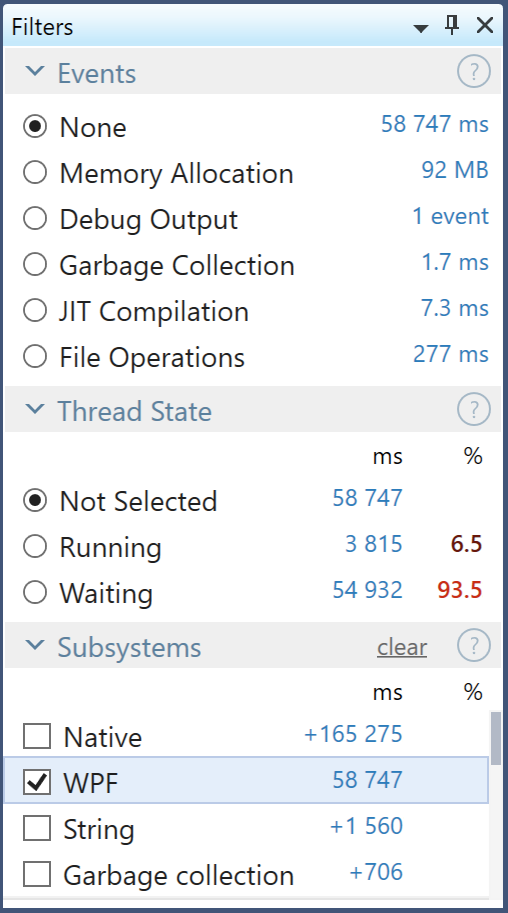
Firstly, the Interval Filters and Analysis Subject filter groups have been merged into a new Events group, which allows filtering by time, memory allocation, debug output (new to this build), garbage collection, file operations, SQL queries and so on.
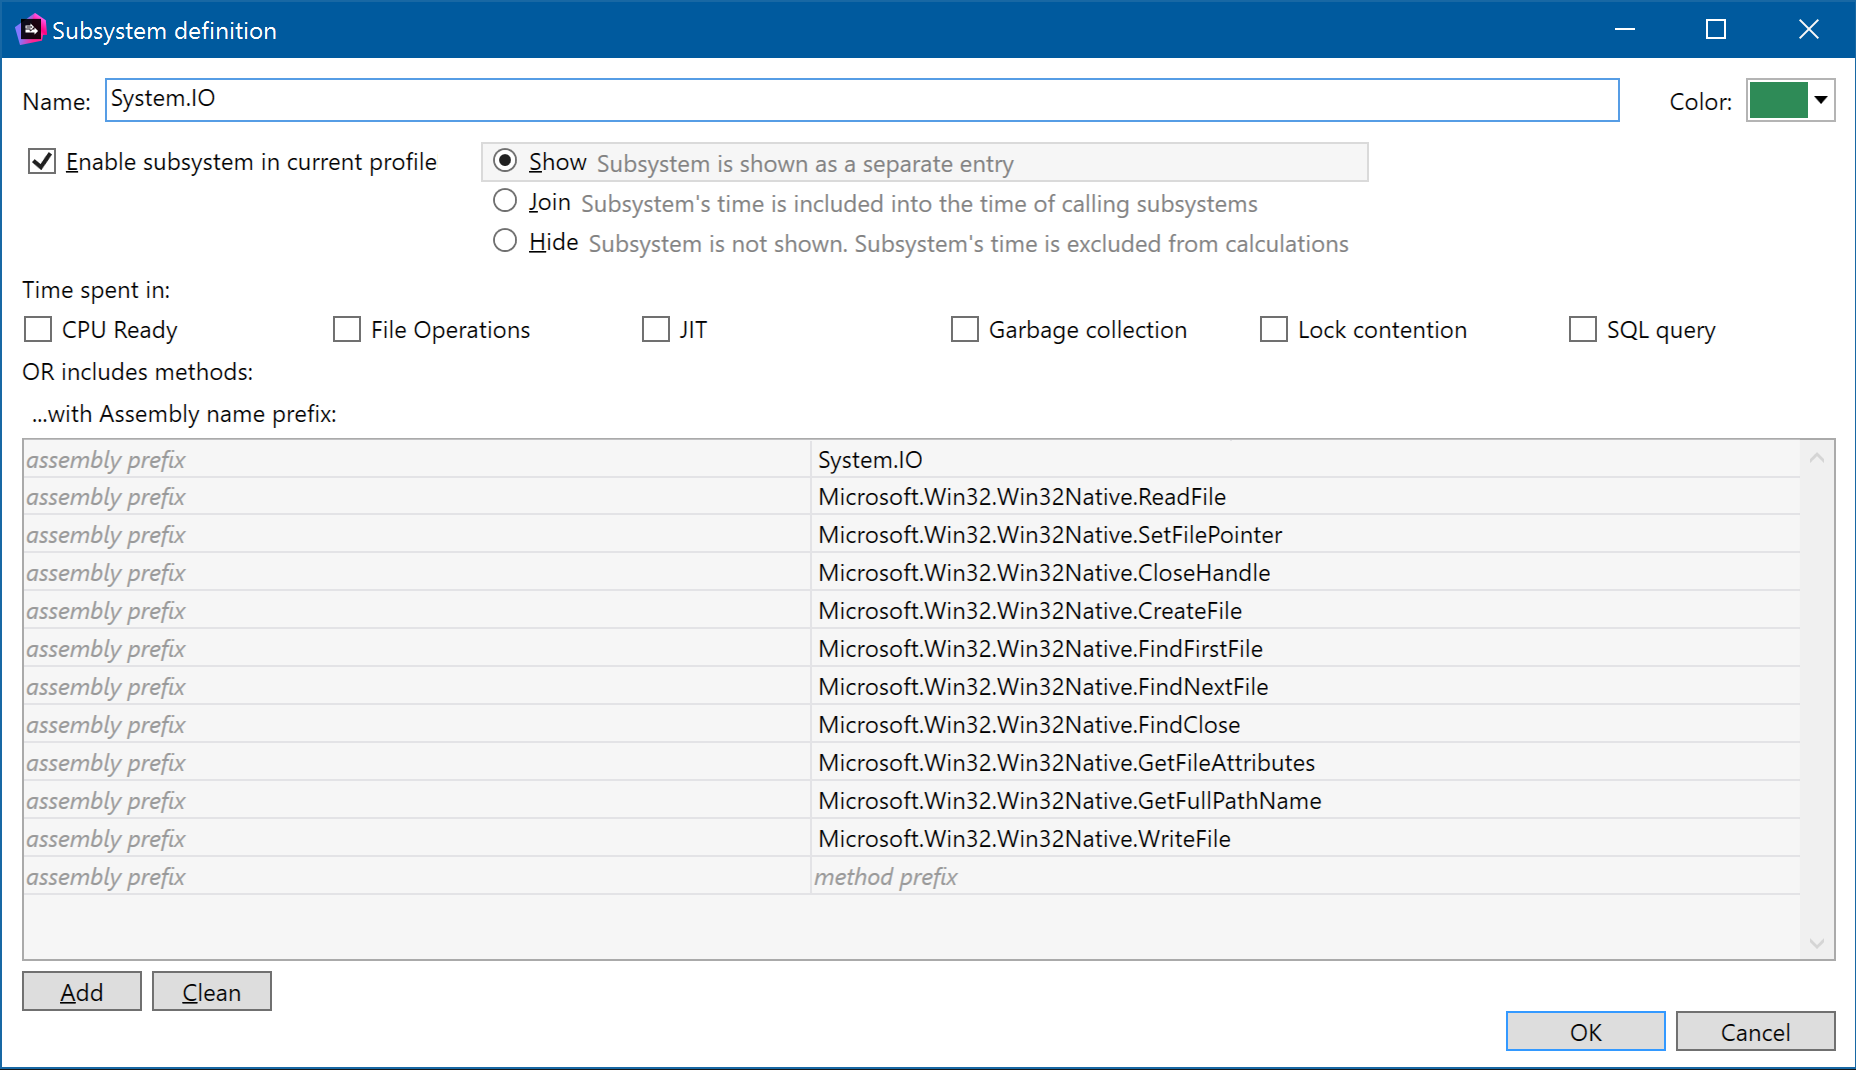
And secondly, we’ve introduced Subsystems as a set of filters, which you may be familiar with from dotTrace’s other profiling views. Subsystems group methods by namespace and assembly, to categorise code such as WPF, string handling or collections. We’ve extended this to also include time spent in file operations, JIT, garbage collection, SQL queries and so on, to allow a very flexible way of categorising a filter.
This is a really helpful way of classifying where time is being spent, giving you an immediate view on what areas require attention: for example, you could see that your code needs to improve string handling, or is spending too long working with collections.
Call Stack view updates
We’ve also made some subtle but really useful changes to the Call Stack view. The methods pane now also shows what proportion of time is spent in various subsystems. Clicking on the subsystem name will enable the equivalent subsystem in the Filters pane, updating the visible methods and call stack to show the methods which end up calling into the subsystem.
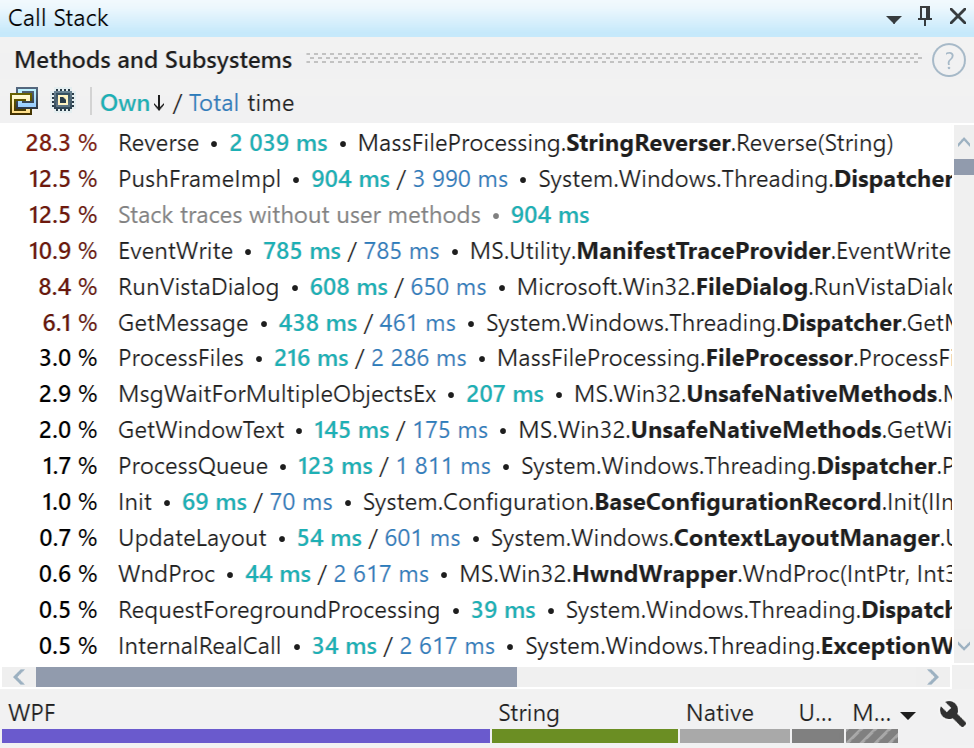
The methods pane now has a new toolbar which includes a button to follow the selection in the call tree, filtering the list of top methods. There is also a button to toggle showing system functions as separate items, rather than rolling the time spent into the calling method. And finally, there is a button to toggle sorting, by either top method based on own or total time.
Download
Please download the latest ReSharper Ultimate 2016.3 EAP build, and if you come across any problems with this build, please let us know.
