.NET Tools
Essential productivity kit for .NET and game developers
Releases
Rider
Rider Starts Its Early Access Program for 2020.3
Hello everyone,
Welcome to the early access program of our third release of the year, Rider 2020.3.
The highlights of the first EAP build include more advanced C# 9 support, new debugger features, and UX improvements. Let’s look into the details.
UX improvements
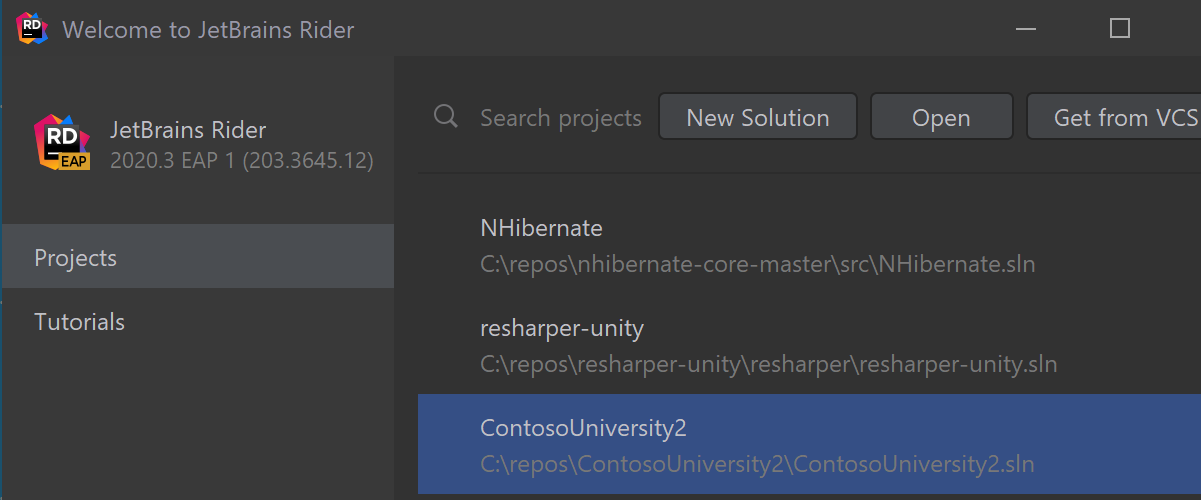
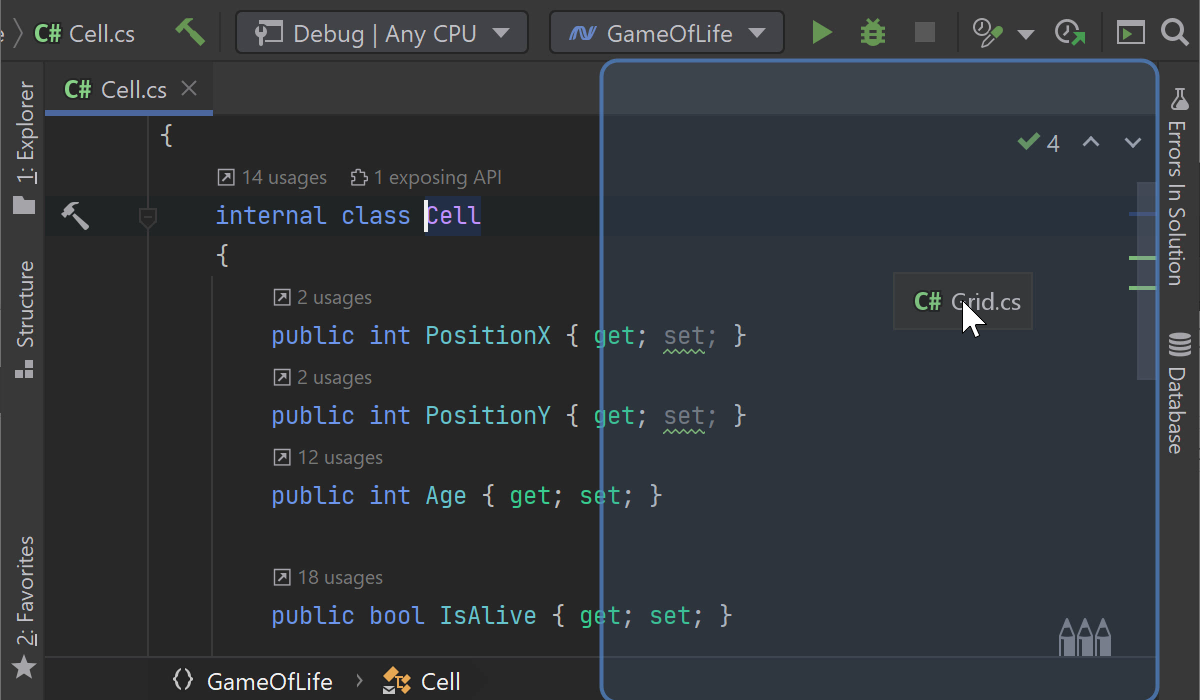
- The most obvious update is the redesigned Welcome screen. More is less: we’ve tried to make the first window you see in Rider as neat and uncluttered as possible. It offers only the most common operations.
- A long-awaited improvement has made it into the code editor: now you can split the editor by dragging and dropping a tab to the side of the main editor window. Pinned tabs are now always displayed on the left-hand side of the tab bar.
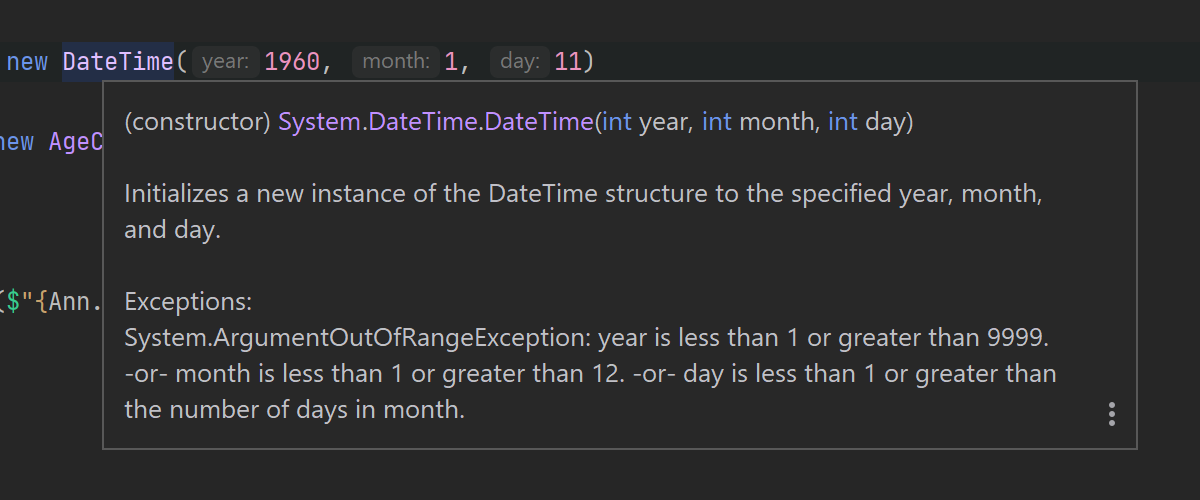
- A nice UI improvement in tooltips: we’ve implemented syntax highlighting to make it easier to read and understand the tooltip.
C# 9 Support
- For top-level statements, Rider not only provides some basics, like code completion and code analysis, but also offers a couple of handy quick-fixes and refactorings.
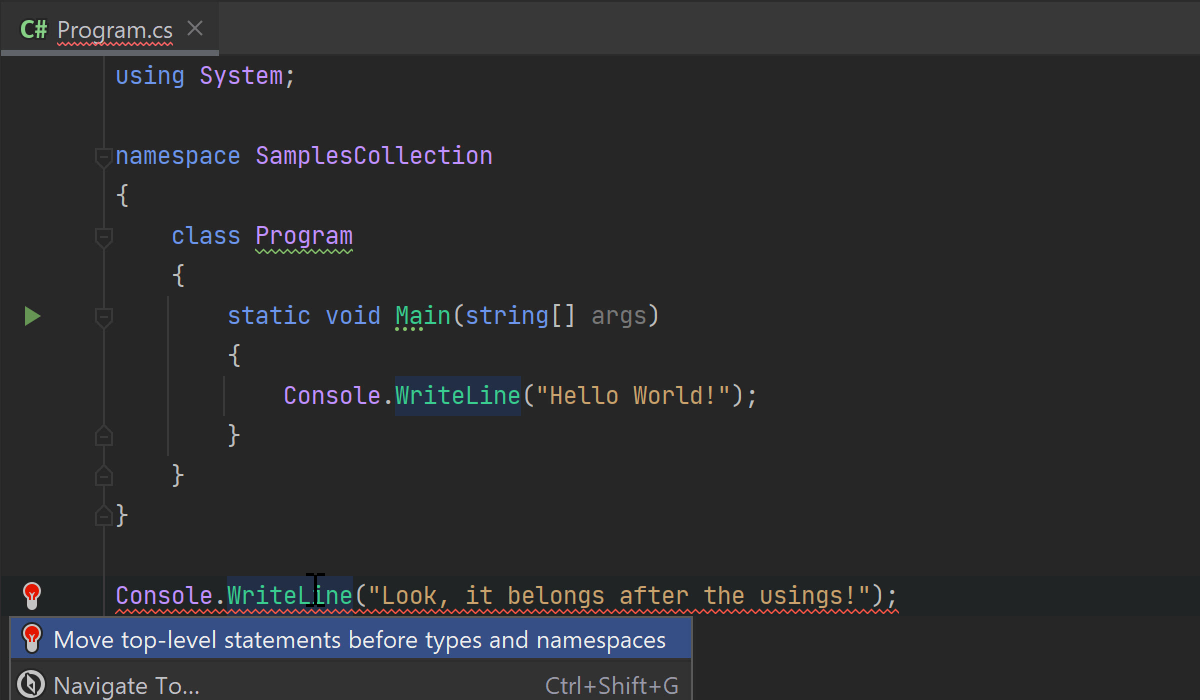
When copy-pasting pieces of code, we often don’t care about placement. However, C# 9 requires top-level statements to precede any type or namespace declarations. Fortunately, Rider can help you correct the placement with the Move top-level statements before types and namespaces quick-fix.
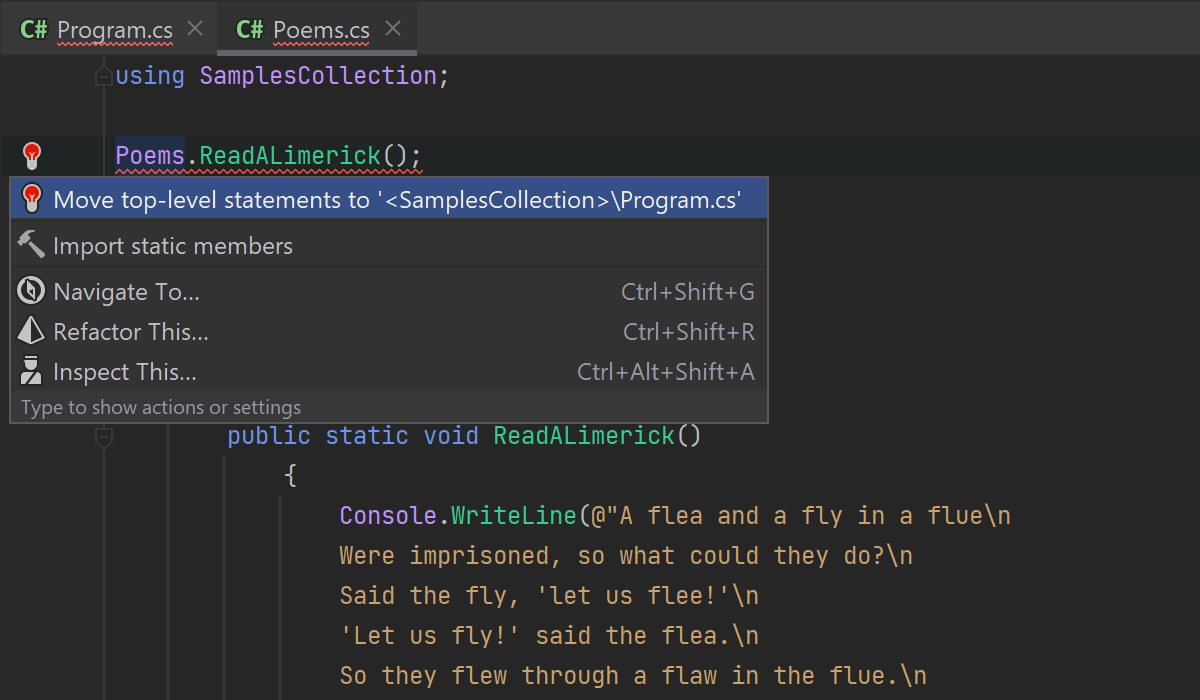
Because top-level statements implicitly declare the entry-point of a program, only a single file in the project can contain top-level code. If this requirement is not met, Rider allows you to move top-level statements to another file.
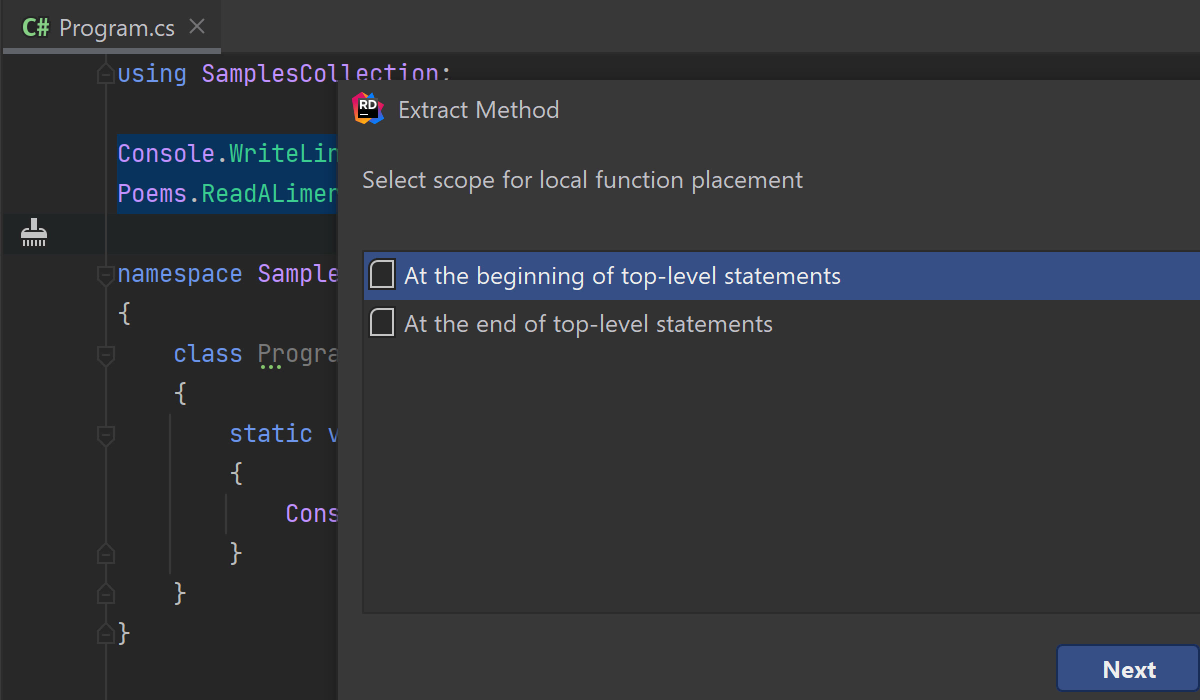
Finally, the Extract local variable and Extract method refactorings are available in the top-level context.
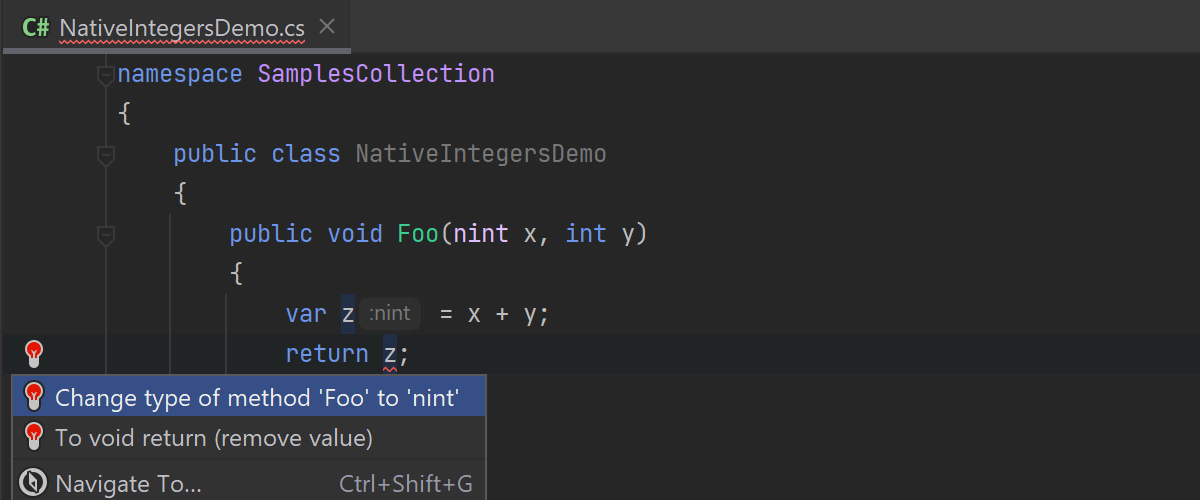
- Native integer types,
nintandnunit, are supported in our code analysis, completion, and code editor features.
- C# 9.0 makes conditional expressions target-typed. With this change, the two expressions need not have an implicit conversion from one to the other, as long as they are both implicitly convertible to a target type. Notice how Rider doesn’t highlight the following code with error squiggles.

- Finally, we’ve supported the
[DynamicallyAccessedMembersAttribute], so that Rider does not highlight any entities mentioned in the attribute as unused.
Debugger
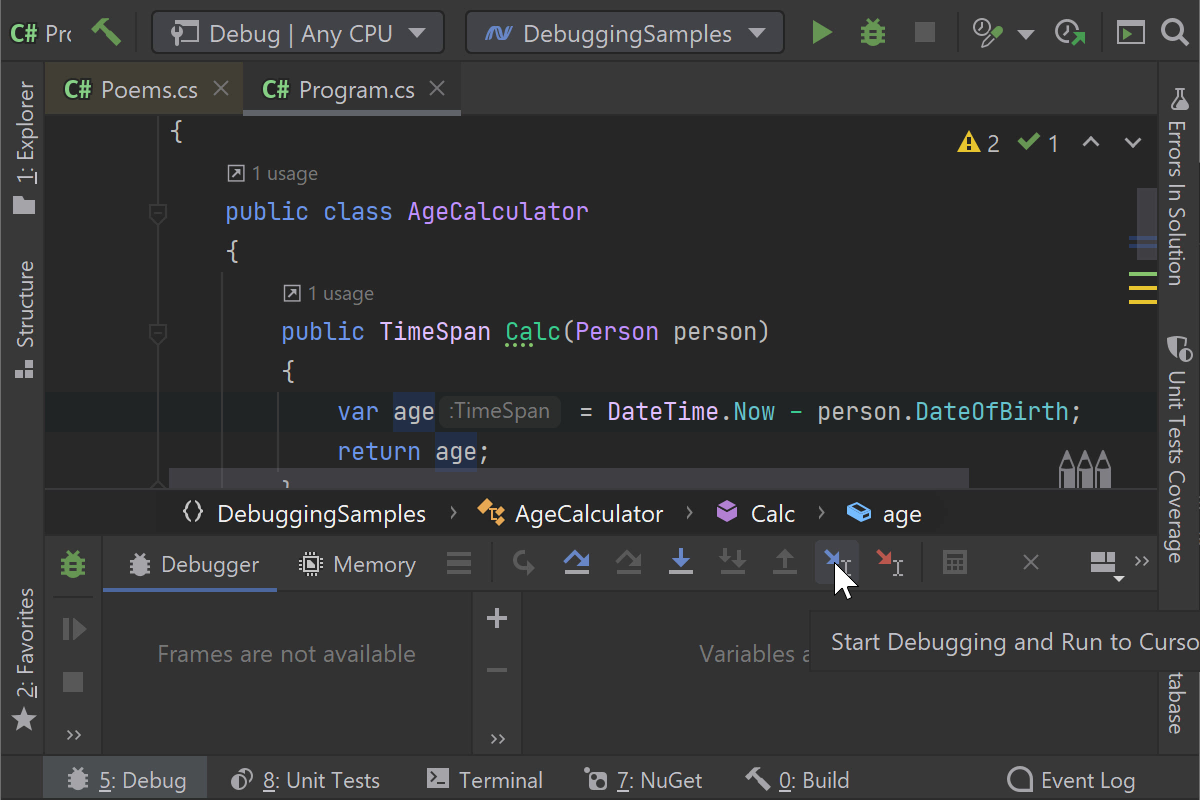
- Now, you don’t have to start debugging and navigate through several steps to the method or a place in code you’re interested in. Use our new debugging actions – Start Debugging and Step Over, Start Debugging and Step Into, Start Debugging and Run to Cursor, or Start Debugging and Run to Cursor Non-Stop. Rider will take you there, skipping external method calls or breakpoints if the appropriate action was used. You can find these actions under Run / Debugging Actions in the main menu or on the Debug tool window’s toolbar; alternatively, you can use the hotkeys. Please note that in web applications, this feature is available for a .NET Project configuration / .NET Static Method only.
Plugins
- We also have several improvements for Unity developers. The
[Explicit]attribute for tests is now handled correctly: the tests aren’t run unless you specifically launch them. ParameterizedTestFixtureswith parameterized tests are also handled. In other areas, Refresh Assets isn’t started if there’s no connection to Unity, so you won’t get an infinite ‘Refreshing solution in Unity Editor’ message anymore. Finally, we’ve improved the UI of the Unity Log Viewer. - With the Azure DevOps plugin, you can now create a new server workspace or import an existing one. We’ve also optimized the performance of the Add and Rename operations.
- The Dynamic Program Analysis (DPA) plugin collects memory allocation data not only when you launch Run or Debug, but also when you attach the debugger to a process. This can be useful, especially for attaching to IIS processes.
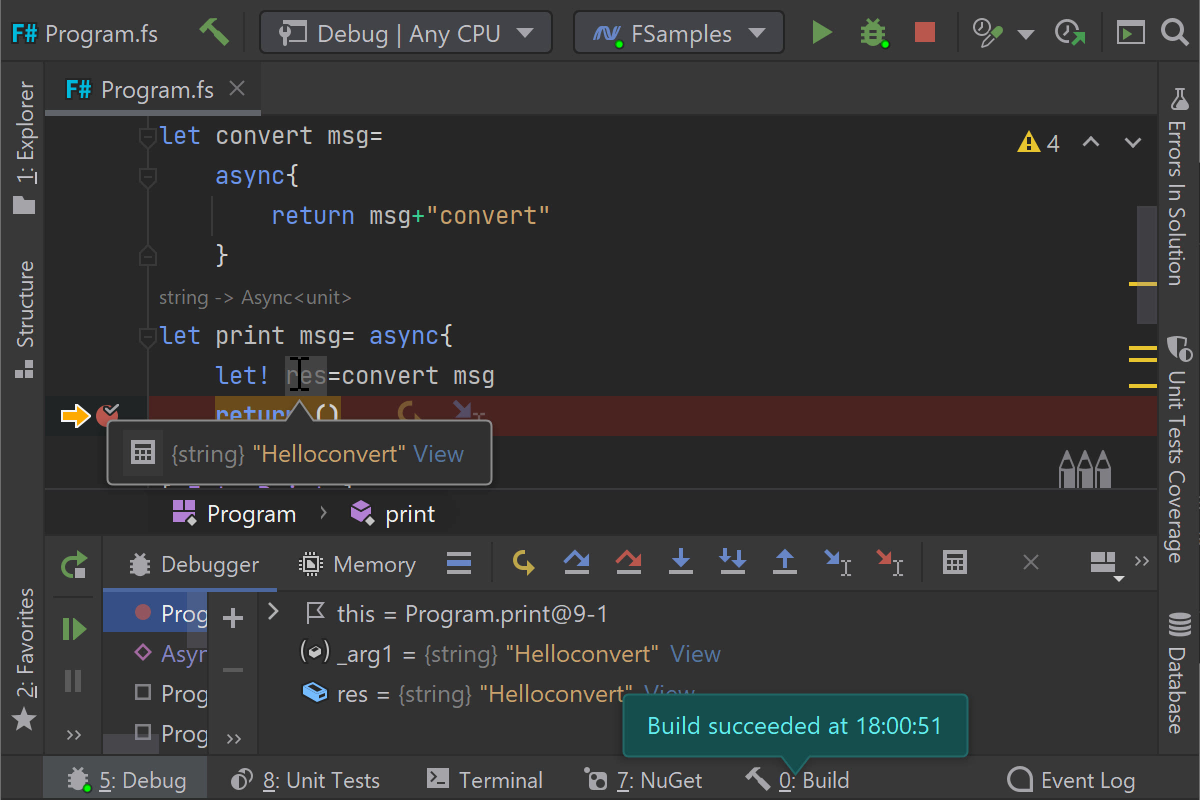
- For the F# plugin, we’re glad to introduce some long-awaited improvements in debugging async workflows. The debugger now keeps track of the local variables properly.
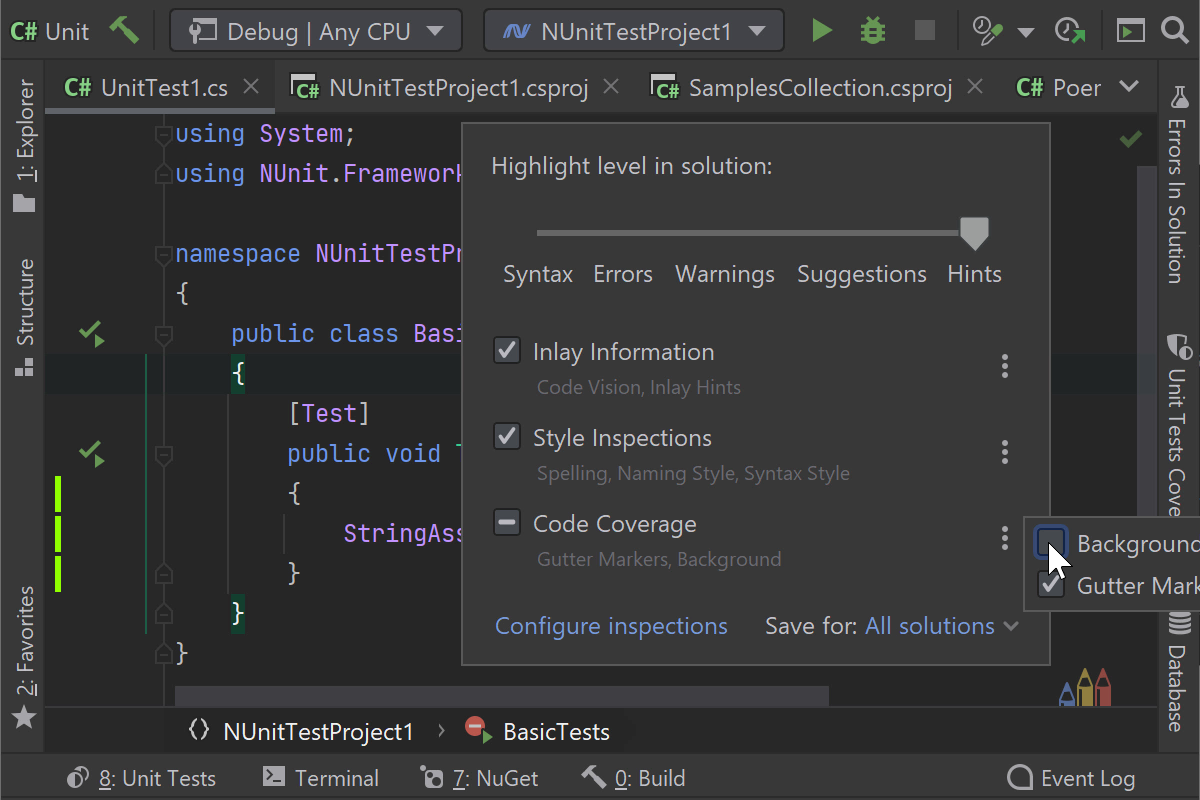
- Code coverage highlighting provided by the dotCover plugin can be turned on and off from the plugin settings or from the “Configure highlighting level” popup (look for the Pencils icon) – enable it easily when you need it.
Other updates
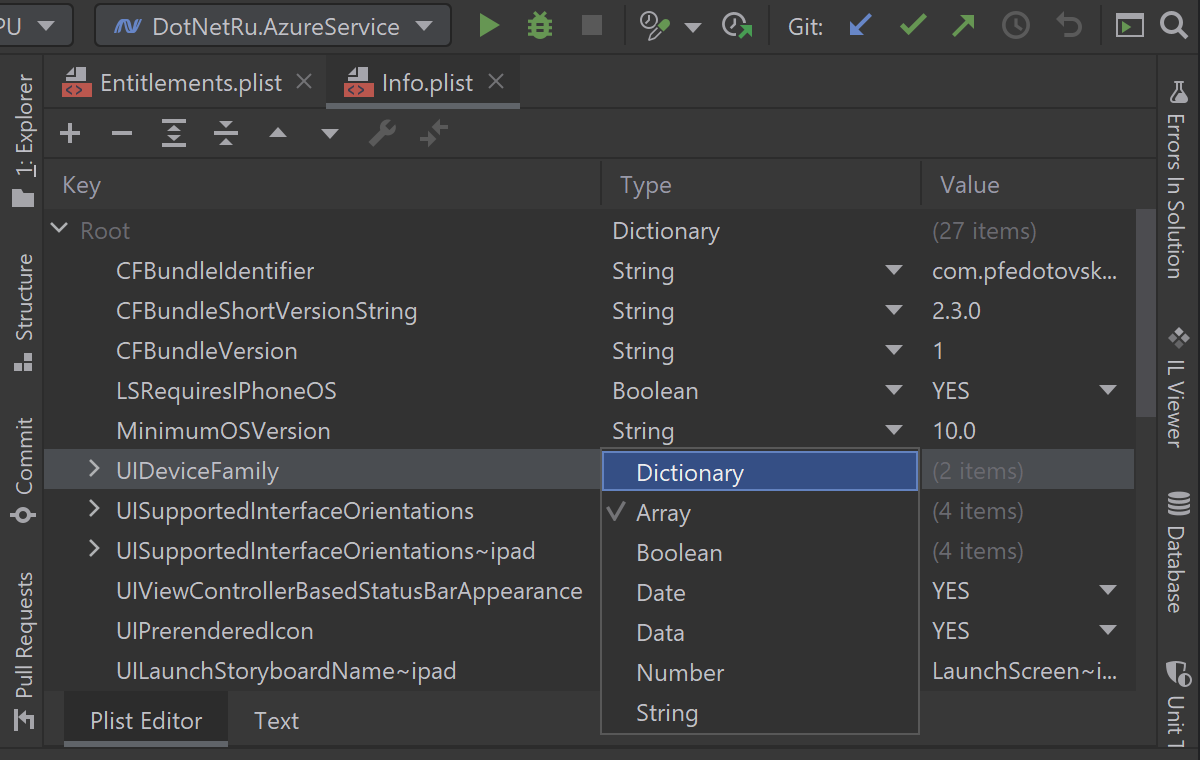
- We’ve added a rich editor for
Info.plistfiles in Xamarin.iOS projects. It is available on all supported platforms.
- We had an issue with publishing .NET Core projects that reference .NET Standard projects; it has been fixed, and the projects can now be successfully published to folder.
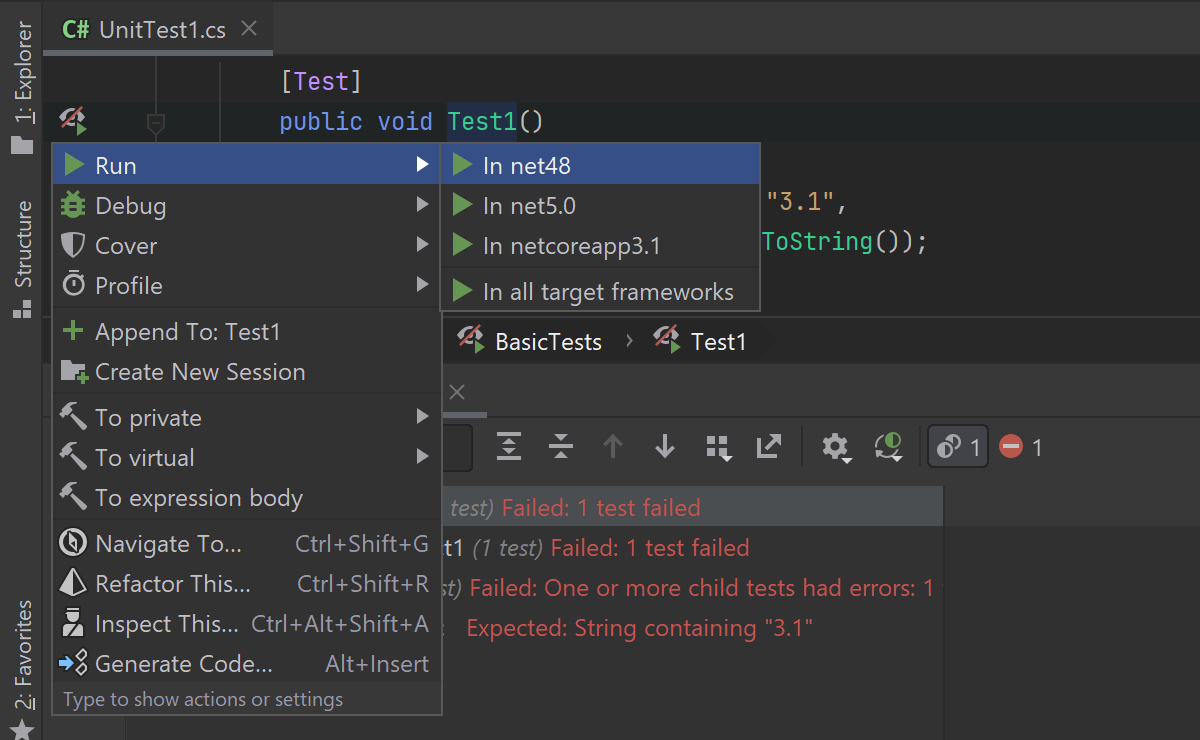
- Unit tests can now be launched in your preferred target framework directly from the editor. This can save time and clicks!
There are several ways you can take part in the 2020.3 EAP:
- Download and install the EAP build from www.jetbrains.com.
- Use our Toolbox App.
- Use this snap package from the SnapCraft store (if you are using a compatible Linux distro).
We’re eager to hear your feedback. Please add your comments below or file an issue in our public bug tracker.
Prev post Webinar – Blazor – C# in the BrowserReSharper 2020.3 Early Access Program Begins Next post


