

.NET Tools
Essential productivity kit for .NET and game developers
Debugging third-party code with Rider

If you are using any third-party library, either via NuGet or other sources, you probably have experienced the case where something does not work as expected. To figure out what’s going on we sometimes need to debug into that third-party library (or even just the .NET Framework itself). Making that work is usually another painful process in itself, setting up symbol servers and finding matching PDB files etc. Usually by the time you get this all working, you forgot what you wanted to debug in the first place.
The latest Rider 2017.3 EAP build solves all of the above, and makes stepping into third-party code a breeze! Here’s a simple ASP.NET application where we will use Step Into (F11) to debug the ASP.NET Core source code.
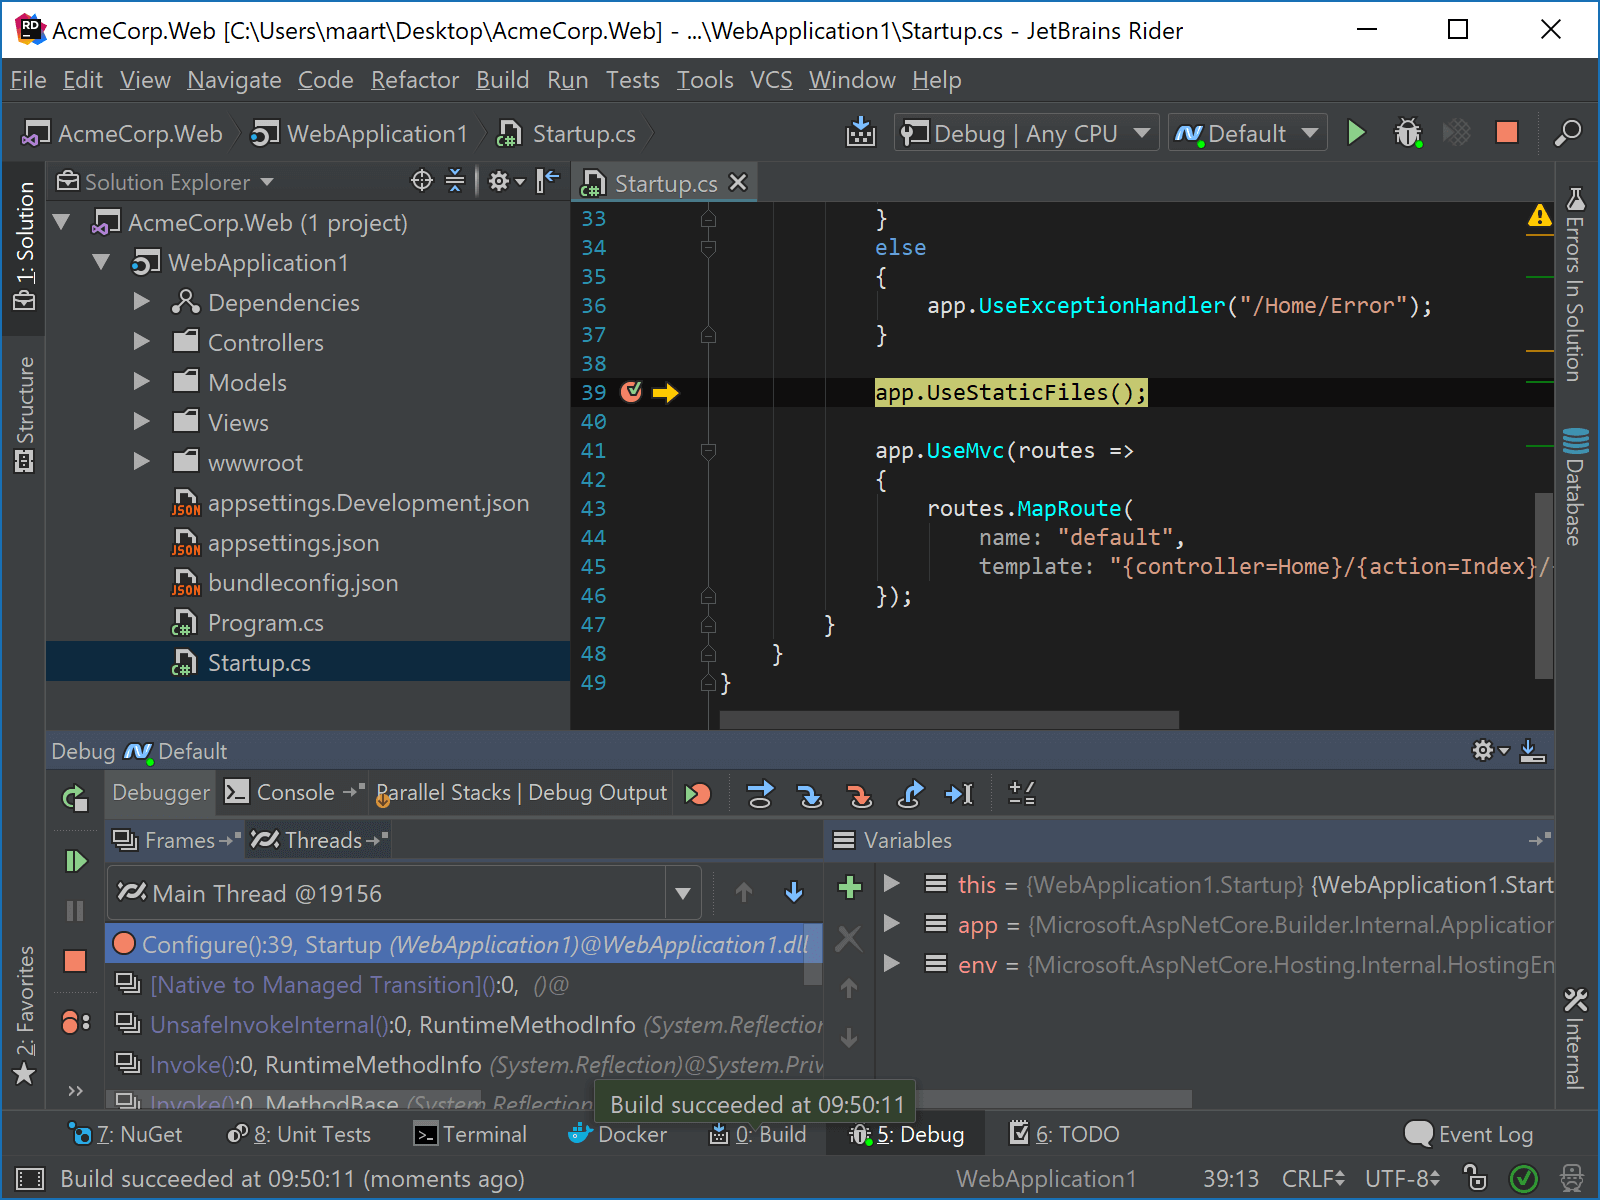
We’ve just stepped into ASP.NET Core’s StaticFileExtensions, and even into .NET Core’s Array class – debugging third-party code without any effort!
Rider accomplishes this feat by using the dotPeek decompiler, decompiling third-party code on the fly and injecting it into the debugger. Note that support for downloading existing PDB’s and things like SourceLink is not there yet.
The first time we step into third-party code, Rider will show a notification mentioning decompilation occurs, and we can optionally disable it there. Debugging of third-party code can be enabled/disabled from Rider’s settings under Build, Execution, Deployment | Debugger, then Enable external source debug. If at any point you’d like to clear the decompilation cache, you can remove the data in %USERPROFILE%\.Rider2017.3\config\resharper-host\DecompilerCache.
Debugging third-party code is possible in full .NET Framework and .NET Core. Mono support is being worked on. This means we can pull of the same trick on Linux or Mac OS X with .NET Core!
Setting breakpoints in third-party code
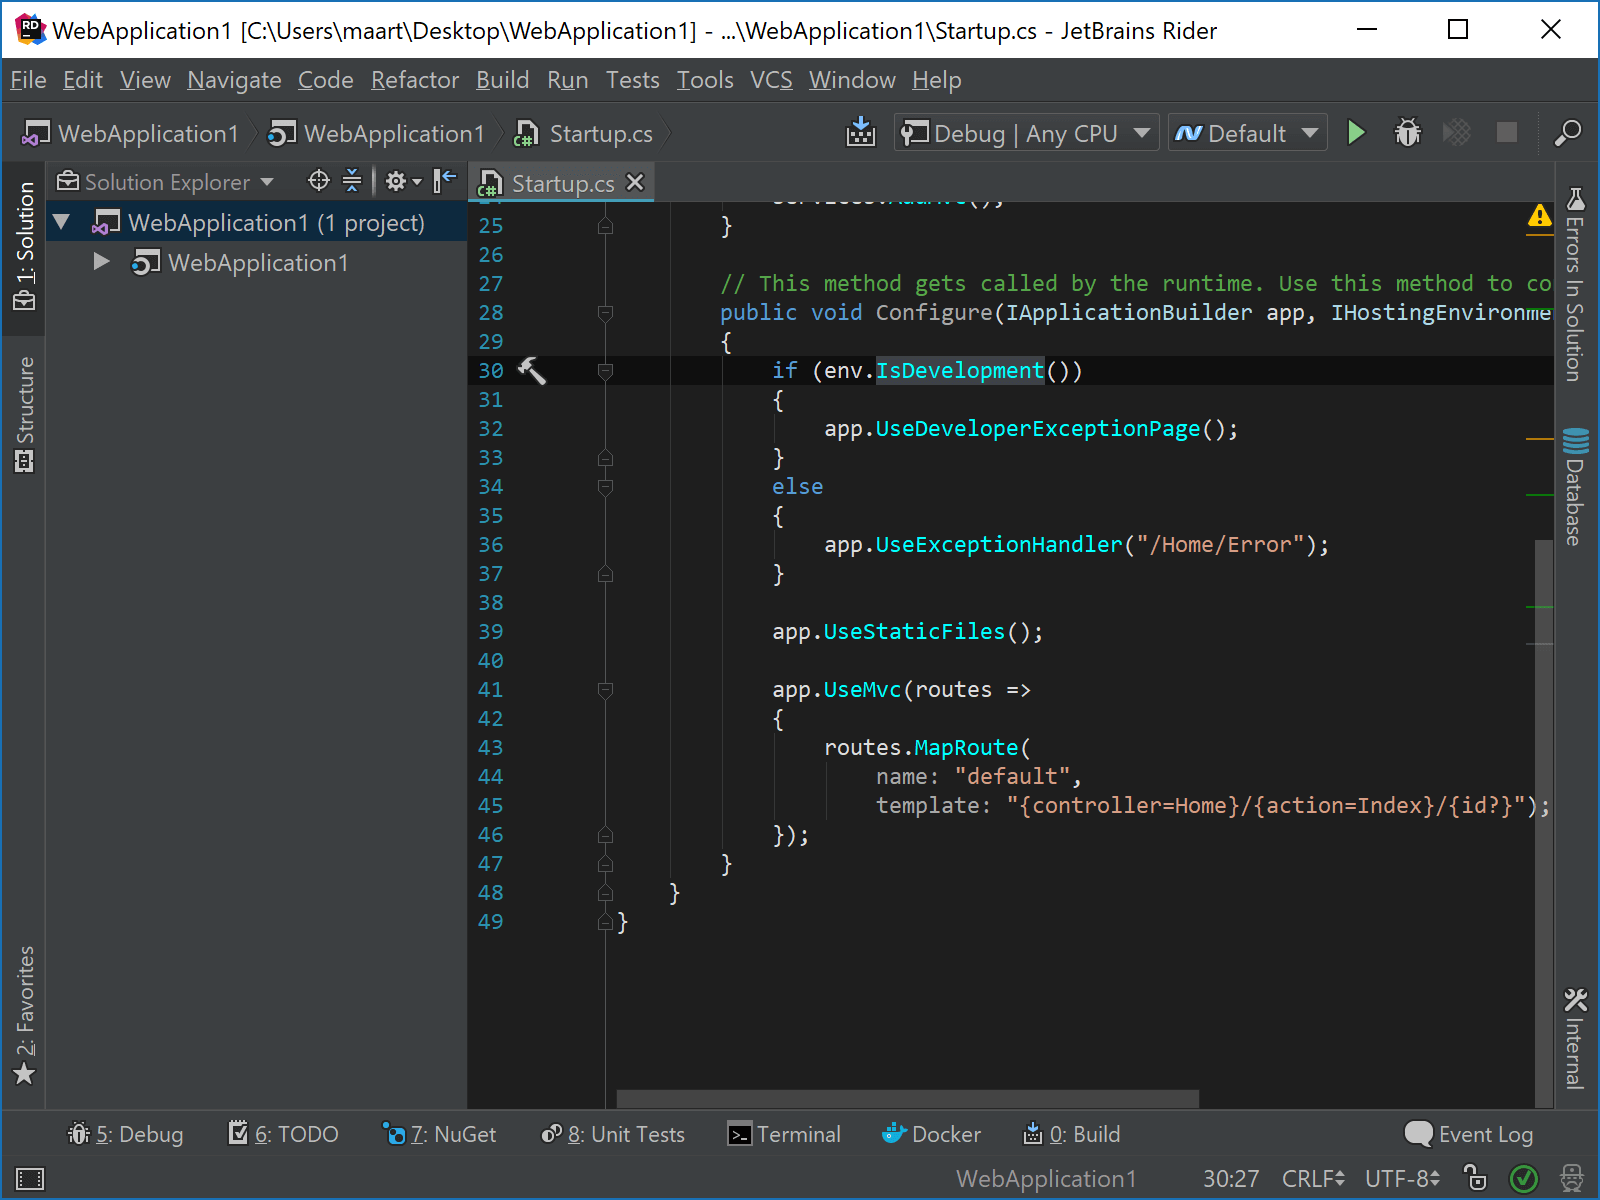
In Rider, we can Ctrl+click into a class or method (or use Navigate To – Alt+` or any of our other navigation features). This works for our own code, but also for third-party code thanks to the integrated decompiler. Rider now supports setting breakpoints in decompiled code, and during a debugging session will suspend execution if a breakpoint is hit!
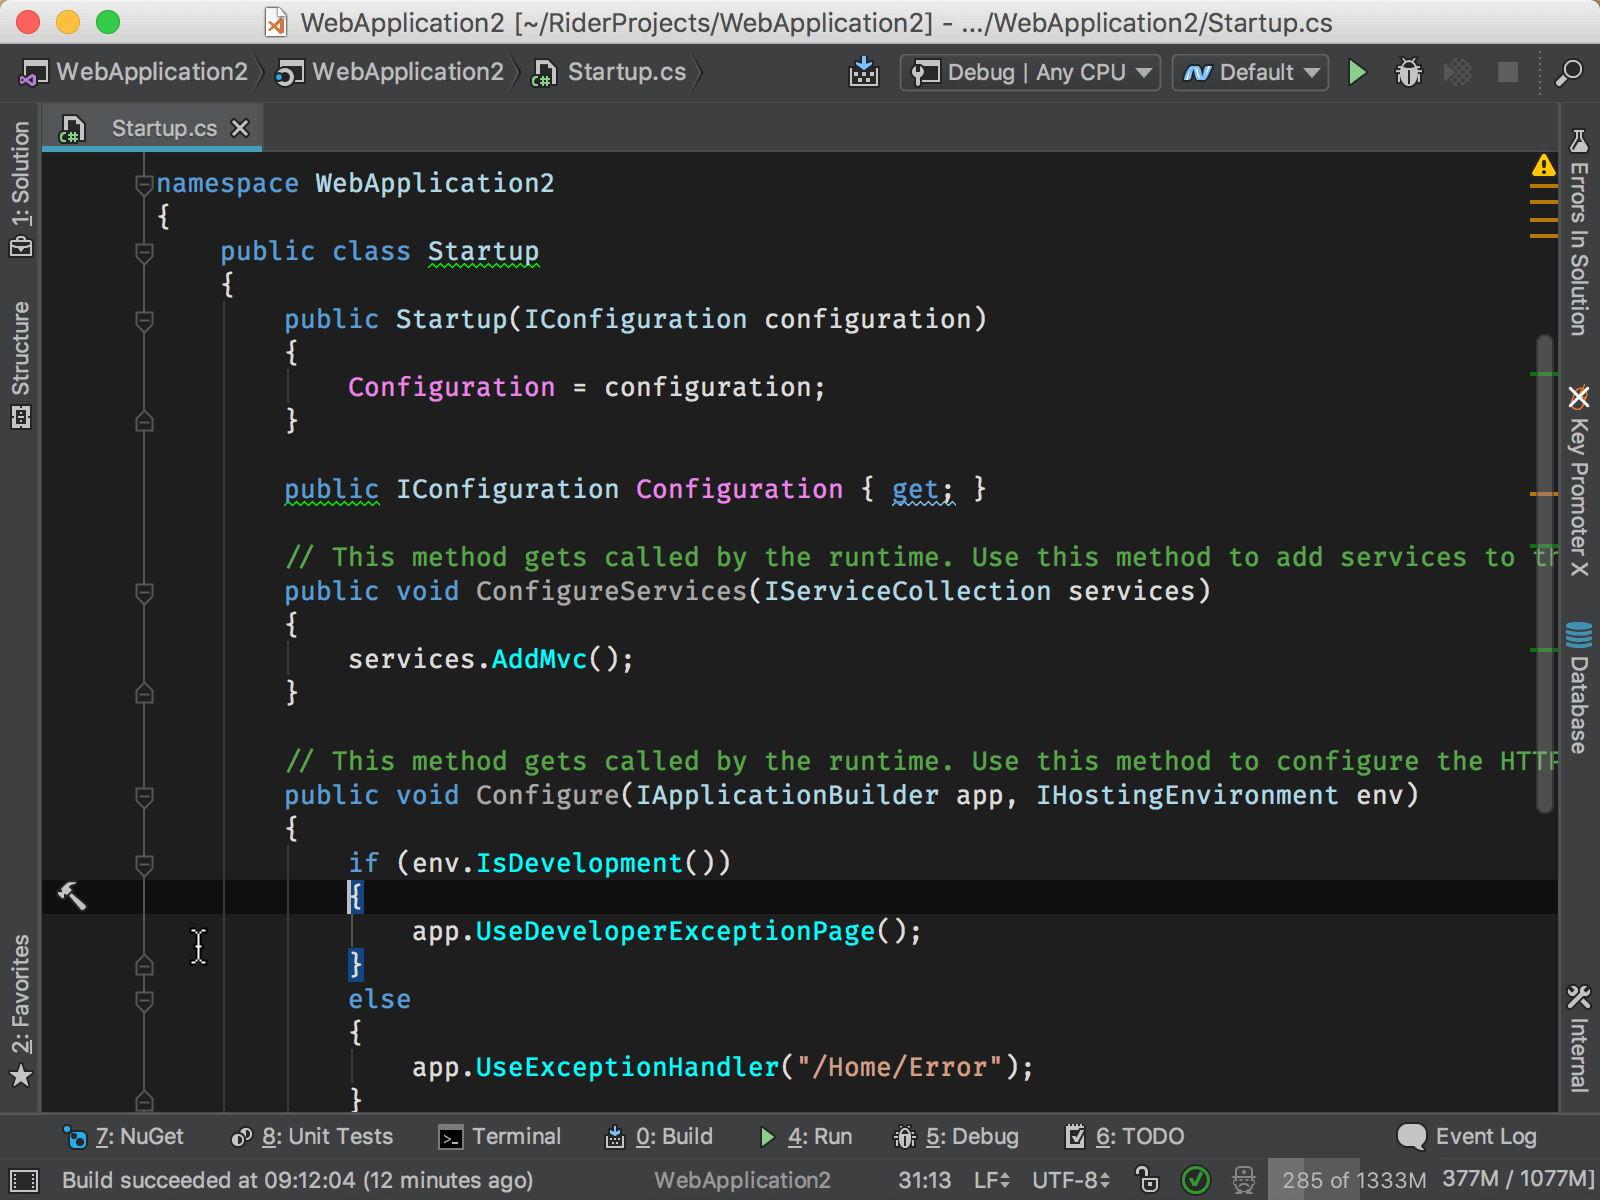
Let’s navigate into one of ASP.NET Core’s methods, add a breakpoint there, and then start the debugger:
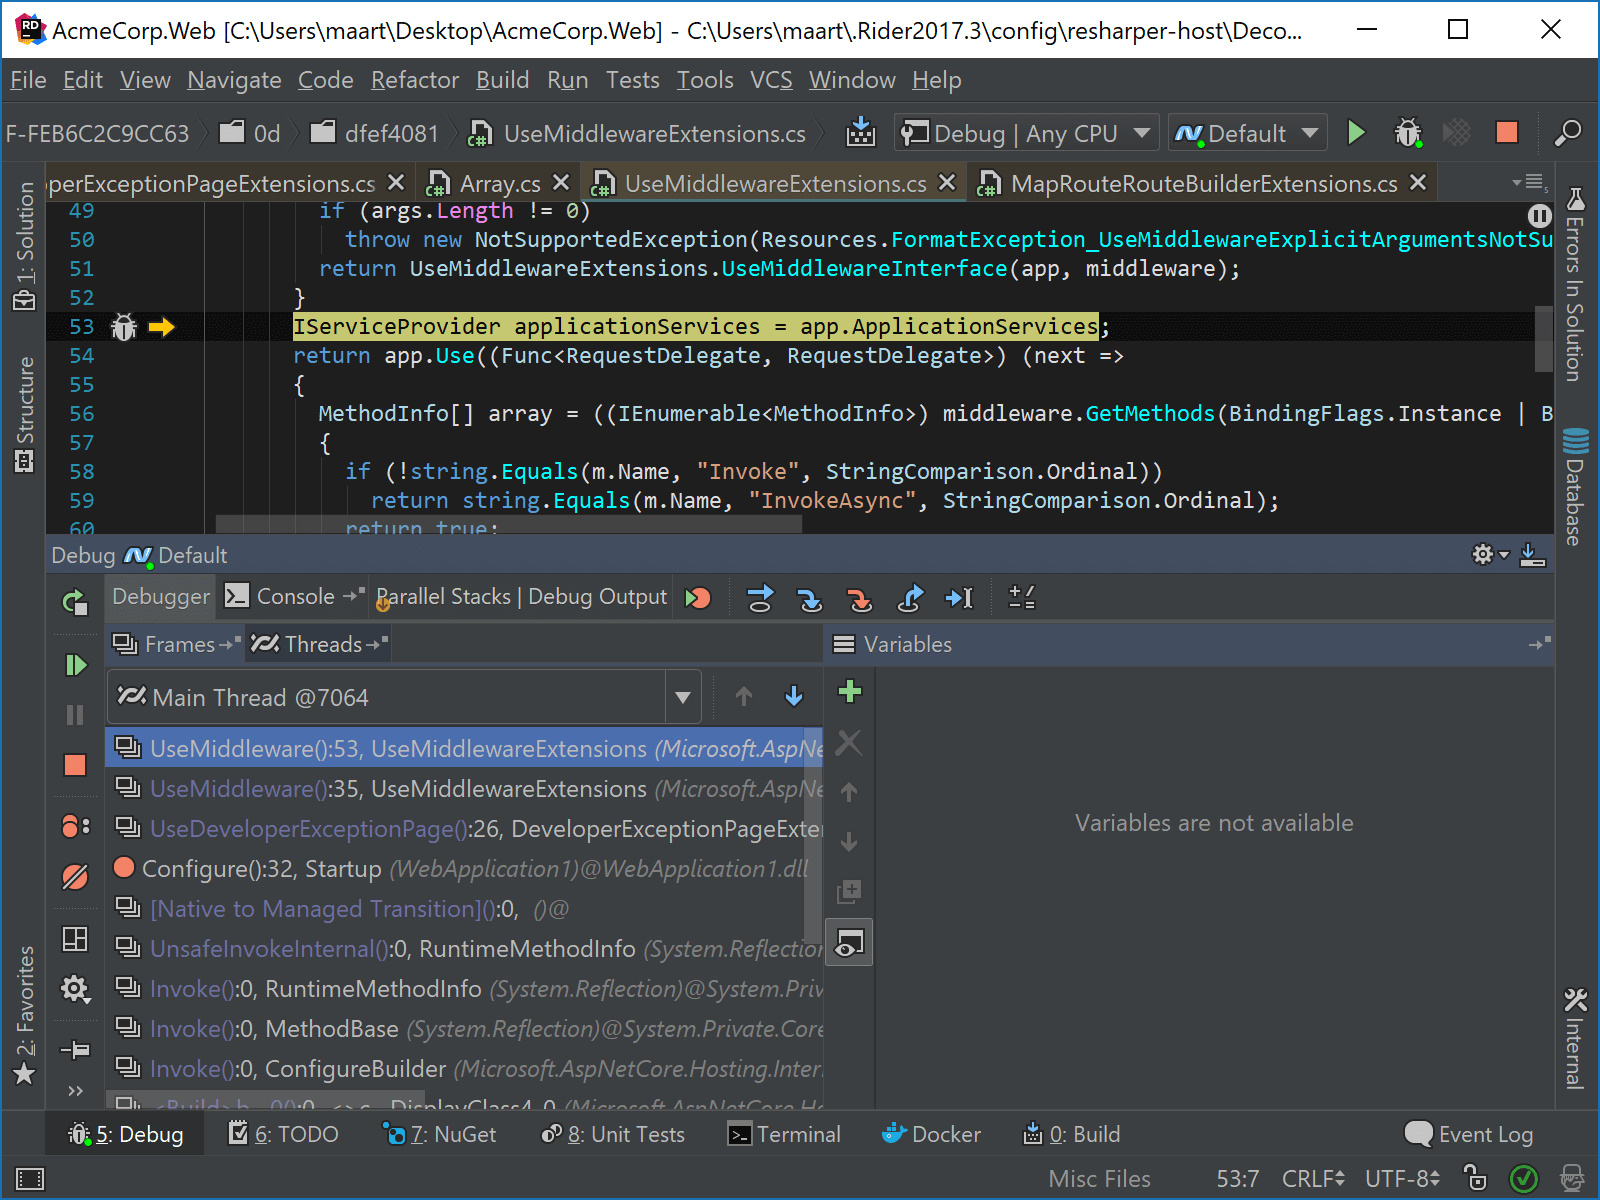
Navigating the stack trace with third-party code
During a debug session, we can always see the stack trace in the Debugger tool window. When double-clicking any stack frame, Rider will either navigate to the code directly (if it’s in our own codebase), or decompile the code for that stack frame and open it in the editor.
Attach to a running process
Another nice example of where this feature comes handy is attaching to a running process. From any open project (or from an empty solution or open folder), we can use the Run | Attach to Local Process… (Ctrl+Alt+P) and attach to any running .NET or .NET Core process.
Once attached, we can pause execution at any point in time and start exploring the running application in the debugger. Even if we don’t have the sources available!
We can also place breakpoints in external code. For example using Go to Everything (Ctrl+T), we can navigate into third-party code and add a breakpoint there. While debugging, Rider will pause execution when we hit the breakpoint:
https://youtu.be/hK7OMSej4iU
PS: If you wish to debug third-party code in Visual Studio, you can follow the steps in this guide on setting up dotPeek as a symbol server.
Give the latest Rider 2017.3 EAP build a try and let us know what you think of debugging third-party code!


