

.NET Tools
Essential productivity kit for .NET and game developers
Rider EAP 23: .NET Core debugger is back, Code Cleanup, and more

There’s a new Rider EAP build available for download, and it’s full of changes, large and small, including Code Cleanup, new project and solution settings, VB.NET project templates, F# unit testing, an updated console, per-framework Solution Wide Analysis results, as well as hundreds of bug fixes.
However, one thing clearly stands out:
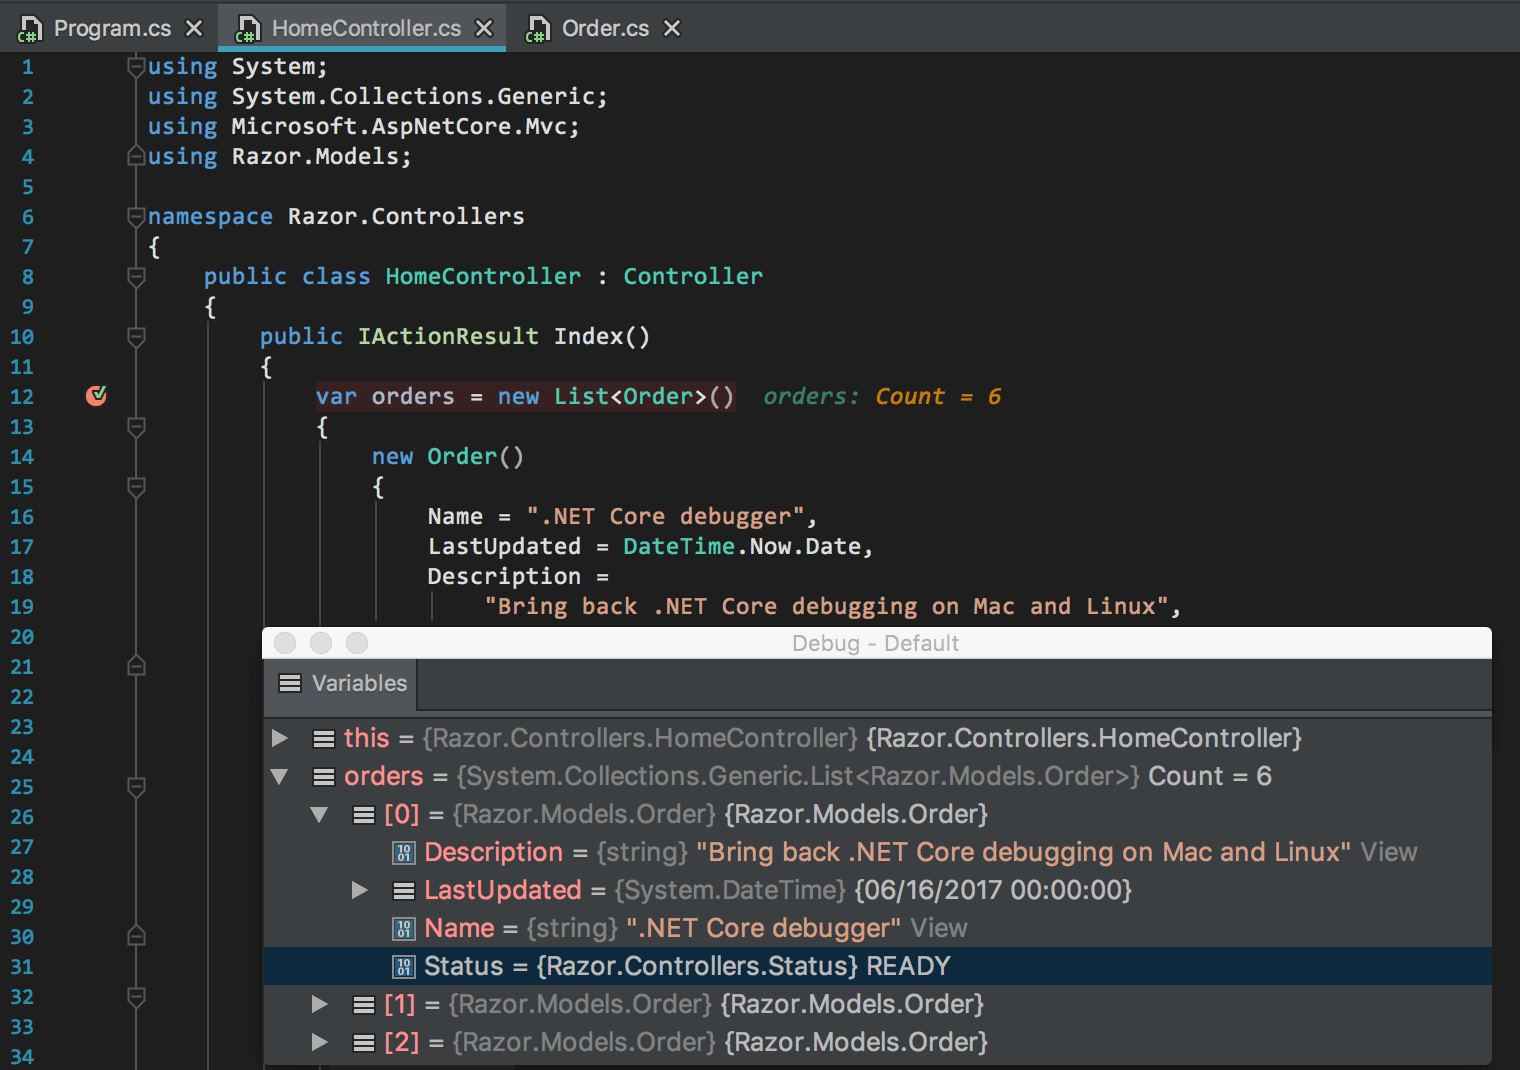
.NET Core debugger is back on Mac and Linux
Back in February, we were forced to temporarily disable .NET Core debugging due to a licensing issue (for a recap, here’s what happened). Restoring the functionality on Windows was fairly straightforward (it only took us one week); Mac and Linux, not so much.
Finally, following a few months of reading, writing and debugging code, scratching heads, testing and fixing, we’re ready to roll it out: you can debug .NET Core on OS X and Linux again.
What else to say? Thanks for bearing with us.
In related news, Rider can now use MSBuild shipped with .NET Core SDK. In practical terms, what it means is that you no longer need Visual Studio on Windows or Mono on Mac/Linux to open and build .NET Core projects with Rider.
Rider has received more debugger improvements in this build, such as the following:
- .NET Core debugger’s Console view is working again on Windows, Mac, and Linux, including input/output redirection.
- There’s now a Results view in Variables for enumerables where items are enumerated and shown as a list.
- Backing fields are no longer shown as duplicate items in the Variables tab.
- 30+ more debugger fixes, including an annoying issue resolving breakpoints to symbol documents (RIDER-6330).
Code Cleanup
Rider thrives on making ReSharper features available on the IntelliJ platform. However, some ReSharper features (especially if they involve custom UI) require substantial porting effort, and Code Cleanup is certainly one of these. However, in this EAP, we’re finally introducing the initial implementation of Rider’s own Code Cleanup:
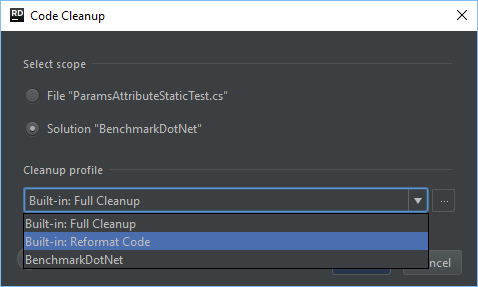
Depending on the selected cleanup profile and your preferences, applying Code Cleanup on a file or a wider scope will simply reformat your code, or additionally apply code style rules and remove code redundancies: the list of actions that Code Cleanup supports is really long.
As of this EAP, Rider’s Code Cleanup doesn’t let you customize profiles (this is work in progress) but if your solution contains saved ReSharper settings, Rider will respect them and expose cleanup profiles that are defined in them.
F# unit testing and more improvements
Rider’s F# plugin has received a few notable improvements that make use of the underlying ReSharper infrastructure.
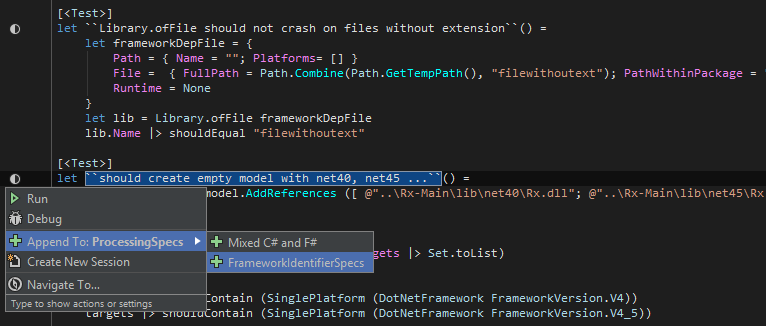
You can now run and debug NUnit or xUnit unit tests. Tests and test fixtures are discovered, highlighted in the editor, and are available to run, debug or add to sessions via the Alt+Enter menu. If necessary, you can run tests written in C#, VB.NET and F# in the same test session.
Rider’s Extend Selection and Shrink Selection are now available in F# code, letting you successively select expanding logical blocks of code, and vice versa.
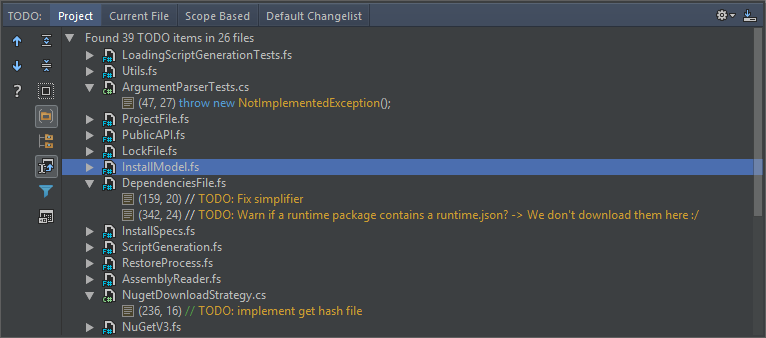
Finally, Rider learns to take F# code into account when it looks up your solution for to-do items and displays them in the TODO view:
Target frameworks in Solution-Wide Analysis
Rider’s Solution-Wide Analysis has been extended to understand target frameworks. If your solution contains code targeting multiple frameworks (such as .NET Core and .NET Framework, or multiple versions of .NET Framework), the Errors in Solution tool window will let you filter errors by framework, or, if you choose to show errors that affect all frameworks, you can see which target frameworks are affected by each particular error.
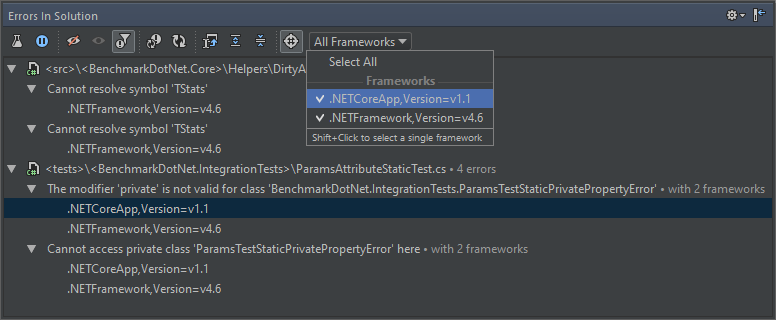
You don’t always want to display target frameworks under all error items, and you can toggle this presentation with the Show Frameworks in Tree toggle button in the toolbar.
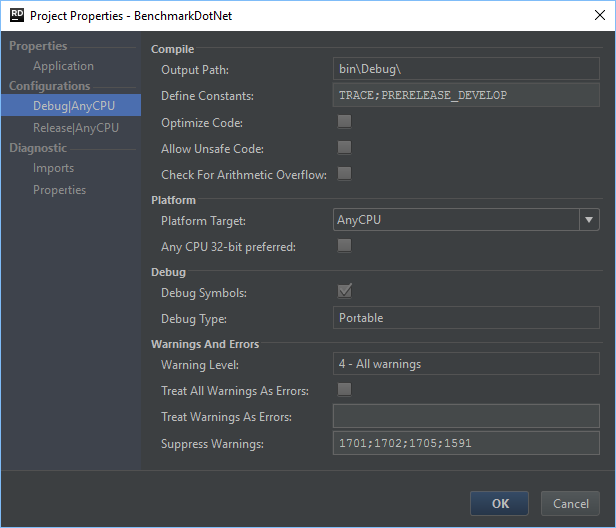
Projects and settings
We have reworked the Project Properties window to make it accommodate more project configuration items and have a saner UI:
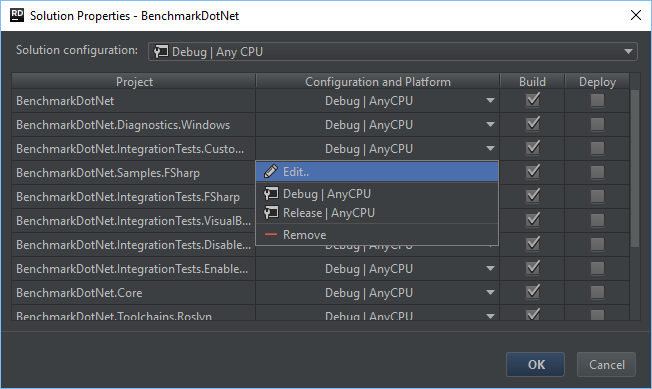
On a related note, there’s now a Solution Properties window that lists and lets you manage debug/release build configurations available on solution level and and per-project:
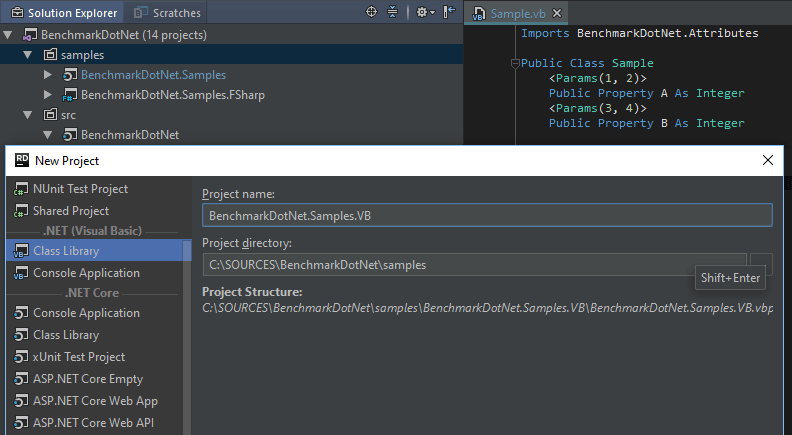
Rider allows creating quite an array of various .NET project types, but prior to this build, the list didn’t include any VB.NET project templates. This is now fixed as class library and console application templates are available for VB.NET:
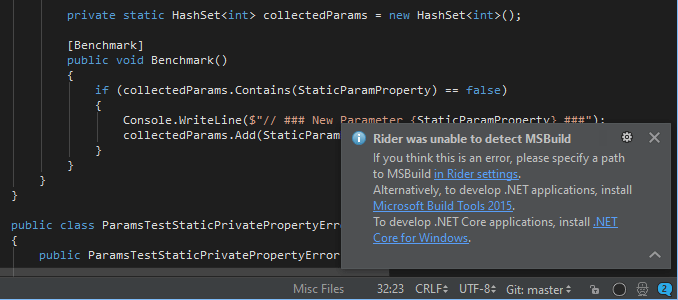
We are putting considerable effort into clearly notifying you about any required toolsets, SDKs and other components that Rider needs to operate correctly. In this EAP, we have introduced a set of diagnostic notifications that Rider shows when it fails to load projects in your solutions:
Web.config and MSBuild files
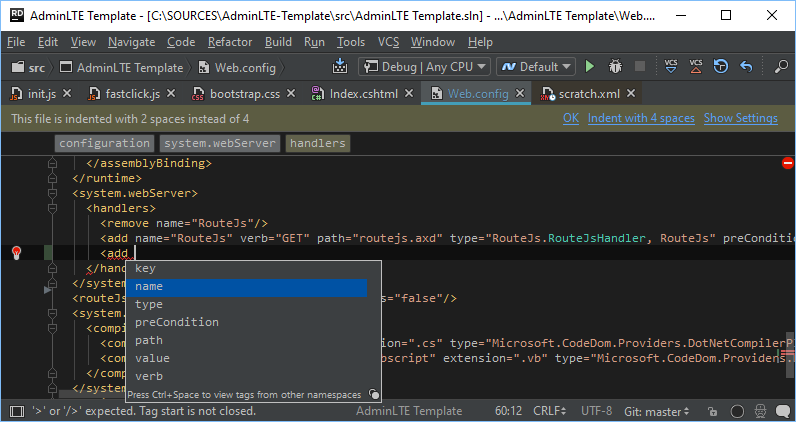
This EAP improves support for web.config (and whatever.config) files: we have brought a set of Rider’s XML features to .config files, such as typing assistance, tag and attribute completion, navigation to namespaces, code formatting, and XML structure view in the editor:
On a related note, a built-in XML schema for MSBuild files (.csproj, .targets etc.) improves XML validation and enables smart code completion.
Reworked console
The console that Rider shows in the Run tool window has been reworked, which hopefully removes a series of annoying bugs such as weird characters on executing Console.ReadLine(), broken Console.ReadKey(), and incorrect cursor behavior.
More improvements
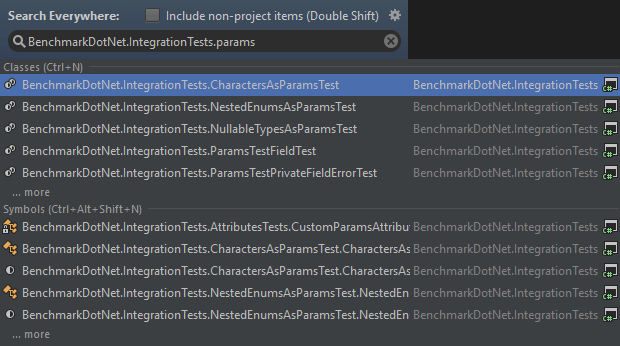
- Search Everywhere now understands combo searches that are separated by dot (in addition to whitespace separators):
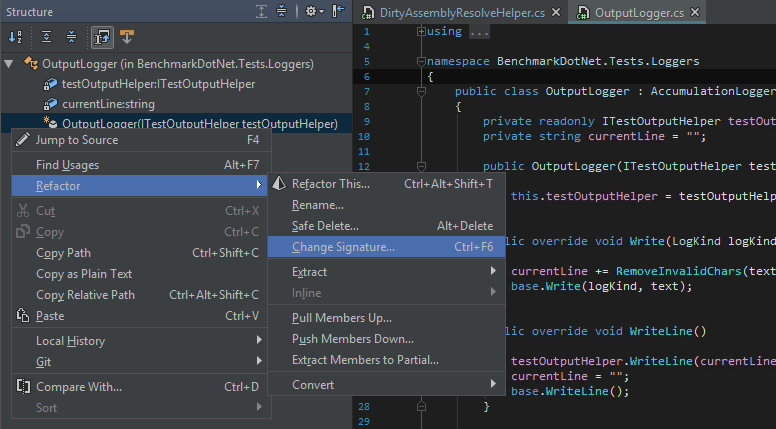
- The Refactor submenu in context menus now properly displays ReSharper refactorings where applicable. This also makes refactorings available in the Structure view:
- Various fixes in code highlighting: no more empty tooltips; less literal highlighter blinking; better highlighting across color schemes; no more duplicating Colors & Fonts settings pages for web languages.
- We finally stopped showing IDE theme samples written in Java when you launch Rider for the first time :)
The obligatory closing paragraph
Get the latest Rider EAP build and try it out. Please reach out to us if you face any critical issues.


